Project Category: Chemical
Join Our Presentation
April 5, 9:30 AM to 1:30 PM
About Our Project
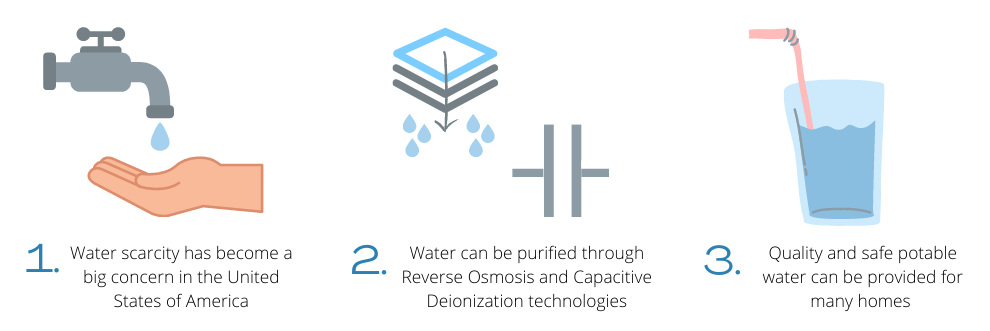
The purpose of this project is to design a brackish groundwater desalination plant for the production of potable water in California, with the consideration of the desired product, by-products, and waste. hydro-CDI has designed a plant that is capable of producing 50,000 m3/day of potable water, enough for 150,000 people, in a sustainable, economic, and efficient way. Our design is innovative as it combines the usage of a reverse osmosis unit and a capacitive deionization unit to address brine disposal, which is the main challenge associated with membrane desalination.
Watch our video to learn more!
Meet Our Team Members


Details About Our Design
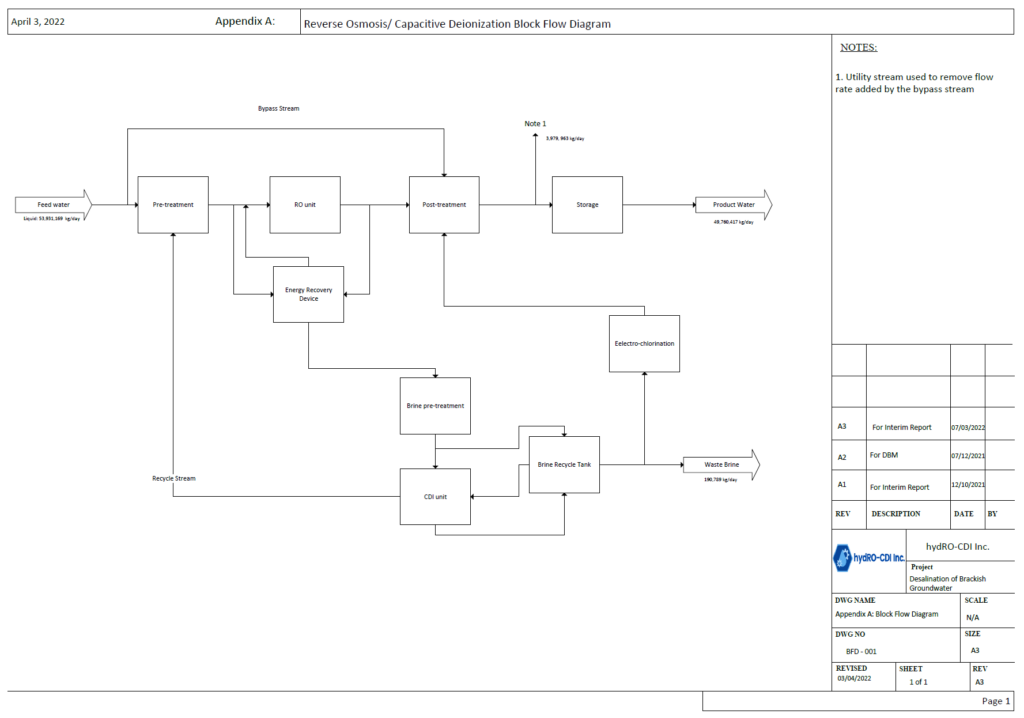
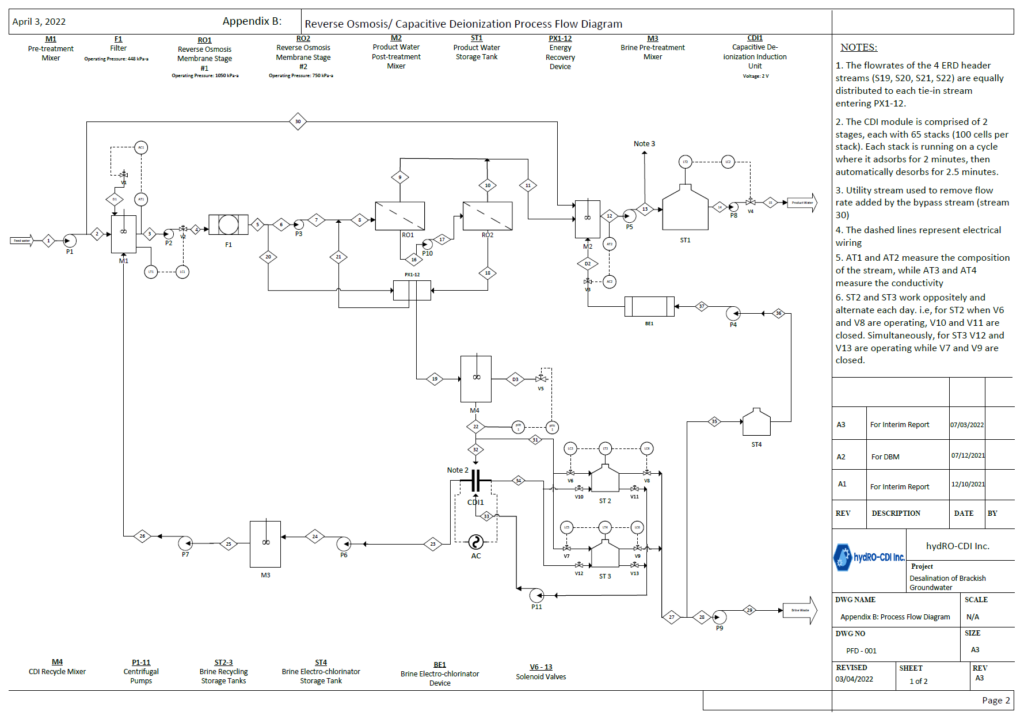
The process design for the brackish groundwater desalination facility consists of the technologies of reverse osmosis (RO) in combination with capacitive deionization (CDI). The process involves the pre-treatment of the groundwater with sulfuric acid and an antiscalant before entering a cartridge filtration system and then a two-stage RO unit with an overall recovery of 75%. The permeate from the RO membranes is sent to a post-treatment agitator tank where blending with feed water occurs for remineralization to meet California Secondary Drinking Water Standards. To mitigate the amount of brine disposal, the volume of RO concentrate is minimized by 99% by further treating it in the CDI unit, where the desalinated water is recycled back to the start of the process. A drawback of the RO unit is the requirement for a high-capacity pump, which is mitigated using pressure exchangers (PX). As a result of the energy recoveries from the PX and CDI unit, the energy required for the high-capacity pump and CDI modules are each reduced by 50% compared to a conventional process with no energy recovery methods implemented.

DESCRIPTION OF MAJOR UNITS
Pre-treatment
It is crucial to consider how water can be pre-treated to extend the lifetime of the filters and membranes. In this process, the brackish feedwater is combined with sulfuric acid, an antiscalant additive, and a recycle stream from the CDI unit all within an agitator tank. If the water is left untreated, the high saturation levels of salts like calcium carbonate, barium sulfate, and calcium fluoride would cause undesired levels of precipitation in the membranes, causing them to foul and require more frequent replacement.
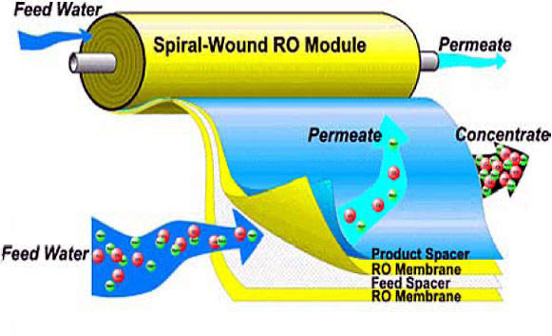
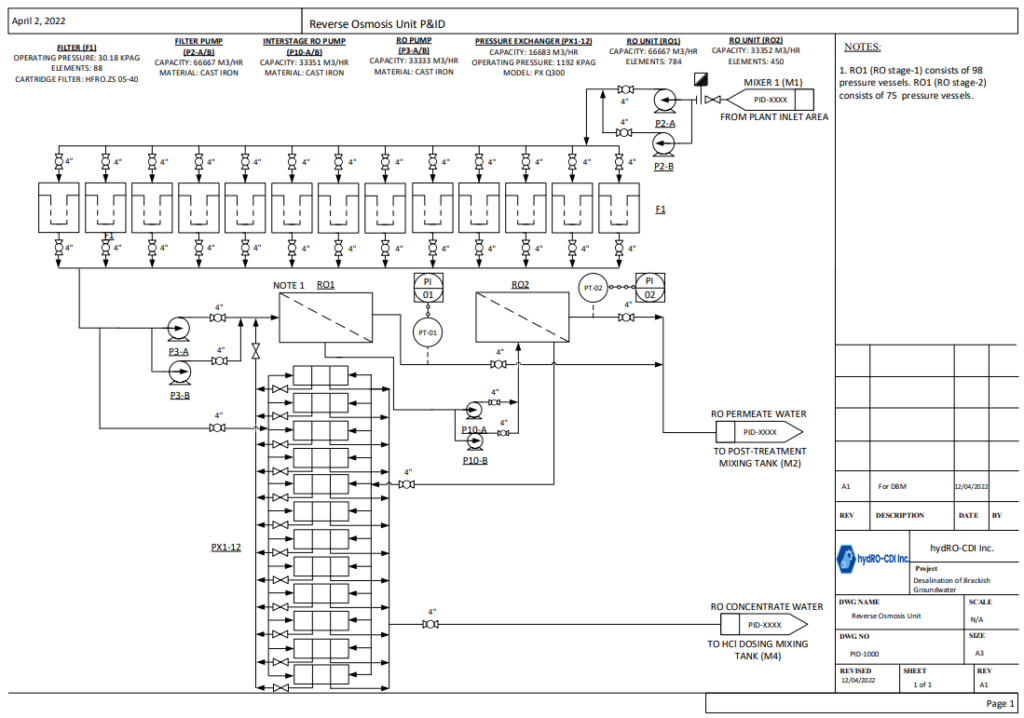
Reverse Osmosis (RO) Unit
In the RO unit, the water is pressurized against the membranes to remove any remaining contaminants. The RO unit has an overall recovery rate of 75%, where each stage has an array recovery of 50%. For our design, the brine from the first RO stage is pumped into a second RO stage for further purification, a process called brine-stage separation. The remaining brine from the membranes is sent to the CDI unit.
Post-Treatment
It is important to ensure the best quality of water for consumers. The permeate water from the RO unit is sent to an agitator tank to mix with post-treatment chemicals. To be in accordance with the California Secondary Drinking Water Standards, calcium carbonate is added to increase the untreated permeate pH and a feed bypass stream is connected to this tank to increase the total dissolved solids measurement. Bleach is used for disinfection to get rid of any unwanted bacteria. The product water is pumped to a storage tank and then sent out for distribution.
Pressure Exchangers
The RO concentrate will then leave the second RO unit where the energy of this stream will be partially recovered through 12 pressure exchangers. Installing this Pressure Exchanger array will reduce the RO pump’s energy requirements by 50% cutting the cost and energy associated with the pump by approximately $70M over 30 years of operation.
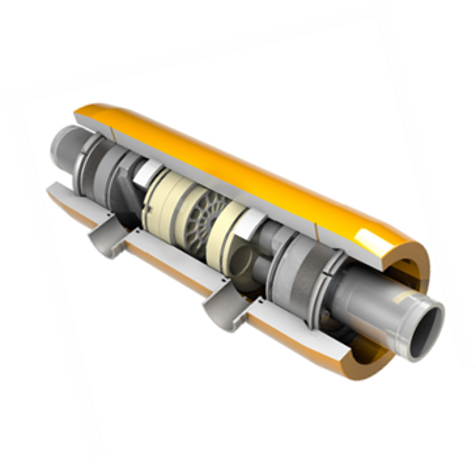
Capacitive Deionization (CDI) Unit
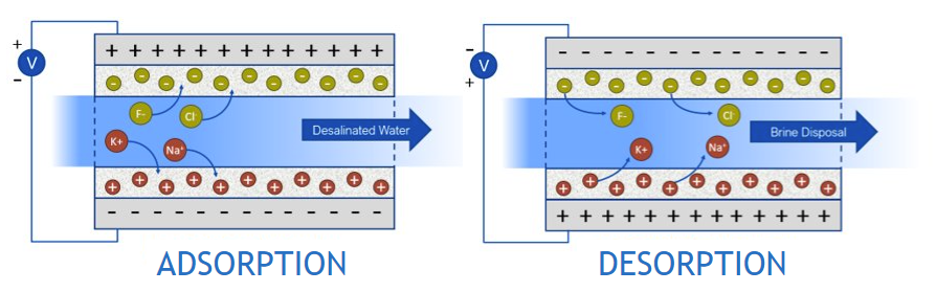
The CDI removes ions from water using a voltage between a pair of electrodes. One electrode which is positively charged adsorbs anions and the other electrode which is negatively charged adsorbs cations. The CDI typically goes through 2 cycles: adsorption where the ions are adsorbed from the water, and desorption where the ions are removed for disposal when the electrodes are saturated with ions.
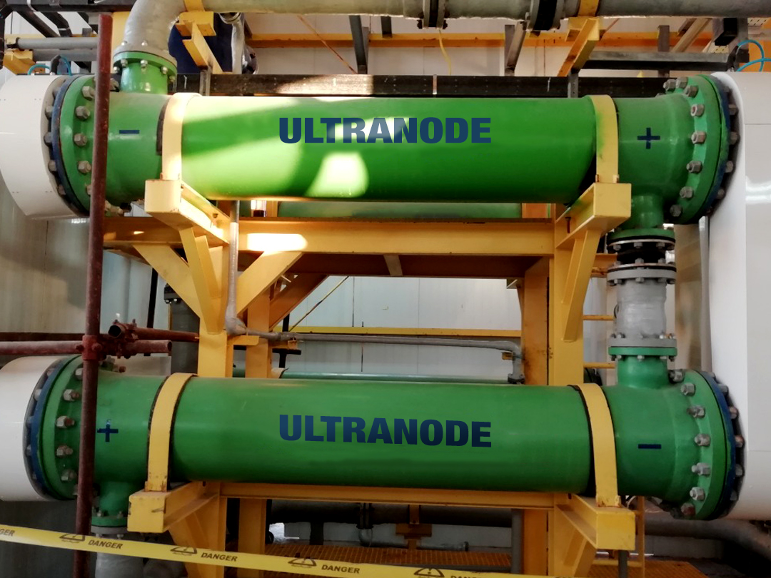
Electrochlorinator
The brine electrochlorinator is a system that takes a portion of the brine solution (6 m3/day) and electrochemically converts it to the sodium hypochlorite (bleach) solution required for disinfecting the product water. It is comprised of MMO anodes and titanium cathodes and is powered by electricity to drive the electrolysis process. The product water will be treated at 1 ppm which is aligned with California’s free chlorine residual target range (0.2 to 1 ppm).
Brine Recycling
Brine recycling is a method that shows promising results in making energy recovery in CDI more efficient and significantly reducing the brine waste to be more environmentally favorable. This strategy of operating CDI is based on replacing the electrolyte when deionization finishes, and regeneration begins. The procedure is designed to have a deionization stage where the liquid flowing through the system is untreated water and is followed by a regeneration step in which the fluid is a concentrated brine solution. Overall, implementing brine recycling reduces our brine production by 99%.
HOW DOES OUR DESIGN ADDRESS PRACTICAL ISSUES?
According to the global water institute, 700 million people could be displaced by intense water scarcity by 2030. Many regions in the US have endured water shortages in the past decade, yet they contain available underground brackish water deposits that could be converted into safe water for everyday household use. Our desalination plant will provide potable water for 150,000 residents of Kern County, California by desalinating water from brackish water deposits located in the area. The project is also expected to generate 170 employment positions, which will contribute to the decreasing unemployment rate in California.

WHAT MAKES OUR DESIGN INNOVATIVE & EFFECTIVE?
Desalination plants are traditionally comprised of technologies such as RO (reverse osmosis), MSF (multi-stage flash distillation), and MED (multi effect distillation). These technologies entail negative environmental impacts (brine disposal and GHG) and high energy consumption. Therefore, the CDI unit (capacitive deionization) has been incorporated in our design to mitigate these issues.
The CDI unit (CDI1) is an emerging desalination technology that has proven to be a cost-effective option for brackish water applications. We consider this hybrid design between the RO and CDI units to be the most innovative feature of our design. The purpose of the CDI unit is to further treat the RO concentrate such that more water can be recycled back into the system. The advantages of having this CDI unit and recycle line are summarized below:
- Reduces feed water requirements to further ensure the sustainability of this key water source in California
- Reduces volume of brine disposal by 99% with the integration of brine recycling such that the cost of deep-well injection and associated environmental impacts are minimized
- Improves process performance by increasing the overall water recovery in an energy-efficient way
Additionally, we have incorporated pressure exchangers (PX1-12), CDI energy recovery devices (ERD), and a brine electro-chlorination system (BE1) in our design. These systems help to further minimize operating costs, GHG impact, and the volume of brine. The operation and benefits of each system are described below:
- Pressure exchanger (PX1-12): Takes the high-pressure RO concentrate stream and transfers the stream’s energy to the inlet of the RO system. This reduces the pressure requirements, and hence, energy cost of the RO pump by 50%.
- Brine Recycling: This strategy of operating CDI is based on replacing the electrolyte (liquid flowing between the electrodes) when adsorption finishes, and desorption begins. When a CDI cell is adsorbing, the water flowing through the system is untreated water, and when the CDI cell is desorbing, the water flowing through the system is a concentrated brine solution. Implementing this strategy improves the operation of the CDI energy recovery devices as well as reduces the overall brine disposal by 99%.
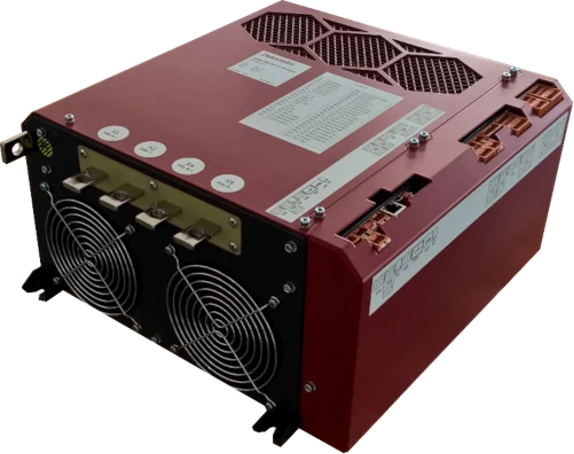
- CDI energy recovery device (ERD): A DC/DC converter is placed between each two adjacent CDI stacks. Implementing energy recovery in combination with brine recycling reduces the power consumption of the CDI unit by 50%.
- Brine electro-chlorination system (BE1): Electrochemically converts a portion of the brine waste (6 m3/day) into the sodium hypochlorite solution needed for disinfecting our product water. This reduces our brine disposal, deep-well injection cost, and we avoid the chemical cost of the disinfectant.
Overall, the resourcefulness of our process and the use of current technologies allows our design to mitigate traditional issues in the desalination industry and that is what makes our design innovative and effective.
HOW DID WE VALIDATE OUR DESIGN SOLUTION?
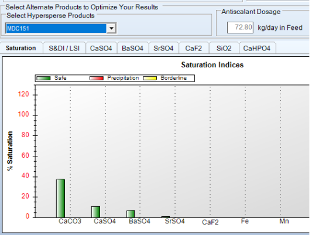
MEMBRANE SCALING POTENTIAL
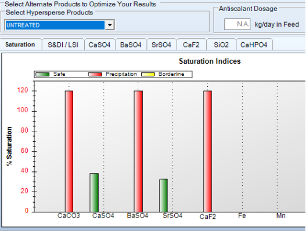
Scaling calculations must be carried out in order to determine whether a sparingly soluble salt can present potential scaling issues within the RO unit. As seen in the figure below, calcium carbonate, barium sulfate, and calcium fluoride are highly saturated in the feedwater and will cause large amounts of precipitation, which must be treated with an antiscalant chemical and sulfuric acid to decrease water pH.
REVERSE OSMOSIS UNIT
The software WinFlows by SUEZ Water Technologies & Solutions is used to validate and model the reverse osmosis unit. Designing a membrane system for an RO unit is complex as there are a variety of parameters that can be manipulated within the design to achieve optimal recovery. Through the governing equations of reverse osmosis, the salt rejection percentage, membrane recovery percentage, and pressure drop values were found to be consistent with values from the simulation.
| Parameter | Result |
| A – Pure water permeability of membrane (m3/m2*s*bar) | 1.05 X 10⁻⁶ |
| ΔP – Pressure difference (bar) | 13.65 |
| ΔΠ – Osmotic pressure difference (bar) | 2.00 |
| B – Salt permeability coefficient of membrane (m/s) | 3.27 X 10⁻⁸ |
| %R – Membrane salt rejection | 99.59% |
| R – Membrane Recovery % | 49.97% |
CAPACITIVE DEIONIZATION UNIT
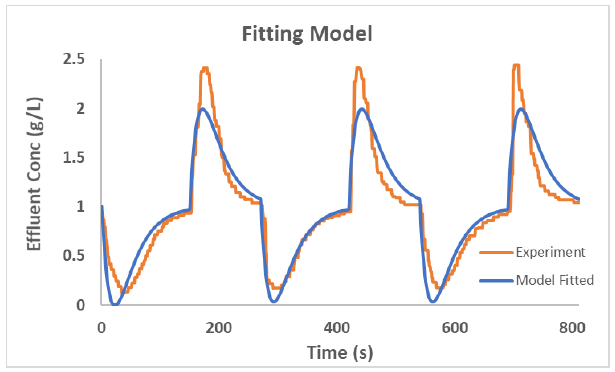
The CDI unit is modeled and sized based on a kinetic simulation model from an open-source CDI MATLAB code. From the kinetic model, the CDI unit consists of 2 stages that meet the required adsorption capacity. Both CDI stages operate under the same process conditions and the effluent of the first stage is the inlet of the second stage. This kinetic model only accounts for the removal of Na+ and Cl– ions, and hence, a separate ion selectivity prediction tool was used to determine the removal of the other ions. This approach uses a series of equations determined through experiments, that predict the removal of ions based on the adsorption of ions that are already known through the CDI kinetic model.
Economic and Feasibility Analysis
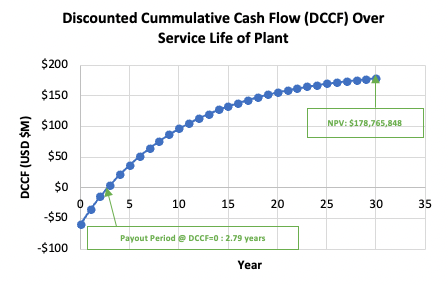
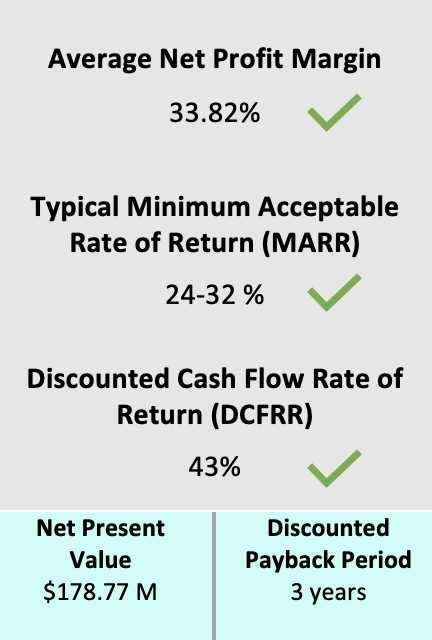
A summary of the profitability analysis for our plant is shown in the table above. The average net profit margin is the ratio of average after-tax profit to revenue for each year over the 30-year service life. Net present value is used to determine how much an investment is worth by finding the value of all future cash flows over the lifetime of investment and discounting this value to the present. If the NPV is positive, the investment is considered to be profitable. The minimum acceptable rate of return is the minimum profit that an investor expects to make from an investment. For a new process in a new market with a high level of risk, a typical MARR is 24-32%. The discounted cash flow rate of return is defined as the interest rate that results in an NPV of $0. If the DCFRR > MARR, the investment is profitable. Our profitability analysis shows that this plant is a profitable investment since the NPV > 0 and DCFRR > MARR. Finally, the discounted payback period is the number of years it takes until the accumulated discounted net cash flows offset the initial capital investment. For our plant, it will take around 3 years to break even from the initial investment while considering the time value of money.
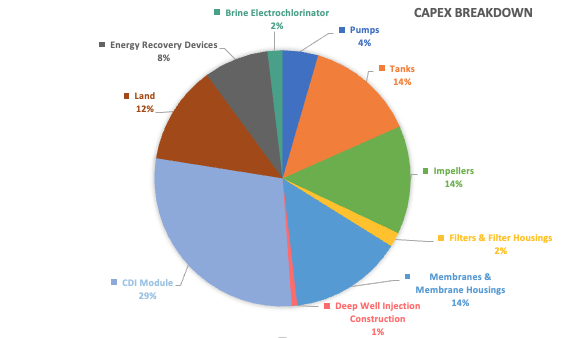
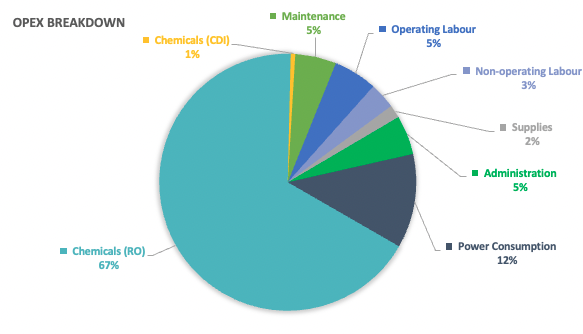
BREAKDOWN OF CAPEX AND OPEX
SENSITIVITY ANALYSIS
A sensitivity analysis is completed to evaluate the “What ifs?” relating to the profitability of the project. In determining the profitability of this process, many assumptions relating to sales revenues, total costs, and operating expenses were made. In a simple sensitivity analysis, one variable is changed at a time, and the impact of this change is determined by how much profitability deviates from the original conditions. Profitability can be examined by looking at the impact of these changes on variables such as (a) NPV, (b) DCFRR, and (c) discounted payout period.
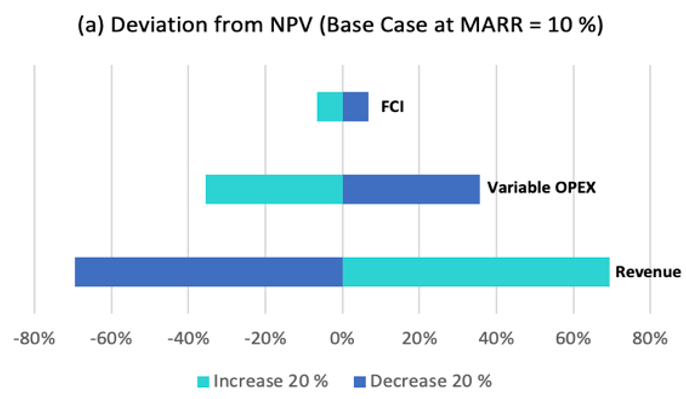
This plot shows that NPV is most sensitive to changes in revenue. A 20% change in revenue changes the NPV by around 70%.
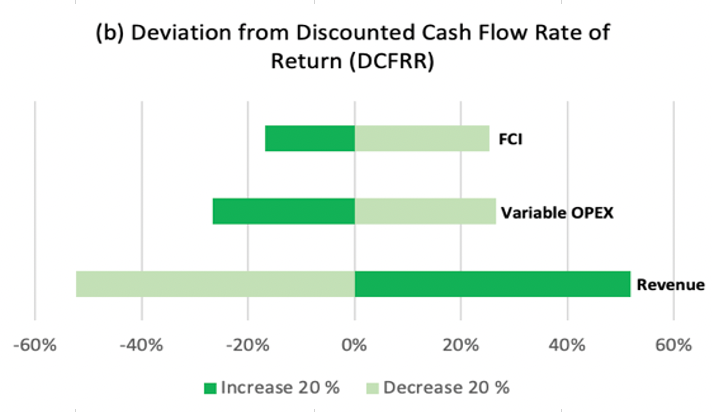
This plot shows that DCFRR is also most sensitive to changes in revenue. A 20% change in revenue changes the DCFRR by 52%.
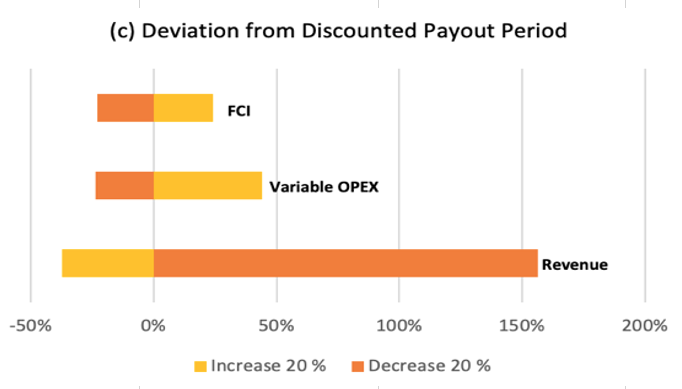
This plot shows that discounted payout period is most sensitive to changes in revenue. A 20% increase in revenue decreases the payout period by 37%. However, a 20% decrease in revenue increases the payout period by 157%.
Overall, the sensitivity analysis showed that the three profitability indicators chosen are all most sensitive to changes in revenue. To find yearly revenue, it was assumed that hydRO-CDI receives 50% of the consumer water price in California as a reasonable and conservative estimate. The exact amount of revenue that hydRO-CDI will generate is uncertain as water producers in California are evaluated on a per-case basis by the California Public Utilities Commission to determine the percentage of consumer water price that each producer is awarded.
Partners and Mentors
hydRO-CDI would like to thank the many people who helped us with this project over the Fall 2021 and Winter 2022 semesters.
First and foremost, our capstone supervisor, Dr. Edward (Ted) Roberts, who met with us weekly and guided us through the process with patience and great advice.
We would also like to thank Dr. Hector De la Hoz Siegler and Dr. Michael Foley for providing us with the ENCH 511/531 lectures and for their helpful feedback on our deliverables throughout the semesters.

Our Photo Gallery
References
- Y.-J. Kim, J. Hur, W. Bae and J.-H. Choi, “Desalination of brackish water containing oil compound by capacitive deionization process,” Desalination, vol. 253, pp. 119-123, 2010.
- J. R. Ziolkowska and R. Reyes, “Prospects for Desalination in the United States—Experiences From California, Florida, and Texas,” Competition for Water Resources: Experiences and Management Approaches in the US and Europe, pp. 296-316, 2017.
- Energy Recovery, “Pressure Exchanger,” Energy Recovery, [Online]. Available: https://energyrecovery.com/water/px-pressure-exchanger/. [Accessed 9 December 2021].
- C. S. J. S. J. P. a. M. A. A. Enrique García-Quismondo, “New Operational Modes to Increase Energy Efficiency in Capacitive,” Environmental Science and Technology, pp. 6053 -6060, 11 May 2016.
- Zekalabs, “redPrime DC-DC Converter 40kW, 450V,” Zekalabs, [Online]. Available: https://www.zekalabs.com/products/non-isolated-high-power-converters/dc-dc-converter-40kw-450v. [Accessed 9 December 2021].
- F. J. Álvarez-González, J. A. Martín-Ramos, J. Díaz, J. A. Martínez and A. M. Pernía, “Energy-Recovery Optimization of an Eperimental CDI Desalination System,” Transactions on Industrial Electronics, vol. 63, pp. 1586-1597, 2016.
- T. Marlin, “Class notes for Che 4N04 Engineering Economics section,” LearnChe, 2013. [Online]. Available: https://learnche.org/wiki_4N4/images/c/c2/Economics-4N04-2014-Part-1.pdf. [Accessed: 03-Apr-2022].
- “Net present value (NPV),” Corporate Finance Institute, 24-Jan-2022. [Online]. Available: https://corporatefinanceinstitute.com/resources/knowledge/valuation/net-present-value-npv/. [Accessed: 03-Apr-2022].
- Ultranode, “Brine Electrochlorination,” Ultranode, [Online]. Available: https://ultranode.ca/ProductList/10032/Electrochlorination-Packages–Plants. [Accessed 10 March 2022].
