Design of a 17MMSCFD Natural Gas Plant
A comparison between Joule Thomson and Mechanical Refrigeration
Join Our Presentation
We are available from 9:30AM – 1:00PM (MST), April 13th!
About Our Project
- Natural Gas is an important energy source in Canada and among the cleanest energy options. One third of Canadian energy needs are met by natural gas which is used as fuel for heating and electricity. Additionally, natural gas provides fuel for transportation and is used extensively in agriculture for running equipment, irrigation systems and for greenhouse heating.


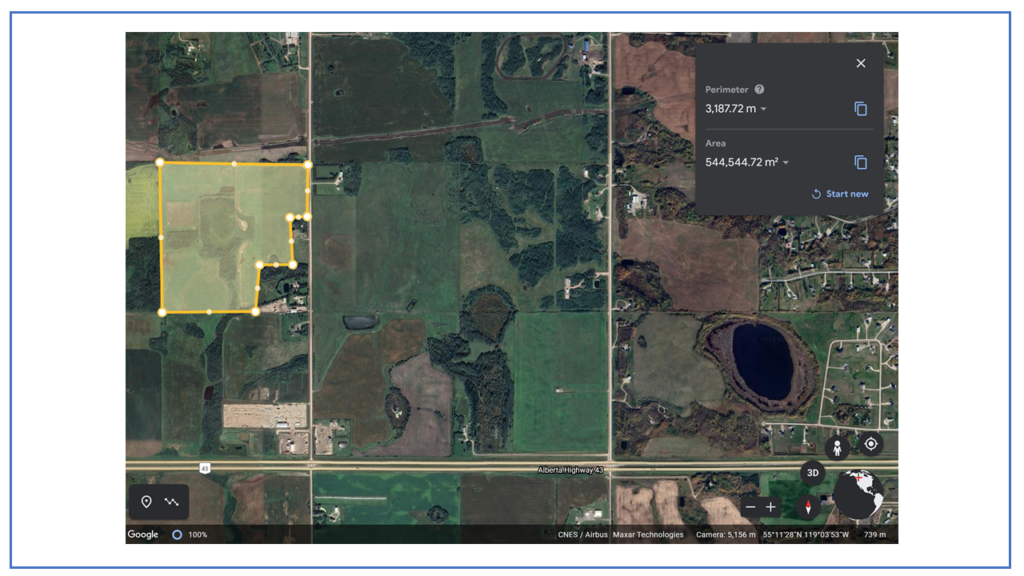
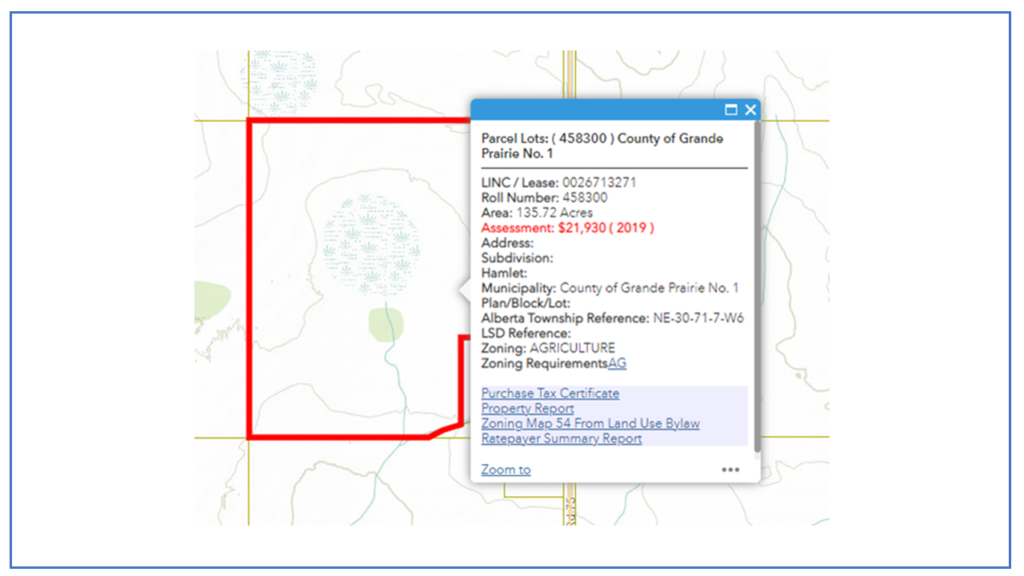
- ACME Engineering Consulting, “ACME”, has been contracted by the “Client”, Road Runner Oil & Gas, to design and construct a Natural Gas Processing plant located in Grande Prairie (AB) to handle a 17MMSCFD sweet and rich natural gas feed. Two product streams for commercial sale will be produced: natural gas meeting TC Energy Pipeline Specifications and a C2+ natural gas liquid (NGL). Any recovered water will be disposed of at an on-site injection well.
- The design strategy focuses on the comparison of two natural gas facilities that utilize different NGL recovery technologies, Joule-Thomson (JT) and Straight Propane Refrigeration. The project aims to determine which plant configuration will provide the Client with a better rate of return on their investment.
Our Team Members

BSc. Chemical Engineering
bassem.chaaban@ucalgary.ca

BSc. Chemical Engineering,
Energy & Environment
nancy.chen2@ucalgary.ca

BSc. Chemical Engineering,
Energy & Environment
kelsey.kinzner2@ucalgary.ca

BSc. Chemical Engineering
ryan.thon@ucalgary.ca

BSc. Chemical Engineering
Biomedical Engineering
thinh.tong@ucalgary.ca
“ACME is founded on Collaboration, Integrity, and Professionalism”
Details About Our Design
MARKET DRIVERS
Commodity prices are a function of the market supply and demand. The North American natural gas market is currently oversupplied, which has resulted in depressed commodity prices. With the limited growth potential in the gas market, the focus of natural gas processing has shifted towards the recovery of natural gas liquids.
Below are adapted graphs from McDaniel and Associates (2021) reporting on pricing of Natural Gas and NGL. Link: ww.mcdan.com/
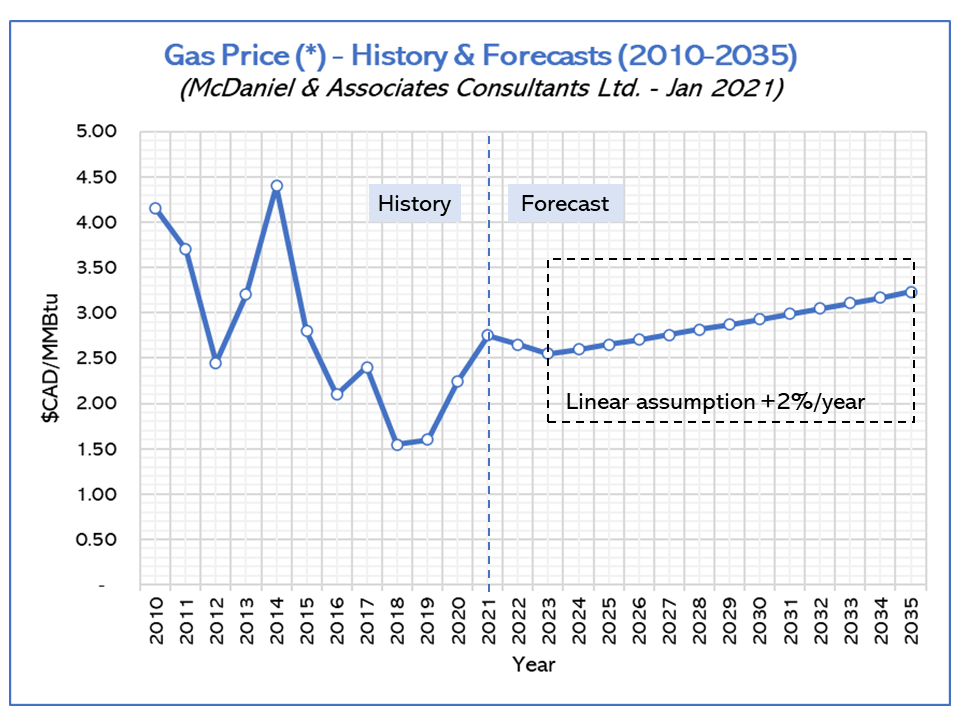
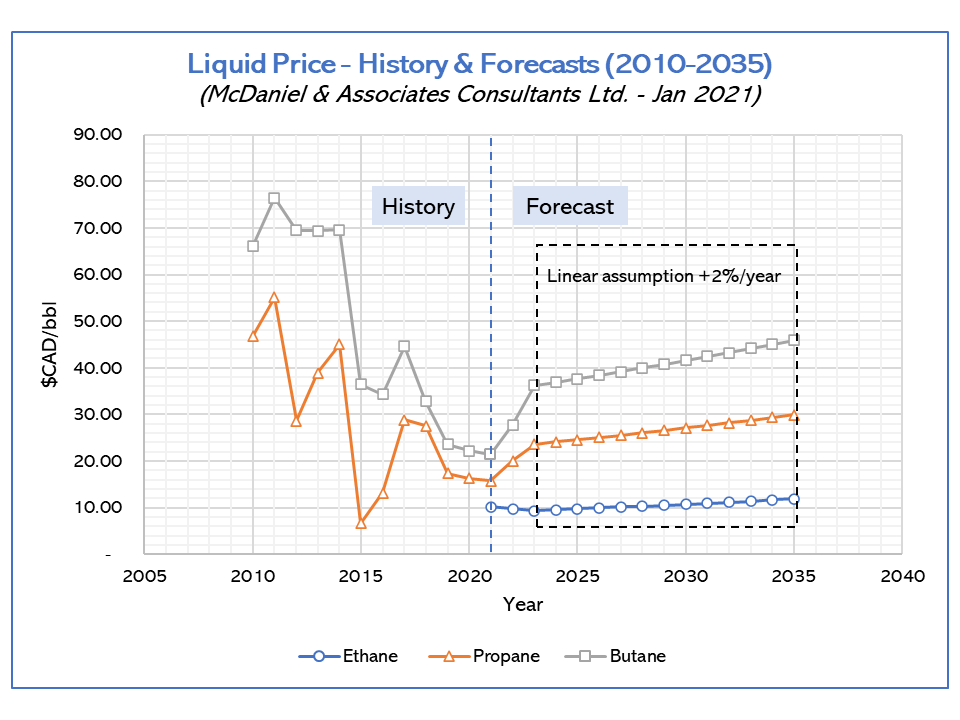
While a high degree of uncertainty exists in commodity forecasting, it is impossible to deny the rapidly expanding NGL market. The proposed 17MMSCFD gas processing facility will look to capitalize on the developing NGL market by placing an emphasis on optimizing the recovery of NGLs from the feed stream.
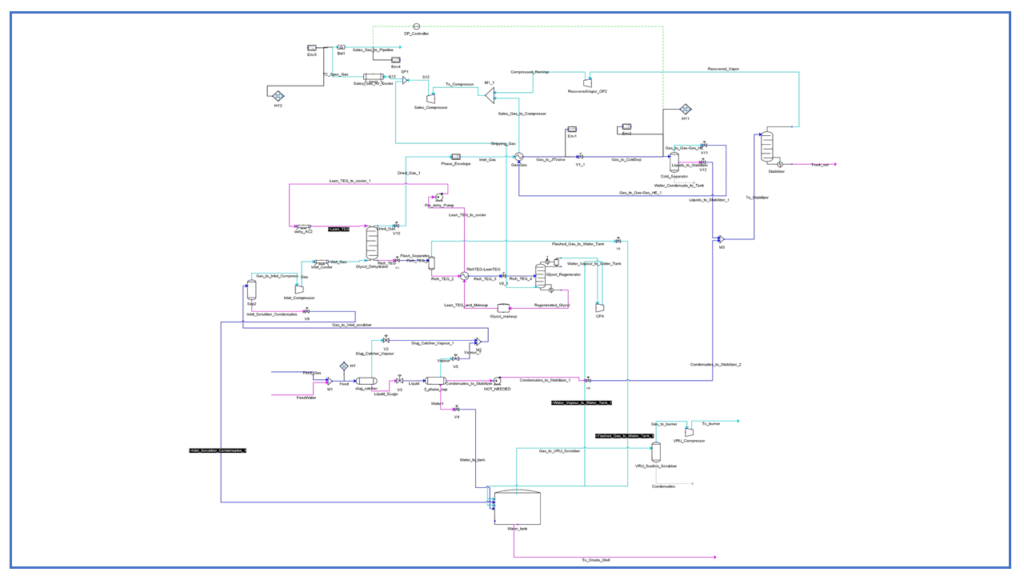
PROCESS DESCRIPTION
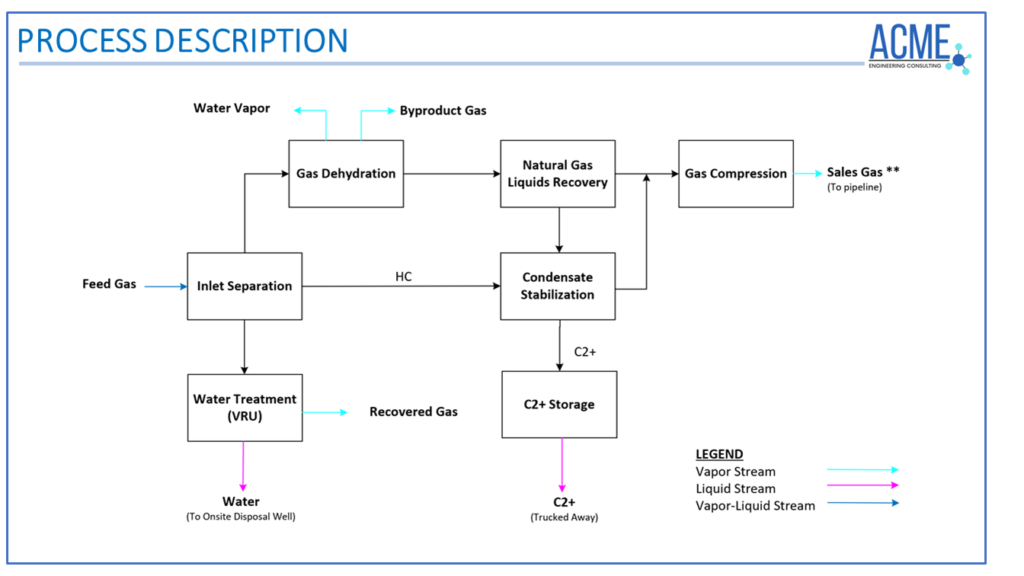
Natural gas processing involves the separation and removal of impurities and liquids from the raw natural gas feed, with a goal of producing pipeline quality dry natural gas. A gas processing plant’s configuration depends on the composition of the feed gas, the level of processing required to meet product quality specifications, and ultimately the revenues that can be generated from the process products.
The proposed plant design includes seven major process units:
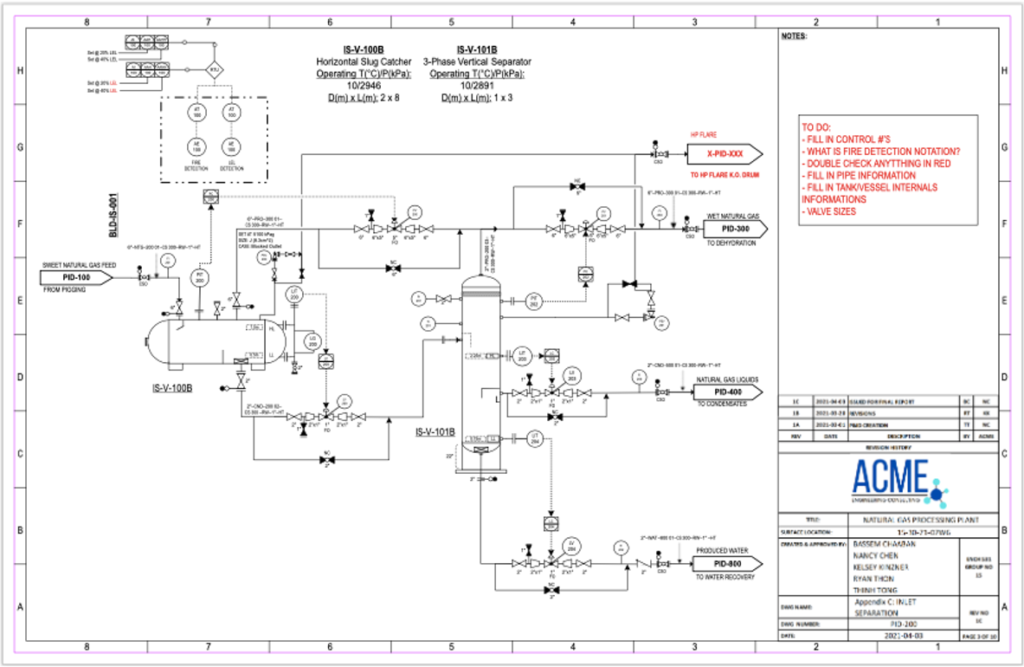
| 1) Inlet Separation | Remove any liquid from the feed before further processing |
| 2) Inlet Compression | Compress the feed to improve downstream processing efficiency and enhance NGL recovery |
| 3) Dehydration | Remove any water from the gas processing stream to achieve TC Energy Pipeline Specification (4lbs of water/MMSCF) |
| 4) NGL Recovery | Reduce the inlet gas temperature forcing the heavier hydrocarbon components (C2-C4) to condense into liquid; this temperature reduction can be achieved using either expansion across a Joule-Thomson valve, or straight propane refrigeration |
| 5) Condensate Stabilizer | Help the NGLs obtain the vapor pressure required for storage by removing any entrained light hydrocarbons through flashing or heating |
| 6) Sales Gas Compression | Increase the pressure of the product gas stream to 6895kPa in order to achieve the sales line pressure requirement |
| 7) Water Treatment | Captures hydrocarbon vapor from the produced water prior to disposal at an onsite injection well |
The two plants will differ at the NGL recovery unit in how and to what extent the feed is separated into our two sales products: NGLs and sales gas, meeting TC energy pipeline specifications. When dealing with low gas flow rates (5 – 20 MMSCFD), there are two standard ways that a plant can be configured to ensure appropriate NGL recovery: Joule-Thomson or Mechanical Refrigeration.
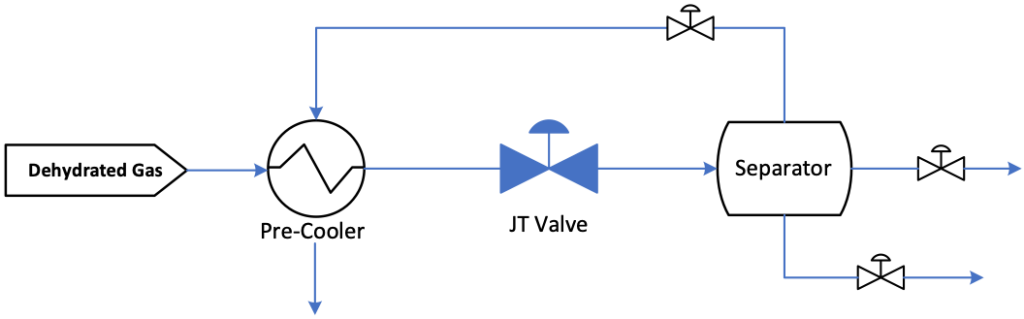
Joule-Thomson
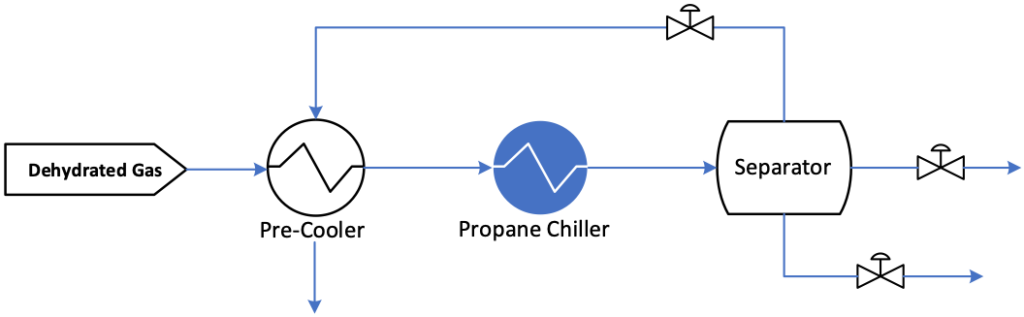
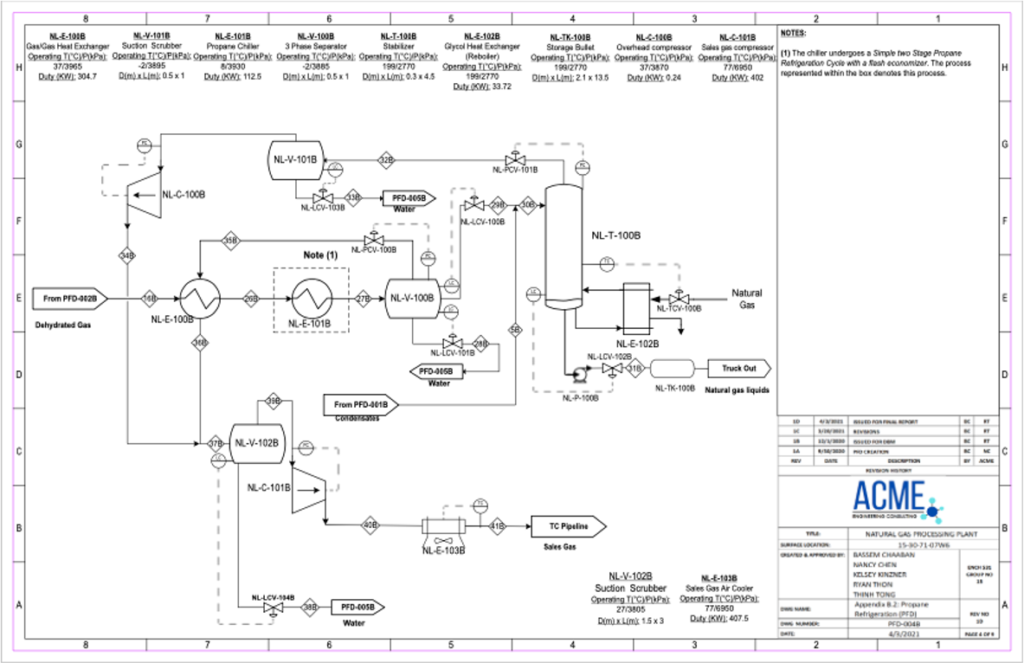
Propane Refrigeration
Isenthalpic Expansion Process: natural gas is expanded across a JT valve, reducing fluid pressure and fluid temperature, causing the heavier hydrocarbon to condense into liquid
Heat Exchange Process: natural gas liquification is achieved through cross exchange with a propane refrigerant in the gas chiller, causing the heavier hydrocarbon to condense into liquid
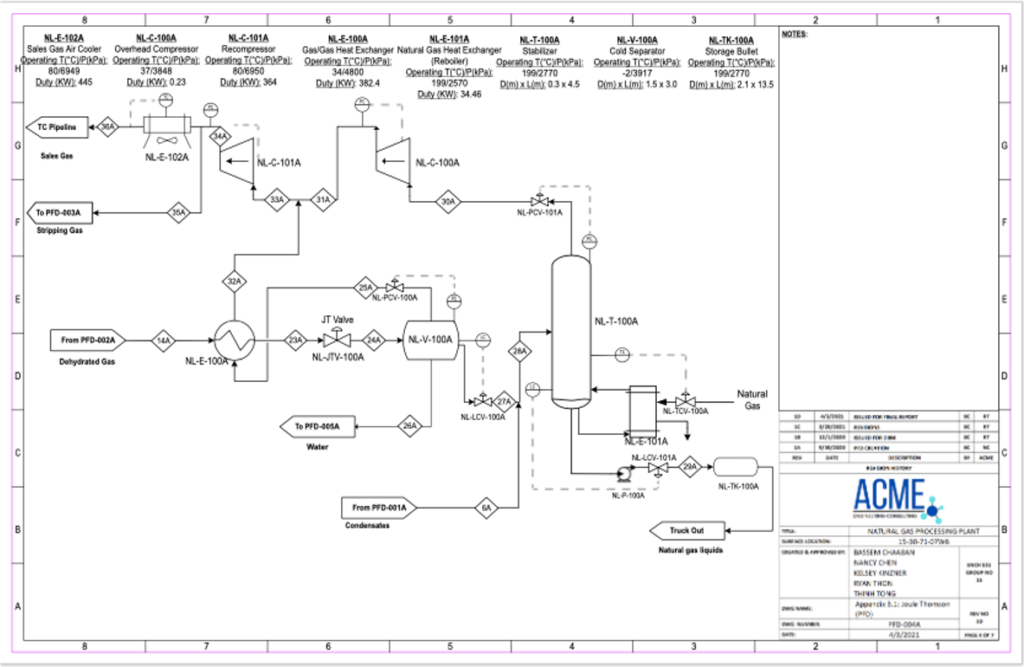
Supplementary engineering documents include process flow diagrams, piping and instrumentation diagrams and plot plan.
Please click on the appropriate link for a more in depth look at our proposed design.
PROCESS OPTIMIZATION

PRESSURE CASE STUDY:
Raw natural gas enters the facility from the field at 2966kPa but exits at 6895kPa (sales line pressure requirement). Understanding that the system pressure varies between these two pressures, a case study was required to establish the optimal facility operating pressure. The plant operating pressure was systematically varied between the two pressure boundaries and the utility requirements of the process equipment were analyzed. The optimum design condition was determined to be the case when utility requirements were minimized, and the product revenue were maximized. A macroscopic analysis was performed evaluating plant performance across the entire pressure range (2966kPa to 6895kPa). This method was applied to reduce the chance of settling upon a local, rather than absolute, minimum for power requirements.
Joule-Thomson
Propane Refrigeration
The original JT plant design already includes an inlet compression unit, as this design ensures that a pressure drop can occur across the JT valve inducing gas liquification. The results indicate that JT performance and utility efficiency are improved when reducing the operating pressure to 4800kPa, generating $60 thousand dollars in value-add every year.
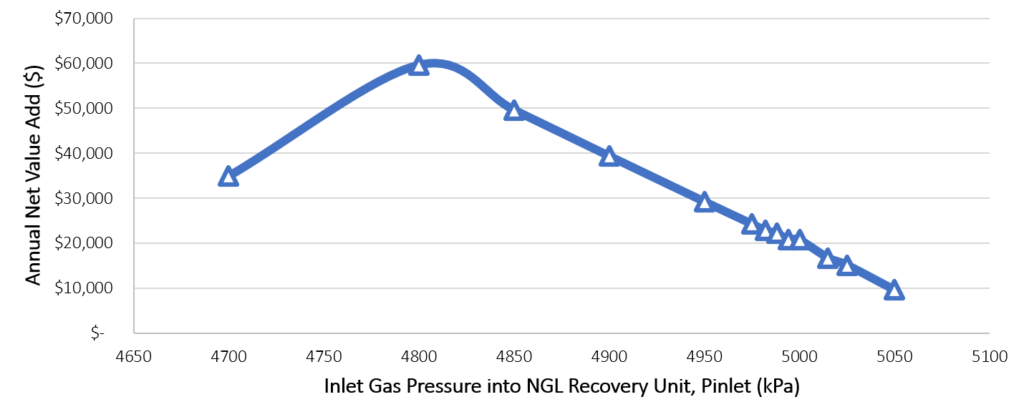
| Condition | Base Case | Ideal Case |
| Inlet Pressure | 5,100 kPa | 4,800 kPa |
| Power | 1.47 MW | 1.36 MW |
| Net Value Add* | – | $60,000 |
The inlet feed pressure is generally maintained across the entire facility, with the only variations being pressure drops across the various process equipment. The aim was to evaluate whether it was in the economic interest of the facility to compress the gas upstream of the dehydration unit (inlet compression unit). The optimal pressure was determined to be 4250kPa adding $49 thousand dollars in value annually.

| Condition | Base Case | Ideal Case |
| Inlet Pressure | 2,756 kPa | 4,250 kPa |
| Power | 1.57 MW | 1.44 MW |
| Net Value Add* | – | $49,000 |
PROCESS VALIDATION
The process is validated by comparing simulation/design results to experimental/literature results obtained from research articles or GPSA Engineering Data Book (Midstream Suppliers, 14th ed., Tulsa, OK, USA)
THERMODYNAMIC PACKAGE SELECTION
Based on the stream properties (non-polar with insignificant amount of water and no electrolytes) and recommendations by Symmetry, the top 4 options for Thermodynamic Package Selection are chosen:
- Advanced Peng Robinson (APR)
- APR for Natural Gas 1 (APR-NTG1)
- APR for Natural Gas 2 (APR-NTG2)
- NGL-PR
Two properties were chosen for the purpose of comparison. A cumulative error analysis was performed to obtain difference percentages between experimental and simulated values, which can be visualized in Figure 8 and Figure 9:
Hydrocarbon dew point: dew point temperature of a synthetic natural gas with various compositions measured at different dew point pressures Experimental data is obtained from:
S. Avila et al., “Thermodynamic properties of synthetic natural gases,” Energy and Fuels, vol. 17, no. 2, pp. 338–343, 2003
Liquid density: liquid density of a C3-iC4 mixture at various combinations of temperatures and pressures
Experimental data is obtained from:
L. Kahre, “Liquid Density of Light Hydrocarbon Mixtures,” J. Chem. Eng. Data, vol. 18, no. 3, pp. 267–270, 1973
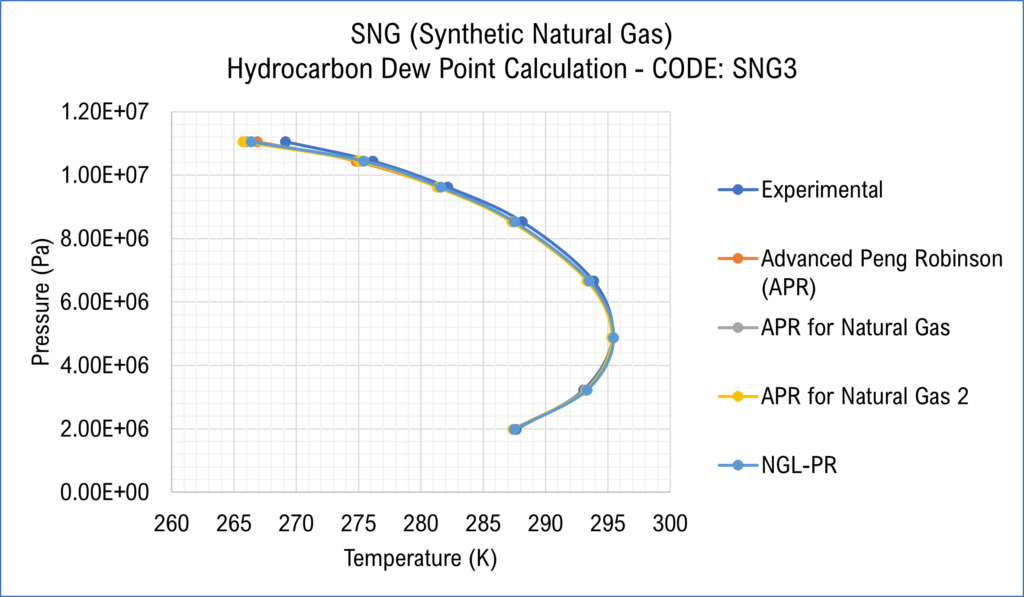
from various thermodynamic packages based on hydrocarbon dew point of SNG
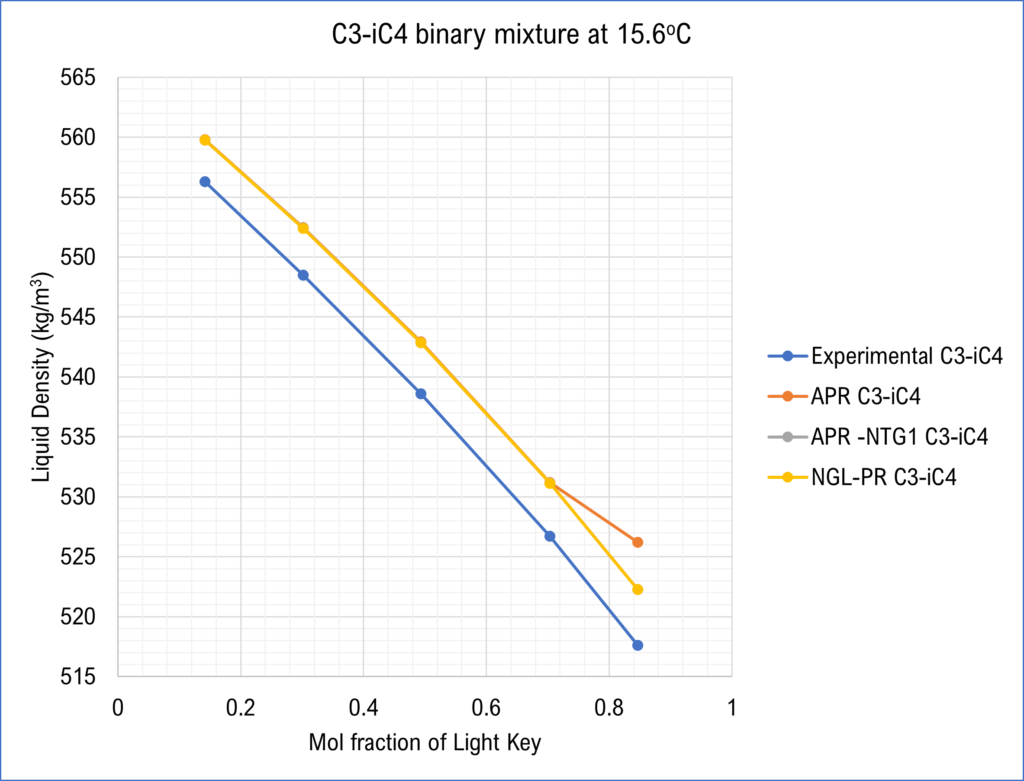
It can be seen that all packages show relatively similar performances. However, APR for Natural Gas 1 was chosen as the final choice based on its good performance in both Dew Point Temperature and Liquid Density (by minimizing the errors between simulation and experimental results the most).
EQUIPMENT DESIGN AND SIZING
Methods to size various pieces of equipment (pressure vessels, distillation columns, valves, etc.) in both plants are obtained from GPSA Engineering Data Book and other resources. Below is an example of the designing process of a Condensate Stabilizer in our JT Plant:
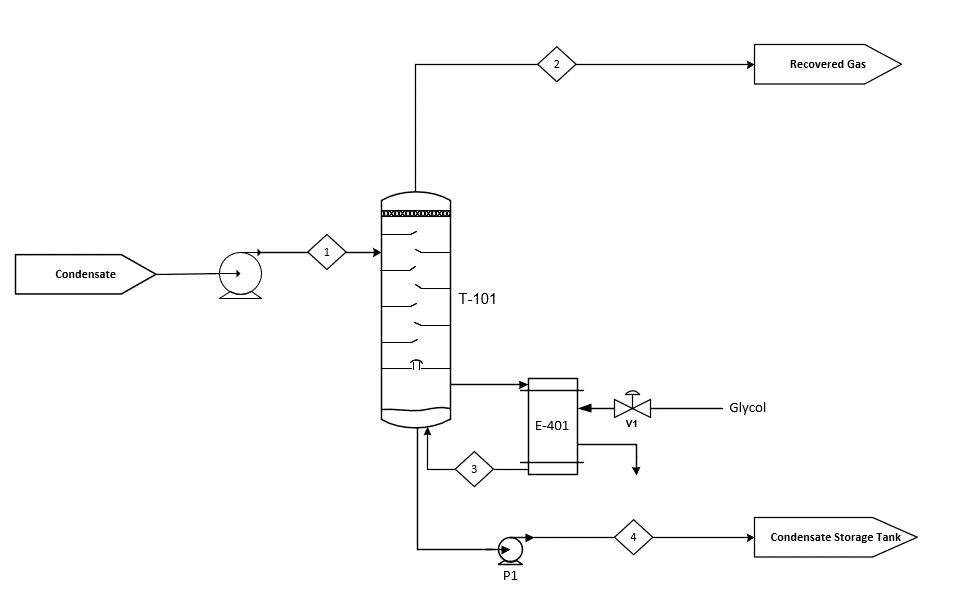
Tower Sizing from Simulation Data:
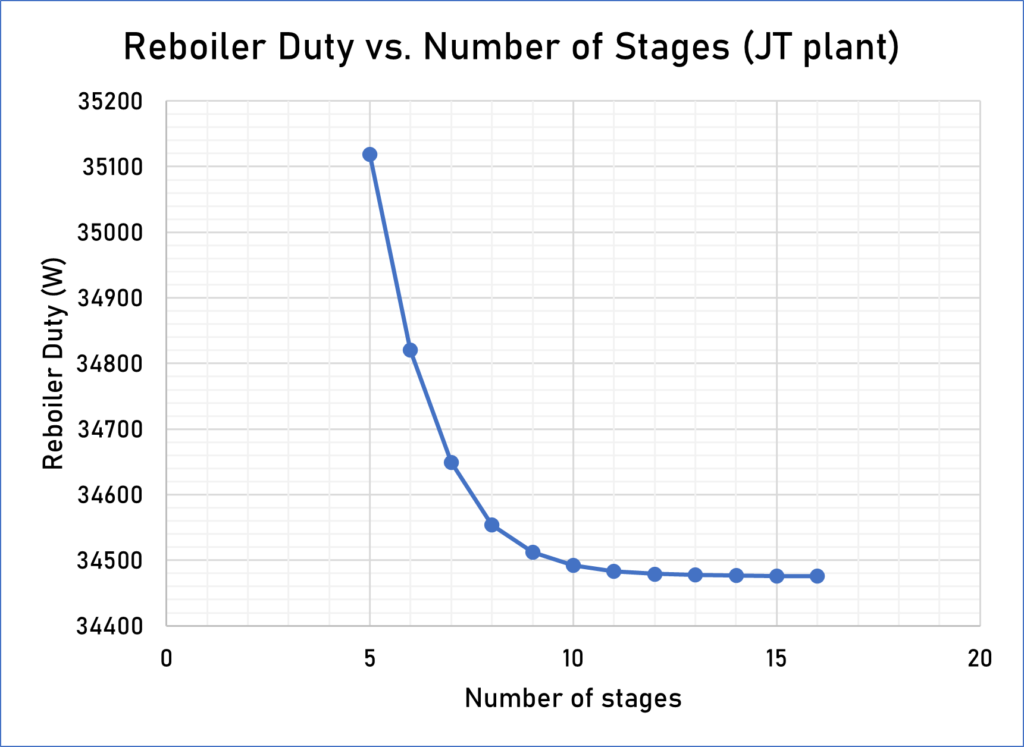
- To determine number of stages, reboiler duty (obtained from simulation) was plotted against number of stages
- 10 was determined as the number of stages as there was not a significantly reducing effect on reboiler duty from 10- to 11-stages
- Followed O’Connell method (which efficiency is a function of relative volatilities, feed viscosity, and choice of tower’s material), an efficiency was determined as 57%
- The actual number of stages was then determined as: 10/57% = 18 stages
- Pressure ranges within the tower ranges from 2750 – 2770kPa (the pressure of feed into the reboiler is 2750kPa)
The values were then compared with data available from GPSA Engineering Data Book:
| Values | Operating Pressure (kPa) | Number of Actual Trays | Tray efficiencies (%) |
| GPSA Engineering Data Book | 690 – 2750 (gauge) | 16-24 | 50-75 |
| ACME’s design | 2750 – 2770 (absolute) | 18 | 57 |
All design values are within common industrial ranges reported in GPSA Engineering Data Book!
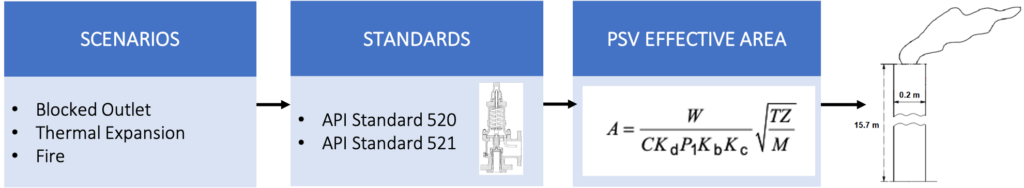
SAFETY ANALYSIS
Process safety is a critical aspect of plant design that aims to safeguard the facility operators, the environment and public through the prevention and management of unplanned releases of material and/or energy. The performed safety analysis includes the following elements:


- Installing properly sized PSVs ensures the designed plant is protected from overpressure scenarios including blocked outlet and thermal expansion. Sizing for the effective discharge area of each PSV was done using API Standard 520, factoring in design pressure, relief pressure, backpressure, and operating conditions
- In addition, a high-pressure flare system was designed using API Standard 521. The flare design takes into consideration factors like PSV discharge flow, wind speed and maximum allowable radiation
A formal What-If analysis was conducted on the sales gas compressor and inlet scrubber. Consequences and safeguards were explored for each identified risk. Each hazard was ranked on a risk matrix for probability (P) and severity (S).
Please click on the appropriate link to view the What-If Analysis and Risk Matrix in full.


SOCIAL, ENVIRONMENTAL, AND SUSTAINABILITY CONSIDERATIONS
Public consultation should be performed with individuals and organizations potentially affected by this project. To meet the social license to operate, an inherently safer design has been developed to eliminate hazards in combination with a layers of protection model. Therefore, the developed design should effectively control and manage potential hazards safeguarding both the public and environment. In addition, the developed design follows all environmental laws at the federal, provincial, and municipal levels.
| Level | Associated Environmental Laws |
| Federal | Canadian Environmental Assessment Act (CEAA) |
| Provincial | Alberta Energy Regulator (Environmental Protection & Enhancement Act – EPEA & Water Act) |
| Municipal | Development Permits |
Effective management of by-product streams in an important environmental consideration. The following list indicates the main by-product streams and the applied management strategy:
- Water is the largest by-product and will be disposed of at onsite disposal well; it will be treated prior to disposal in order to recover entrained hydrocarbons and mitigate the environmental impact
- Flaring will be used for the by-product gases resulting from the operation of the plant. Due to the small amount of low-pressure gas produced, flaring is the only economically viable solution. Alternative management strategies were explored extensively without success. It is important to note the quantity of flared is well below environmental standards
ECONOMIC ANALYSIS
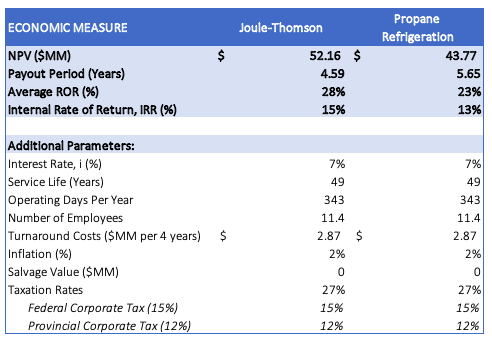
The economic analysis consisted of a Class 5 cost estimation to compare and assess the profitability of both natural gas plants, assuming a project lifespan of 49 years and a salvage values of $0. The more viable project was determined to be the design that minimized capital and operating expenditures, maximized net profits and achieved the shortest payout period.


The developed model is governed by the following three economic drivers:
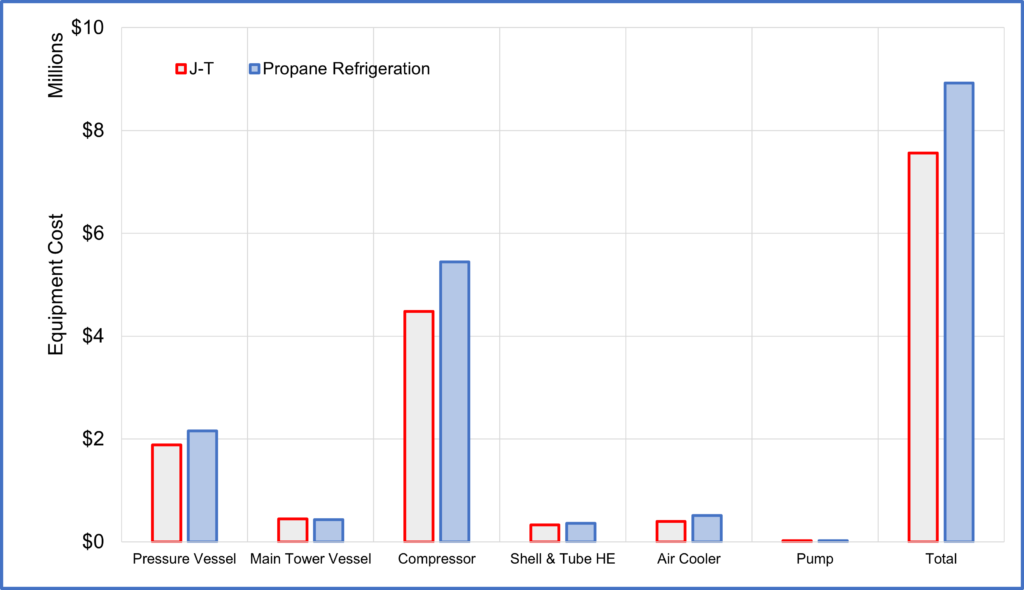
| CAPEX | The equipment costs were calculated based on the Ulrich method and was performed using the Simulation Software (Symmetry). The estimate takes into consideration: equipment costs, material factors, base module factors and an escalation index. As show in Figure 9, the refrigeration plant is more expensive than JT, requiring an addition $1.4MM in capital expenditures. |
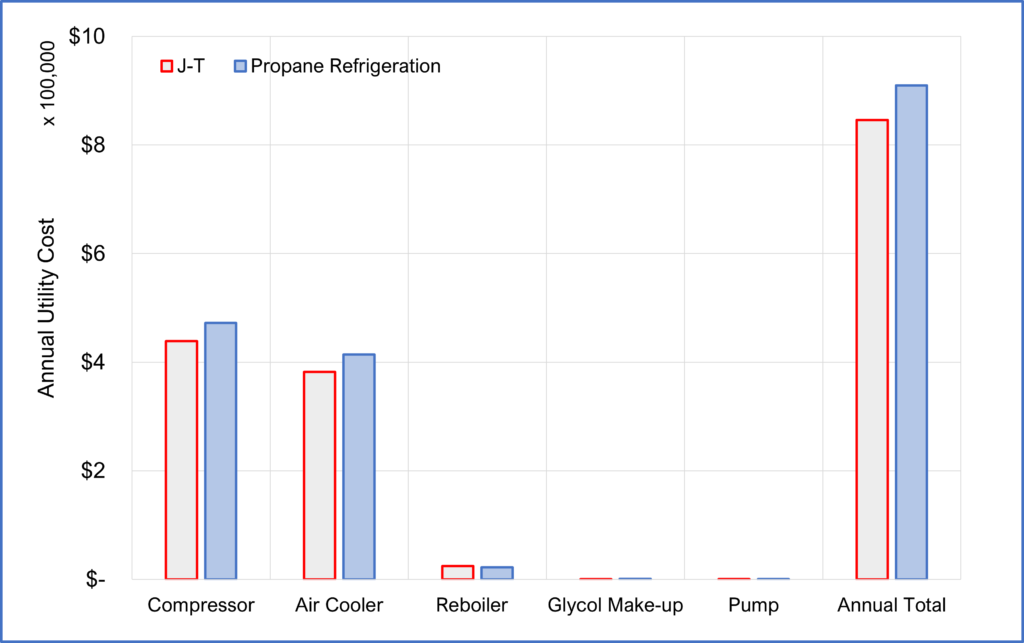
| OPEX | The utility requirements were calculated from the simulation heat and material balance, with tri-ethylene glycol (TEG), natural gas, and electricity being the main utility components. Overall refrigeration utility requirement was an addition $64K/year, this breakdown is shown in Figure 10 below. Addition OPEX charges include labor, freight, fractionation costs and overhead expenditures. |
| Revenue | Both plants are designed for an inlet feed of 17 MMSCFD and assume operating reliability of 94%. The estimated revenues are a function of the product volumes and the AECO spot price forecast by McDaniel’s and Associates. The JT facility generates an additional $1.13MM in revenue throughout the project life as a result of producing higher NGL volumes. |
The profitability was compared to assess which plant has maximized net profits. The results of this analysis indicate the total after-tax cash flow for the JT plant is ~$18M higher than the refrigeration plant for the lifespan of the project. Therefore, the JT plant is the more profitable project.
Additional measures were calculated to evaluate other economic indicators that are key in assessing project performance and viability. These indicators include, net present value (NPV), payout period, average rate of return (ROR) and internal rate of return (IRR). With the payout period, the JT plant pays out approximately 1 year before the refrigeration plant.
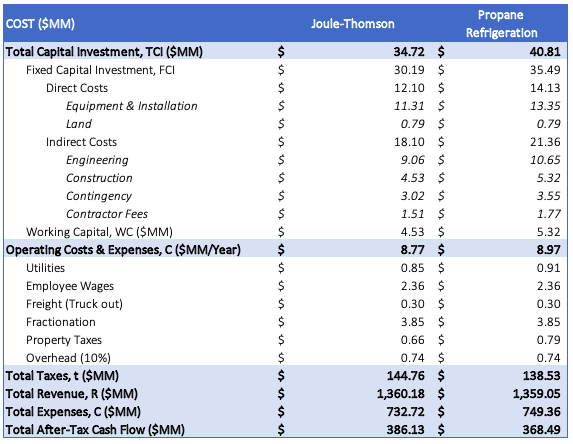
– JT vs. Propane Refrigeration
CONCLUSION
The economic analysis consisted of a Class 5 cost estimation to compare and assess the profitability of both natural gas plants, assuming a project lifespan of 49 years and a salvage values of $0. The more viable project was determined to be the design that minimized capital and operating expenditures, maximized net profits and achieved the shortest payout period.
In conclusion, the JT plant has more favorable project performance indicators than the refrigeration plant. From these economic analyses, it was decided for our client, Roadrunner Oil & Gas, that the JT plant is the more economic project to move forward with.
Thank you!
- We would like to thank our industry supervisor and client, Mr. Bent Nielsen, for his time, expertise and guidance in supporting the completion of this project.
- We would also like to thank the course coordinator, Dr. Hector Siegler, & our academic supervisor, Dr. Michael Foley, in organizing the chemical engineering capstone courses and providing us with feedback on our project
ACME Engineering Consulting – All Rights Reserved
Our Gallery
Please click on the images for links to files with better resolution!

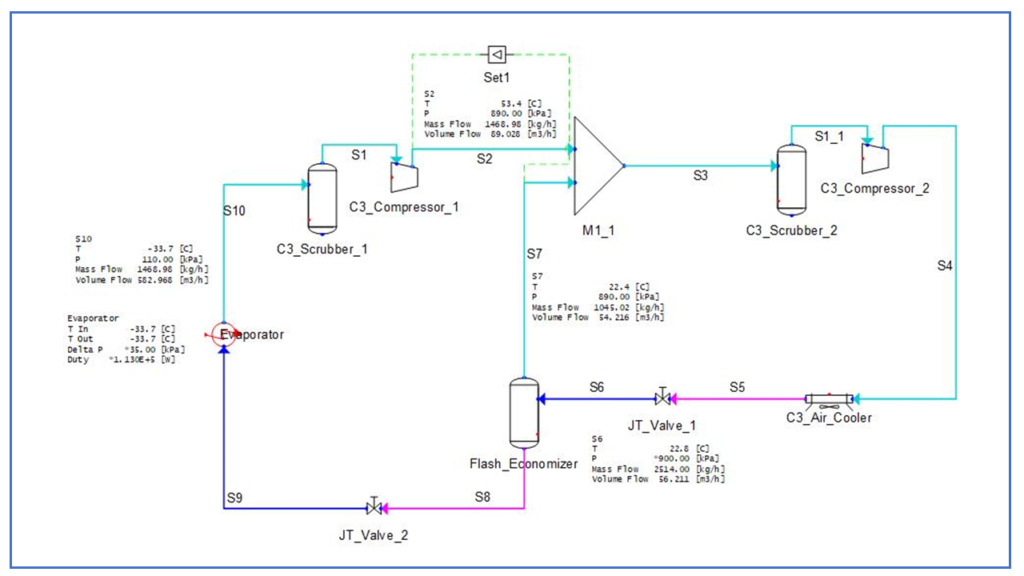
(Propane Refrigeration only)