Project Category: Civil
Come visit us in-person at the capstone fair!
About our project
Since 2017, the City of Calgary has been investigating opportunities to reduce greenhouse gas emissions. This includes converting the current fleet of the buses into electric alternatives. This project involves the development of a the block schedule for pilot program which utilizes 14 electric buses. This has been done with the intention of using as many of the buses as possible while maximizing ridership on the utilized routes and still staying within the battery capacity of the buses.
What is Block Design?
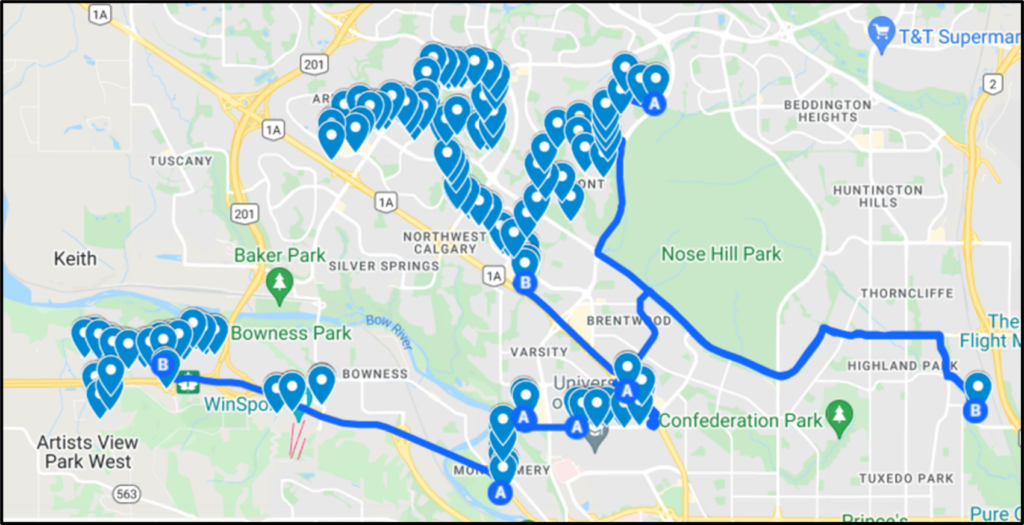
Blocking is, effectively, how individual buses fit into the predesigned route schedules. To keep transit service on time multiple buses are required for each route. A block can be viewed as the “life-cycle” of a bus, from when it leaves the garage at the start of its run to when it returns to the garage at the end of its run. Each block can consist of multiple routes, with the bus travelling between routes as required. For block design to be effective there are multiple factors that need to be considered. One factor is minimal travel time between routes and the other is minimal switching between routes.
Project Constraints
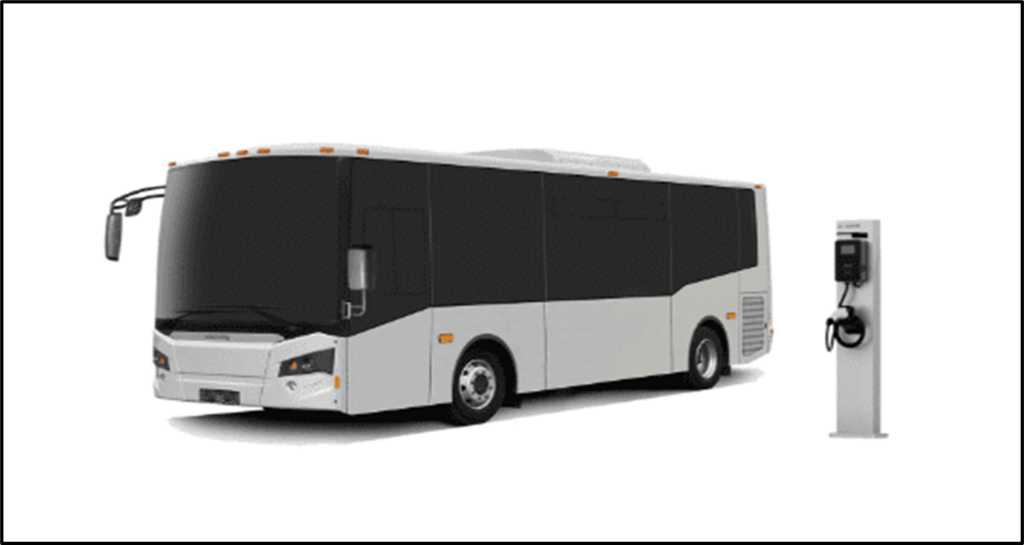
● The pilot program will be using fourteen 30 ft model Vicinity eBus Shuttle
● Each battery contains 252 kWh battery capacity
● Buses will be charged and stored at Spring Gardens – 928 32 Ave NE
● Buses can not be charged remotely and must be returned to storage after each trip
Meet our team members


Details about our design
DESIGN CRITERIA
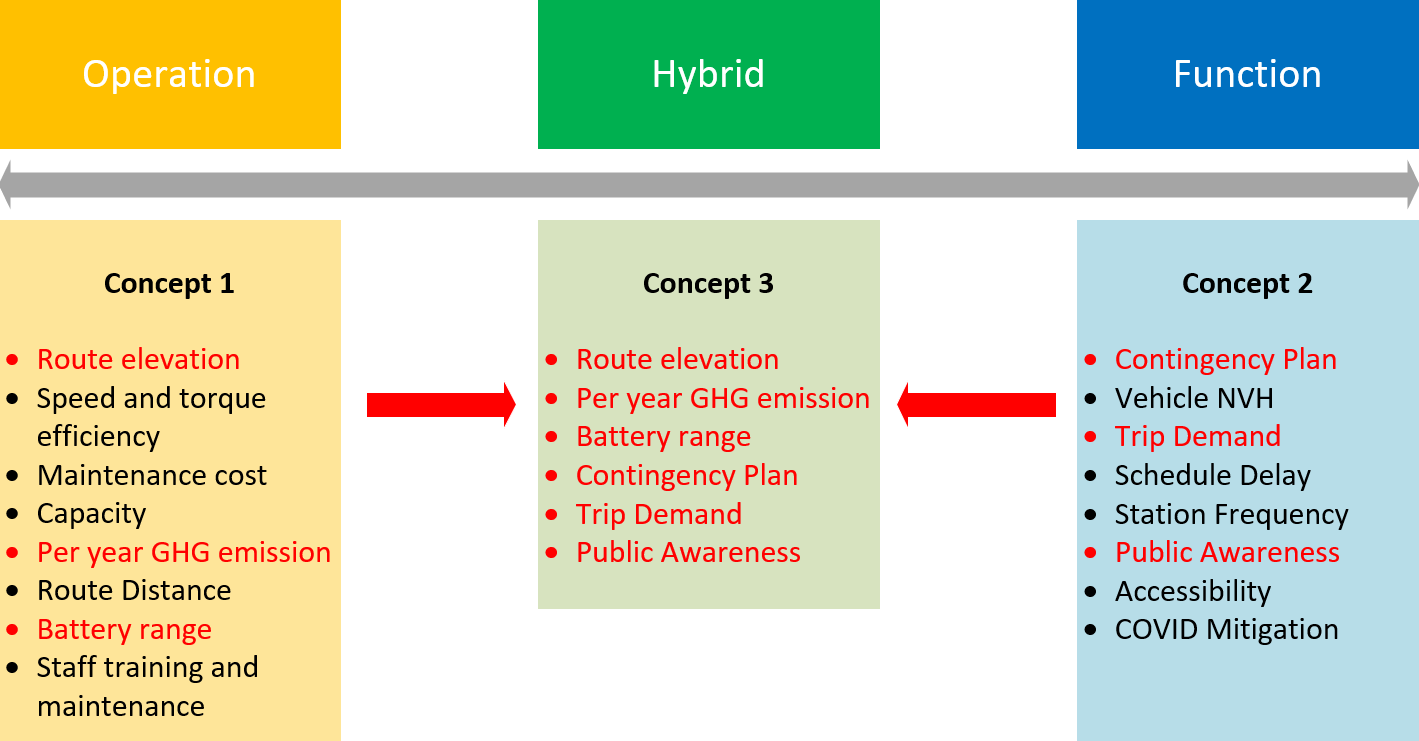
Our team evaluated a variety of criteria to use for block design from the standpoint of both operation-based and function-based. We eventually chose to go with criteria that were a hybrid of both operation and function to create our block design.
DRIVE CYCLE
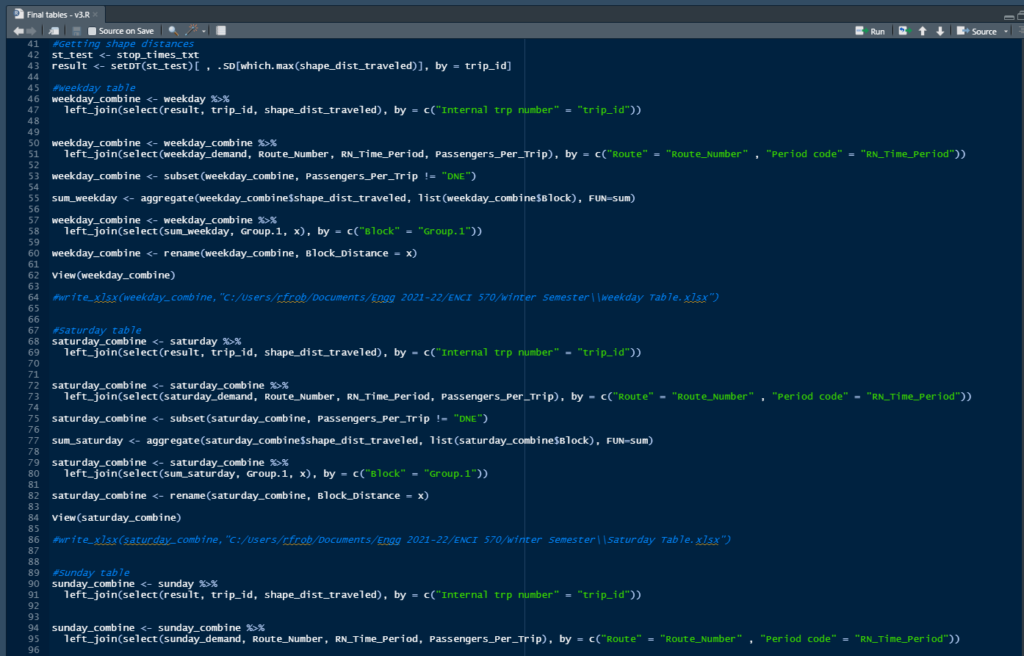
The drive cycle is a model that predicts the vehicle’s velocity throughout its journey. The model allows for a more detailed analysis of the battery range where variations in speed and acceleration can be factored into our calculation. Using R Studio and Excel, our model was created using kinematic equations to calculate the points of acceleration and deceleration between each stop.

Based on our drive cycle model, we were able to calculate the extent each of the factors in the following image had on the energy consumption from the battery. Red arrows indicate factors that draw from the battery while green arrows indicate factors that add to battery range.

ITERATIONS
To select our final design, multiple iterations were performed which served to narrow refine our block selection to a desirable final product. These iterations used a variety constraints and factors both from the bus specifications and from qualitative design criteria.
Iteration 1 began with the desire to optimize ridership on the blocks. The blocks were filtered to display the maximum passengers per trip, while still being below the 30 person capacity of the shuttle buses used in this pilot program. From this list, weekday blocks were split into morning and evening groups and 6 blocks were selected from each. 6 Saturday and 6 Sunday blocks were also selected using this method. This block set was then evaluated through drive cycle calculations to determine if the blocks were feasible within the battery capacity of the bus. It was determined that both the Saturday and Sunday blocks used too much energy.
Iteration 2 made two significant changes. A longer weekday block was split to have two separate buses work the route in the morning and evening components of it, removing a shorter block that did not fully utilize the battery. The weekend blocks were also split approximately in half to have 2 separate buses work each of them during the course of the day so they would fit inside the range of the battery. This block set was determined to be acceptable for summer months. However, when heating in winter months was taken into consideration the blocks were no longer within the battery range and so had to be further modified to produce the final block design for winter months.
FINAL DESIGN
SUMMER BLOCKS
The final block selection for the summer months included 6 blocks for weekday mornings, 6 blocks for weekday evenings, 6 blocks for Saturdays, and 6 blocks for Sundays. On both Saturday and Sunday the blocks were split approximately in half to have 2 different buses run on them throughout the day.
| Weekday | |||||
| Block ID | Start Time | End Time | Distance (km) | Total Energy (kWh) | Average Number of Passengers |
| 115-191 | 7.47 | 15:44 | 201 | 137 | 14 |
| 115 -192 | 8:52 | 16:14 | 206 | 137 | 13 |
| 468 -191 | 4:39 | 11:48 | 170 | 120 | 14 |
| 468 -192 | 5:19 | 12:18 | 185 | 125 | 13 |
| 468 -193 | 4:59 | 9:24 | 107 | 106 | 19 |
| 27-191 | 6:40 | 14:25 | 116 | 149 | 18 |
| 113 – 91 | 17:38 | 22:21 | 102 | 121 | 8 |
| 40 – 92 | 17:37 | 23:13 | 122 | 105 | 8 |
| 97 – 91 | 17:51 | 0:22 | 145 | 113 | 8 |
| 76 – 91 | 17:45 | 0:41 | 173 | 114 | 6 |
| 27 – 91 | 13:30 | 15:26 | 33 | 1942 | 21 |
| 27-191 | 14:25 | 22:09 | 140 | 116 | 18 |
| Saturday | |||||
| Block ID | Start Time | End Time | Distance (km) | Total Energy (kWh) | Average Number of Passengers |
| 129 – 9-A | 6:06 | 15:18 | 209 | 122 | 12 |
| 129 – 91-B | 15:18 | 0:31 | 178 | 125 | |
| 129 – 92-A | 6:45 | 15:10 | 180 | 118 | 12 |
| 129 – 92-B | 15:10 | 23:55 | 178 | 118 | |
| 129 – 93-A | 6:46 | 15:28 | 178 | 120 | 12 |
| 129 – 93-B | 15:28 | 0:08 | 184 | 119 | |
| 31 – 91-A | 6:40 | 13:44 | 154 | 115 | 15 |
| 31 – 91-B | 13:44 | 20:48 | 154 | 115 | |
| 31 – 92-A | 6:45 | 15:04 | 176 | 126 | 14 |
| 31 – 92-B | 15:04 | 23:22 | 185 | 125 | |
| 154 – 91-A | 6:33 | 14:33 | 160 | 122 | 15 |
| 154 – 91-B | 14:33 | 22:32 | 167 | 121 |
| Sunday | |||||
| Block ID | Start Time | End Time | Distance (km) | Total Energy (kWh) | Average Number of Passengers |
| 53 – 91-A | 6:01 | 14:00 | 164 | 134 | 14 |
| 53 – 91-B | 14:00 | 21:59 | 164 | 134 | |
| 53 – 92-A | 6:36 | 13:54 | 153 | 133 | 14 |
| 53 – 92-B | 13:54 | 22:01 | 165 | 131 | |
| 12 – 91-A | 7:34 | 15:42 | 137 | 124 | 13 |
| 12 – 91-B | 15:42 | 23:51 | 168 | 117 | |
| 12 – 92-A | 8:04 | 15:42 | 137 | 119 | 13 |
| 12 – 92-B | 15:42 | 23:21 | 150 | 116 | |
| 31 – 92-A | 6:25 | 12:59 | 176 | 126 | 14 |
| 31 – 92-B | 12:59 | 19:33 | 184 | 125 | |
| 32 – 92-A | 6:25 | 12:39 | 127 | 124 | 14 |
| 32 – 92-B | 12:39 | 18:53 | 142 | 119 |
WINTER BLOCKS
The final block selection for the winter months was performed with taking heating into account. To select these blocks, existing blocks from the summer months were split in half to allow for the energy draw to be within acceptable levels. The blocks included 3 blocks for weekday evenings, 3 blocks for Saturdays, and 3 blocks for Sundays, each split in half to have two different buses run on them throughout the day.
| Weekday | |||||
| Block ID | Start Time | End Time | Distance (km) | Total Energy (kWh) | Average Number of Passengers |
| 468 -191-A | 4:39 | 8:15 | 82 | 170 | 13 |
| 468 -191-B | 8:15 | 11:48 | 87 | 173 | |
| 468 -192-A | 5:19 | 8:49 | 97 | 179 | 13 |
| 468 -192-B | 8:49 | 12:18 | 87 | 173 | |
| 468 -193-A | 4:59 | 7:11 | 58 | 167 | 19 |
| 468 -193-B | 7:11 | 9:24 | 48 | 174 | |
| 40 – 92-A | 17:37 | 20.25 | 82 | 170 | 8 |
| 40 – 92-B | 20.25 | 23:13 | 87 | 173 | |
| 97 – 91-A | 17:51 | 21:06 | 97 | 179 | 8 |
| 97 – 91-B | 21:06 | 0:22 | 87 | 173 | |
| 76 – 91-A | 17:45 | 21:13 | 58 | 167 | 5 |
| 76 – 91-B | 21:13 | 0:41 | 60 | 173 |
| Saturday | |||||
| Block ID | Start Time | End Time | Distance (km) | Total Energy (kWh) | Average Number of Passengers |
| 129 – 91-A | 6:06 | 10:42 | 94 | 176 | 12 |
| 129 – 91-B | 10:42 | 15:18 | 114 | 188 | |
| 129 – 91-C | 15:18 | 19:54 | 83 | 169 | |
| 129 – 91-D | 19:54 | 0:31 | 94 | 176 | |
| 31 – 91-A | 6:40 | 10:12 | 77 | 168 | 15 |
| 31 – 91-B | 10:12 | 13:44 | 76 | 168 | |
| 31 – 91-C | 13:44 | 17:16 | 77 | 168 | |
| 31 – 91-D | 17:16 | 20:48 | 76 | 168 | |
| 154 – 91-A | 6:33 | 10:33 | 68 | 168 | 15 |
| 154 – 91-B | 10:33 | 14:33 | 91 | 177 | |
| 154 – 91-C | 14:33 | 18:33 | 76 | 170 | |
| 154 – 91-D | 18:33 | 22:32 | 91 | 177 |
| Sunday | |||||
| Block ID | Start Time | End Time | Distance (km) | Total Energy (kWh) | Average Number of Passengers |
| 53 – 91-A | 6:01 | 10:01 | 82 | 178 | 14 |
| 53 – 91-B | 10:01 | 14:01 | 82 | 178 | |
| 53 – 91-C | 14:01 | 18:01 | 82 | 178 | |
| 53 – 91-D | 18:01 | 21:59 | 82 | 178 | |
| 12 – 91-A | 7:34 | 11:38 | 62 | 169 | 13 |
| 12 – 91-B | 11:38 | 15:42 | 75 | 170 | |
| 12 – 91-C | 15:42 | 19:46 | 75 | 170 | |
| 12 – 91-D | 19:46 | 23:51 | 93 | 180 | |
| 32 – 92-A | 6:25 | 9:32 | 57 | 172 | 14 |
| 32 – 92-B | 9:32 | 12:39 | 69 | 172 | |
| 32 – 92-C | 12:39 | 15:46 | 70 | 172 | |
| 32 – 92-D | 15:46 | 18:53 | 72 | 173 |
CHARGING SCHEDULE
To charge the buses once battery is depleted, a charging schedules were developed. This was done with the assumption that 7 chargers would be installed in the Spring Gardens garage. Time until full charge was found to be 5 hours, and 1 hour was given after the end of each block to give time in case of route delays. The charging schedules for both Summer and Winter blocks can be seen below.
Summer Charging Schedule:
| Weekday | Saturday | Sunday | |||
| Round 1 | Round 2 | Round 1 | Round 2 | Round 1 | Round 2 |
| 10:24 | 17:14 | 14:44 | 21:48 | 13:39 | 19:52 |
| 12:48 | 23:09 | 15:33 | 23:32 | 13:59 | 20:33 |
| 13:18 | 23:21 | 16:04 | 0:22 | 14:54 | 22:59 |
| 15:25 | 0:13 | 16:10 | 0:55 | 15:00 | 23:01 |
| 16:26 | 1:22 | 16:18 | 1:08 | 16:42 | 0:21 |
| 16:44 | 1:41 | 16:28 | 1:31 | 16:42 | 0:51 |
Winter Charging Schedule:
| Weekday | Saturday | Sunday | |||
| Round 1 | Round 2 | Round 1 | Round 2 | Round 1 | Round 2 |
| 8:11 | 21:25 | 11:12 | 18:16 | 9:32 | 15:46 |
| 9:15 | 22:06 | 11:33 | 19:33 | 10:01 | 18:01 |
| 9:49 | 22:13 | 11:42 | 20:54 | 11:38 | 18:53 |
| 10:24 | 0:13 | 14:44 | 21:48 | 12:39 | 19:46 |
| 12:48 | 1:22 | 15:33 | 23:32 | 14:01 | 21:59 |
| 13:18 | 2:41 | 16:18 | 1:31 | 15:42 | 23:51 |
GHG EMISSIONS
GHG emissions are important to the City of Calgary and are part of the driving force behind the implementation of this pilot program. Therefore, the GHG equivalency of each of blocks was calculated and summarized to show both the equivalent amount removed per week and the equivalent amount removed per year.
For the Summer blocks this is the equivalent of removing 4 cars off of the road per year, while for the winter blocks it is the equivalent of removing 2 cars off of the road per year. While this number may seem low, it is only for the use of 12 buses, and will drastically increase if more shuttle buses are replaced.
CONTINGENCY PLAN
Electric buses are a new technology and have not been widely implemented in Canada. This means that there may be unforeseen risks that could come up during the pilot program. While technical design and calculations can mitigate many of these risks, it does not fully negate the probability of something going wrong. To account for this our team developed a contingency plan.
For both the Summer and Winter block schedules only 12 buses have been utilized in their design. This means that for both the morning and evening components of all days of the week there will be a fully charged bus waiting in the garage in case of bus technical issues. In the case of a breakdown or some other failure, the reserve bus will be deployed to the location in order to minimize the delays experienced by riders and will hopefully preserve the public perception of the pilot program.
NEXT STEPS
Once the pilot program has been implemented there exists a need for data collection to assess the effectiveness, and for a set of benchmarks that should be met to justify a full-scale launch. Our team has prepared a list of possible data collection methods and possible benchmarks that can be used by the City of Calgary and WSP once the pilot program has been initiated.
POSSIBLE DATA COLLECTION METHODS
- Surveys
- Passenger counts
- Recording battery levels
- Recording technical issues
POSSIBLE BENCHMARKS
- Ridership change
- Rider and operator satisfaction
- Amount of technical issues
- Level of service
Partners and mentors
We want to thank the many people who helped us with this project. The guidance from our academic advisor Jacob Lamb was invaluable as he provided us with great advice through the process. And, our consultation with Diana Soroaga from WSP and Saadiq Mohiuddin from the City of Calgary was invaluable. We would also like to give special thanks to the Capstone Course Coordinator, Jacqueline Vera, and to Teaching Assistants Sebastian Perez and Ayla Lauret.
Our photo gallery
References
- Vicinity Motor Corp., “Vicinity Lightning,” Vicinity Motor Corp.. 2022 [Online]. Available: https://vicinitymotorcorp.com/modelsm/vicinity-lightning-ev.html [Accessed April 3, 2022].
