Project Category: Civil
Join our presentation
Contact if experiencing technical difficulties: domenic.bruno@ucalgary.ca
About our project
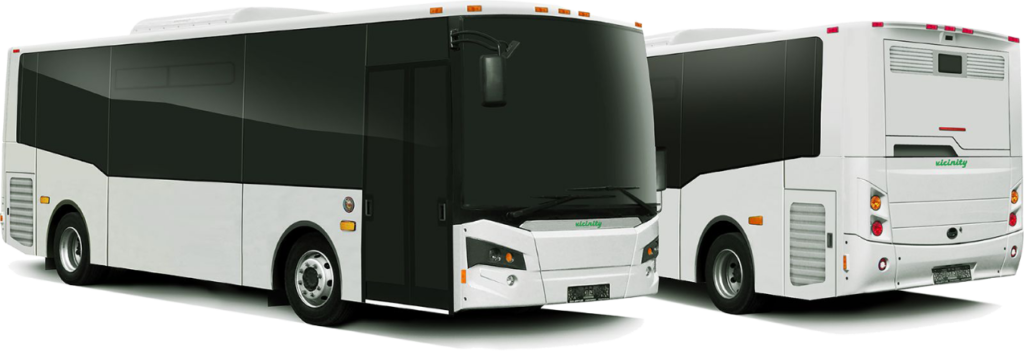
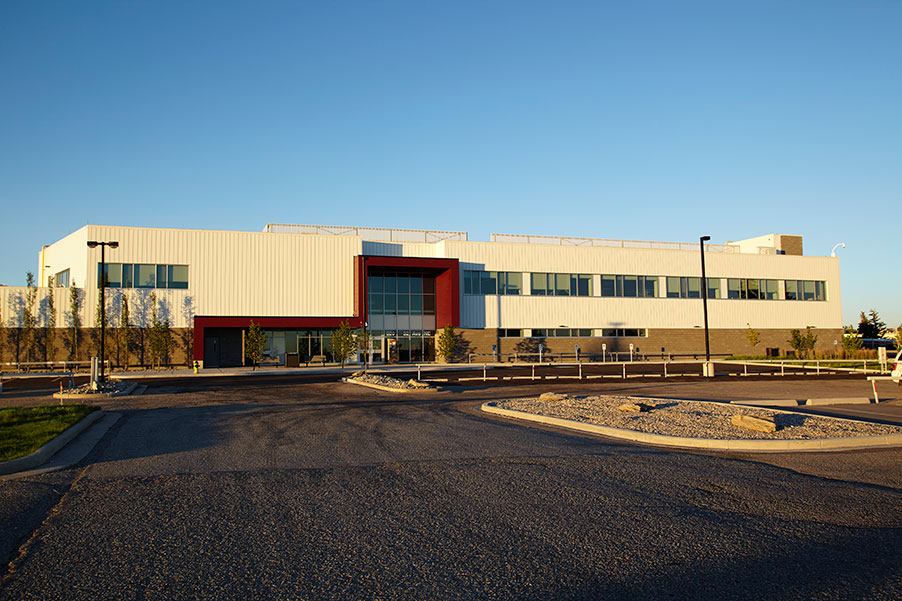
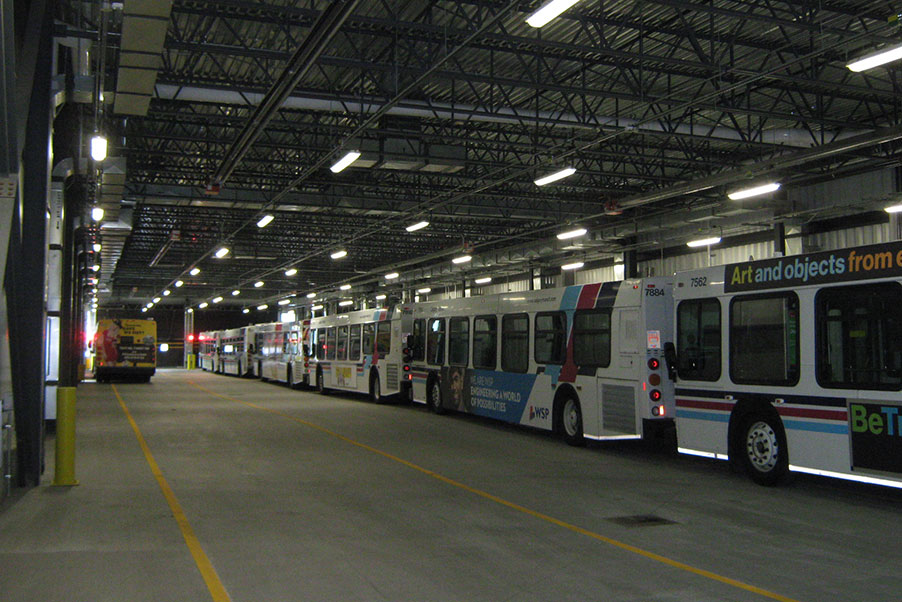
Calgary Transit is launching a pilot project in Fall 2022 to implement the usage of 14 electric shuttle buses around the City of Calgary. These electric shuttle buses will be based out of Spring Gardens garage located at 928 32 Ave NE. The design of our project was focused on developing block schedules for these 14 electric shuttle buses while also minimizing cost and GHG emissions. This was based on the City of Calgary’s interest in exploring opportunities to reduce greenhouse gas emissions as well as the group’s selection of criteria of minimizing costs.
The final design deliverable of this project was developing a block schedule for our electric shuttle buses to implement as part of The City’s pilot project. A block is the work assignment for a single vehicle (in this case a shuttle bus). These blocks or work assignments are a series of trips hooked together and assigned to a single vehicle. A block may cover more than one route and have more than one operator and this project will utilize existing Calgary Transit routes. Blocking is a critical element in the scheduling process because it serves as the basis for both costs associated with operating the revenue service vehicle as well as influencing the cost associated with work assignments for operators.
Meet our team members – Team E-nnovate
Domenic Bruno

Waleed Elnahas
Adam Huskic

Saifullah Irshad

Arsalan Khurshid
Ahmad Mohammad
Details about our design
GHG EMISSIONS
Our first piece of criteria was minimizing GHG emissions, which required the group to conduct a sensitivity analysis. To determine the carbon footprint of the gasoline shuttles that will be replaced with the electrical buses, we need to determine an emission factor. Based on data obtained from Environment Canada, the CO2 equivalent emission factor for a heavy-duty gasoline vehicle is 2365.60 CO2 eq g/L fuel [2]. Research done by the Edmonton Transit Service also determined that the average transit bus travels around 49,950 km/year [3]. Based on these values, we can determine a yearly GHG emissions value for a 30-foot City of Calgary Gasoline shuttle and compare with the new electric buses. These values were later refined in our design for the actual distance travelled each year for buses using our block design schedules.
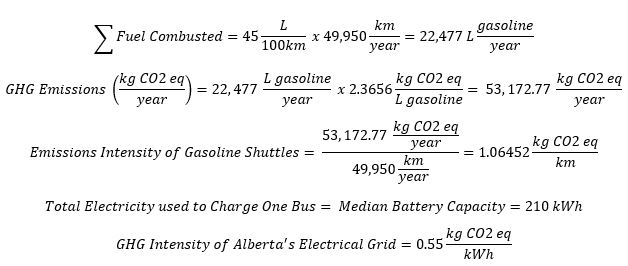
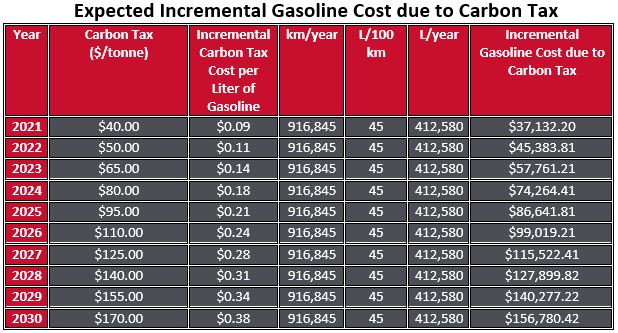
Alberta currently has a dual carbon tax system that is partly provincially imposed and partially federally imposed. In 2022, the carbon pollution price is expected to be $50/tonne. The Canadian government has announced that after 2022, the federal carbon tax will increase by $15 a tonne each year for the next eight years and finally culminate at $170/tonne by 2030 [4]. By the year 2030, Calgary Transit will be saving $156,780 in carbon taxes per year by replacing 916,845 km travelled per year by gasoline shuttles with 14 Vicinity Lightning battery electric buses.
COST MODEL
As one of the objectives in our final design was to minimize the cost of adding 14 electric shuttle buses to the fleet, we needed to develop cost comparison formulas that would compare the cost of running both electric and gasoline shuttle buses.
Gasoline Shuttle Bus
Cost = Operational Cost + Capital Cost
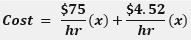
Where: x= duration of block (hr)
- $75/hr operating cost includes operator costs (50%), maintenance/fuel/cleaning/storage (30%), and back of house (BOH) expenses (20%).
Electric Shuttle Bus
As the performance differences between summer and winter are quite significant, cost models were developed separately for accuracy.
Cost = Labor and BOH support + Maintenance + Fuel + Cleaning and Storage + Capital Cost
Summer Cost Model

Winter Cost Model

Where: x= duration of block (hr), y= distance of block (km)
- Operator, cleaning/storage, and BOH costs remained the same as a gasoline bus
- Maintenance costs decrease by 40% decrease compared to gasoline shuttles [5][6]
- Fuel and Capital costs were influenced by battery efficiency and range as seen in differing terms [1]
BATTERY MODEL
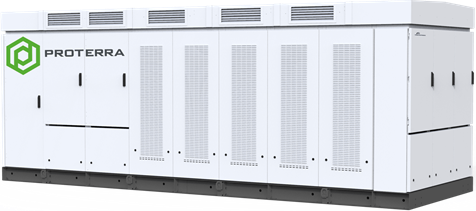
The new Proterra charging solution we are looking to implement was developed in conjunction with Power Electronics, and is more dependable, compact, and cost-effective than the charging solutions from past models, with an estimated price of one million dollars.
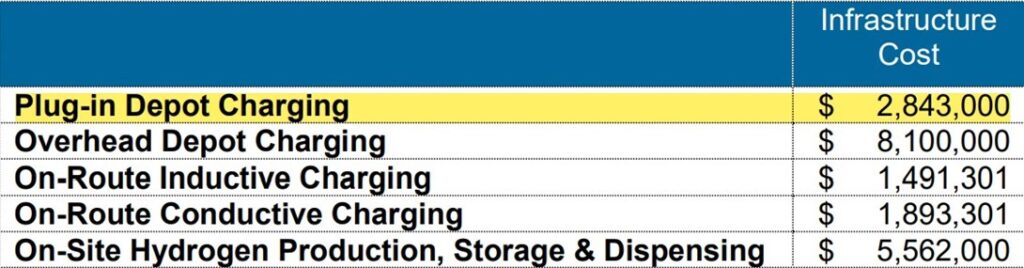
With that being said, the installation costs for the infrastructure of the plug-in depot charging are tougher to estimate as it varies heavily on each system. However, a study was done by Winnipeg transit on zero emission bus technology on a fleet of 16 buses, which is similar to our fleet of 14. They found the estimated infrastructure cost for the plug-in depot charging of a test fleet of 16 buses to be $2,843,000 [8]. As a result, we estimated our infrastructure cost to be similar due to Winnipeg having a climate like Calgary. The highlighted value from the study can be seen in the figure below:
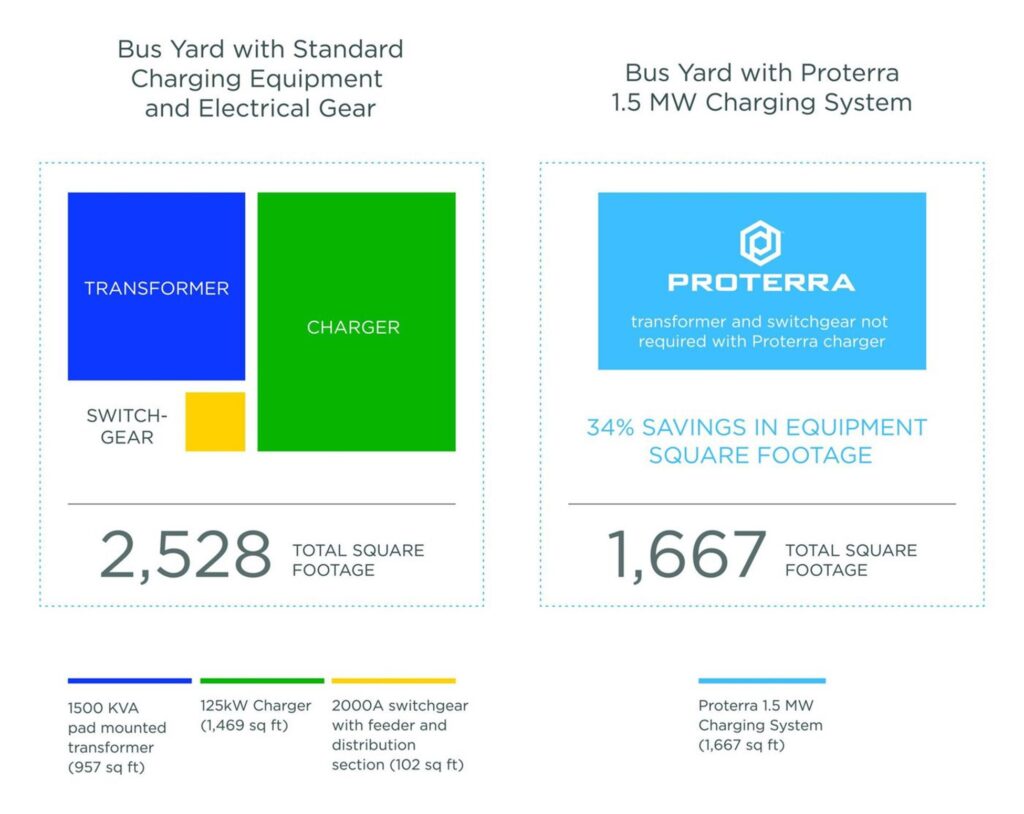
The Proterra 1.5 MW Charging System was designed with large-scale electric bus fleets in mind, and it can charge up to 20 vehicles at once, replacing many chargers with a single unit. This works perfectly for our fleet of only 14 buses as we will be able to have a quick charging turnover time. The approximate charging time for a full charge of our fleet of buses found using unit analysis was 3.36 hours each. This system’s medium voltage input capabilities allow it to connect directly to the grid, eliminating the need for separate transformer installation, resulting in substantial space and cost savings.
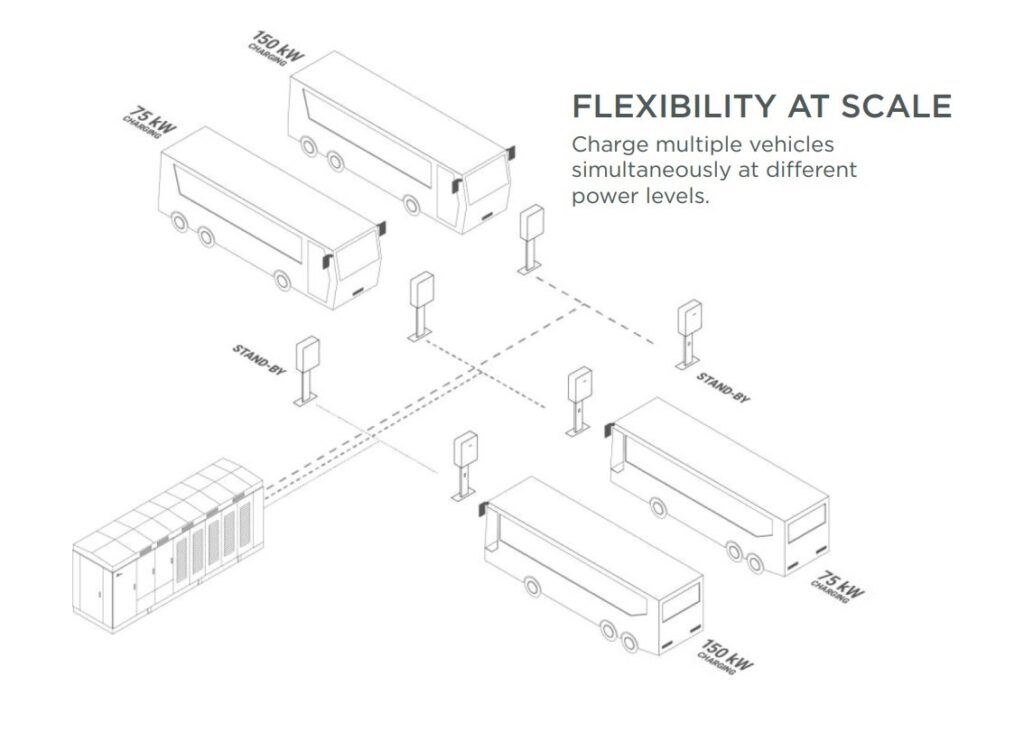
The Charging System now has the potential to charge up to 40 buses in a single charging cycle, 20 of which may be charged concurrently and then having the next 20 waiting to automatically switch into place. While this may not be the current situation with our fleet only having 14 buses, it gives the city room to expand the fleet and have a plausible charging solution on an even bigger scale.
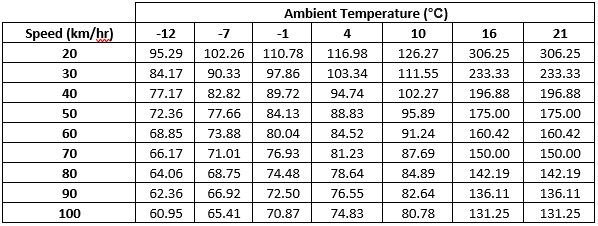
RANGE MODEL
The range of the electric shuttle buses provided by the vendor (VMC) were stated to be up to 300km. In the interest of our stakeholders, this range was validated using a independent analysis conducted by our group. Our model incorporated speed, temperature, and the effects of using an electric heater to generate an estimated mean range with the included impact of electric heating. Average temperatures were taken from the Government of Canada – Canadian Climate Normals [10], and the bus speed was provided by stakeholders to determine the range of our buses.
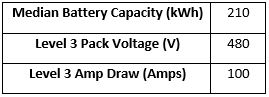
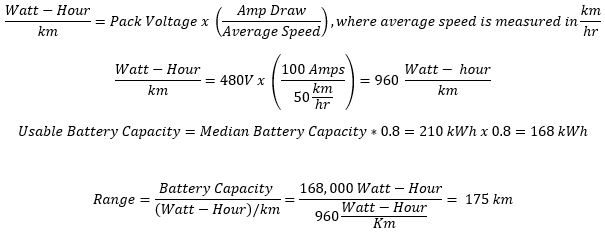
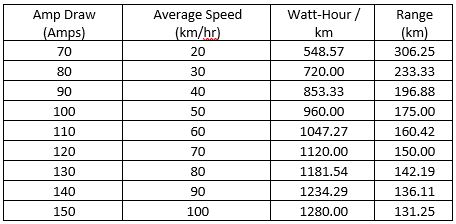
Below is a listed range of battery specifications provided by the bus manufacturer (Vicinity Motor Corp) for their Vicinity Lighting model. For these calculations, we assumed that a bus will always leave the depot fully charged so therefore we can assume level 3 charge values for voltage and amp drive. To extend the life of the battery pack, we did not discharge the batteries more than 80% in one operational use.
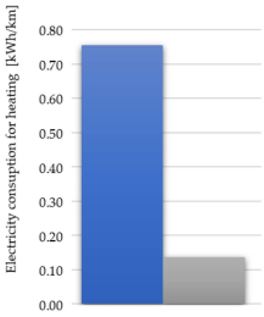
Using research done on the effects of ambient temperature by Cleveland State University [11], our group extracted key data used for our own internal modelling. This study looked at operational data from a transit agency in Duluth, Minnesota and characterized the relationship between temperature and range. We used this data as our model basis since Minnesota has a similar climate to Calgary (wide variety in temperature between summers and winters). Research from the University of Zilina [12] was then used to quantify the effect of temperature on the power consumption by internal heating/cooling systems within battery electric buses. Incorporating these effects into our model, it was noted that winter months would have their ranges greatly reduced by the use of electric heaters.
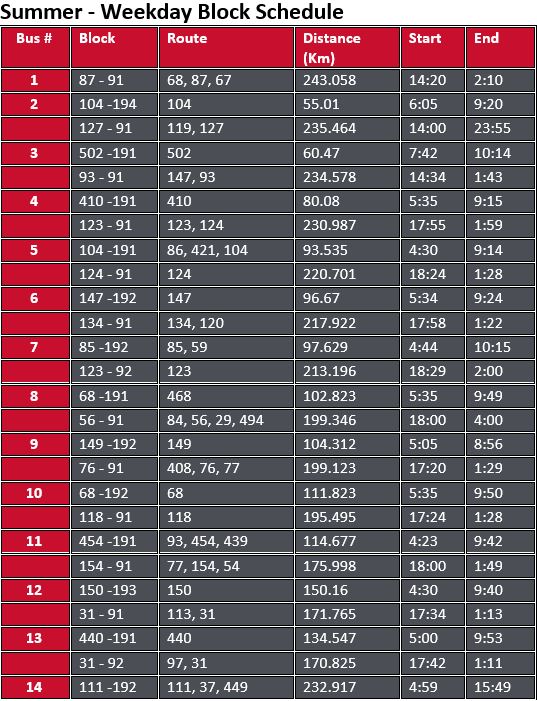
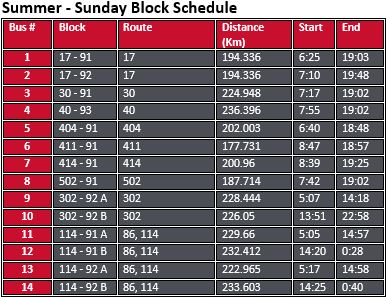
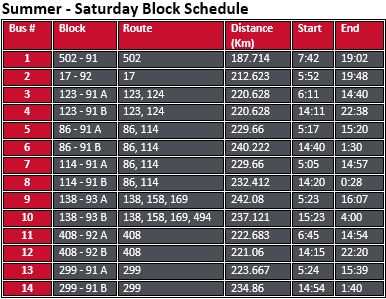
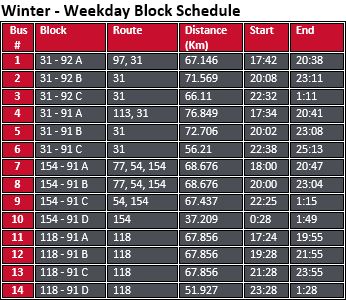
FINAL DESIGN
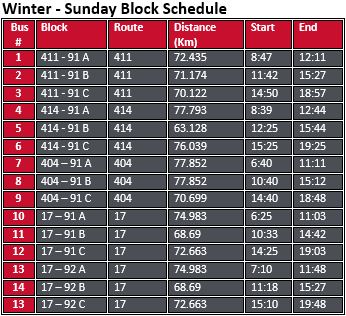
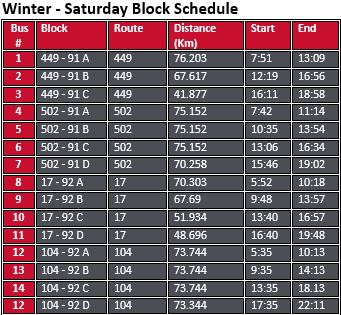
Finding a combination of block schedules that minimized the cost, while minimizing GHG emissions was the objective of our selected design. Our group decided to choose the same blocks for both summer and winter to see the differences in performance in different seasons. As the topography and distance would stay relatively the same, this would provide proper results that would be useful for Calgary Transit.
Summer Blocks would be selected based on their maximum range and then they would be split into sections in the winter. These splits are necessary as the bus range drops from 245km in the summer to 76km in the winter. Once Summer and Winter Blocks were chosen for all 14 buses, these selections would be repeated until range was properly utilized for each bus and if possible, allow buses to operate multiple blocks in one day.
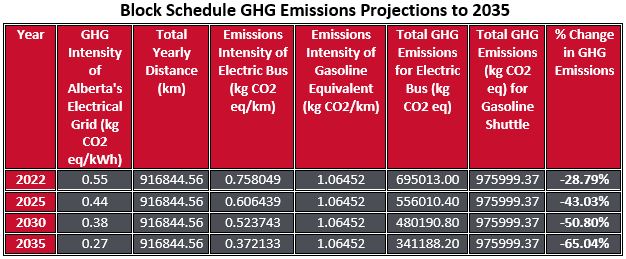
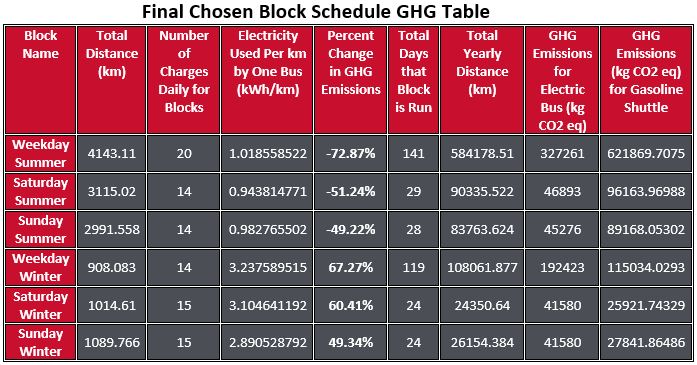
Through 4 iterations, our group was able to create 6 block schedules, 3 for Summer and 3 for Winter. This is because blocks tables are broken into Weekday, Saturday, and Sunday. Summer Blocks were prioritized for GHG emissions savings, while Winter Blocks were prioritized for cost. This is because GHG emissions are more likely in the summer as the battery has a much higher efficiency. Cost savings are less likely in the winter as the decrease in range requires splitting blocks into multiple buses. Splitting blocks has significant cost and scheduling impacts which makes it very expensive.
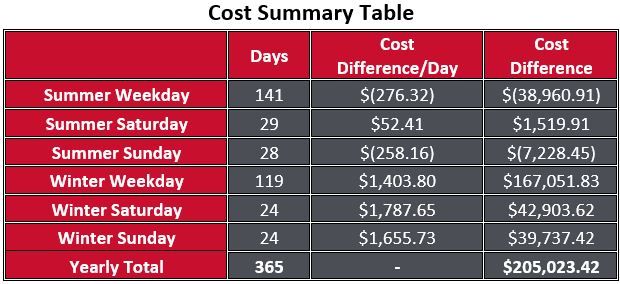
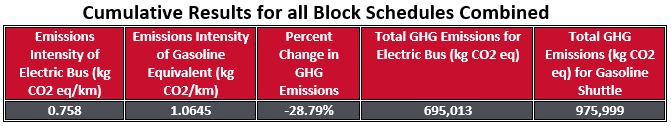
The increased yearly cost of implementing our electric shuttle bus block schedules will be $205,023.42, compared to gasoline shuttle buses. Although this cost is significant, this design is cheaper than other less optimal designs. The good news though is that our selected block can reduce GHG emissions by 28.79%. The detailed cost and GHG tables can be seen below.
Final Block Schedules
Why our design is effective
HOW OUR DESIGN ADDRESSES PRACTICAL ISSUES
Our design addresses real-world, practical issues through our design criteria.
- Climate change is a practical and relevant issue in our society. Climate change poses risks to the health and wellness of Calgarians, the economy, public infrastructure, and services, natural ecosystems, and more. Our design criterion to minimize GHG emissions addresses this issue of sustainability. When selecting our routes that would comprise our block schedule, longer routes which were feasible were selected to minimize GHG emissions since the longer the electric bus runs, the more emissions are being saved (when compared to a regular gasoline bus).
- Since this pilot project related to public transit, cost always poses an issue for public projects. The second piece of criteria our group selected for our design was minimizing costs, addressing this concern of stakeholders such as the public. A linear cost model was developed and block schedules were selected based on which minimized the cost for replacing gasoline shuttles with electric ones.
- Maintaining public transit service is another issue raised by the change in vehicle. This was addressed by selecting block schedules which were within the feasible range for our electric buses, and using existing Calgary Transit block schedules.
WHAT MAKES OUR DESIGN INNOVATIVE
There were a number of initial project constraints given to us that make this project unique and innovative. For example, this pilot project will specifically test electric shuttle buses and test them in Calgary which is of different climate, topography, and socio-economic conditions than other locations around the world. Producing a block schedule for electric shuttle buses in Calgary has not been done before, making this an innovative design solution. Typically buses use diesel heaters, however it was important to our stakeholders to use electric heaters in an effort to move towards zero GHG emissions.
The way our team approached these constraints and developed our design was innovative in that we created new ideas to deal with these constraints. From the research we conducted, we found that many case studies used full sized electric buses rather than electric shuttle buses. Therefore, the design of block schedules for electric shuttle buses rather than full sized ones would be innovative as it was not done before in previous case studies. Furthermore, from our research we found that the implementation of electric buses were frequently compared to diesel buses. In our design however, we choose to compare our design of electric buses with the City’s current gasoline shuttle buses. Research was conducted involving case studies revolving around both bus transit usage and the implementation of electric buses in Canada and Europe. The deliverables of this project were innovative and unique to our design solution in that previous cases did not use the same parameters for their electric bus pilot projects as we have (shuttle buses, electric heater, comparison to gasoline rather and diesel).
The process of developing our design itself was innovative as well. There was a focus on these buses being electric shuttle buses which have lower GHG emissions than current gas shuttle buses. In order to quantify GHG emissions a sensitivity analysis was created by our group, which was an innovative design solution to meet our deliverables. This focus on sustainability and reducing GHG emissions is an innovative solution objective that we achieved with our design. In our research we did not find other studies that prioritized minimizing cost and GHG emissions for block schedule design like we have in our solution. To select block schedules to minimize costs, a cost model was developed by our group. This again, makes our solution innovative. Our group also developed a range model to validate the vendor given range and ensure the feasibility of our design. The development of these three models (GHG, cost, range) were innovative solutions to meet our design objectives.
WHAT MAKES OUR DESIGN SOLUTION EFFECTIVE
Our design was effective in reducing GHG emissions, minimizing costs, and ensuring a feasible block schedule to implement electric shuttle buses.
- Our block schedule was selected by finding block schedules which maximized the range in order to maximize the GHG offset from using electric buses. Our design reduces GHG emissions by an estimated 28.8%. Because of this our design is effective in minimizing GHG emissions.
- Using a cost model developed by our group, blocks that had the greatest reduction in costs (when comparing to gasoline buses) or smallest increase in costs were used. The increased yearly cost of implementing our electric shuttle bus block schedules will be $205,023.42. This minimized the costs of the project (compared to other block schedules) making our design solution effective.
- Our design uses the same blocks in both the winter and summer seasons, which allows for easier future comparison of electric bus performance in winter and summer seasons. When splitting up blocks schedules, those which used less operators were selected, making this an effective design decision from an operational perspective.
HOW WE VALIDATED OUR DESIGN SOLUTION
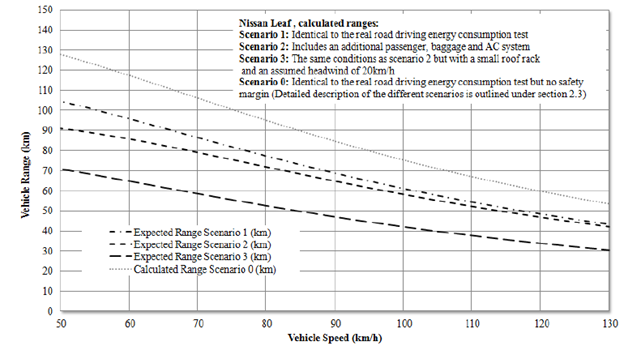
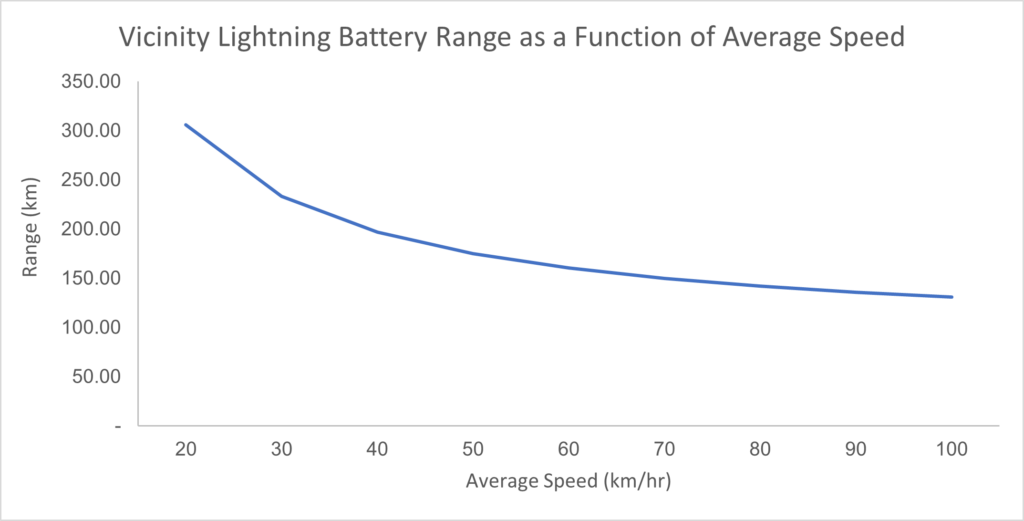
Quality checks and stakeholder feedback were key parts of validating that our design would be reflective of the real world. Our range model was compared to other electric vehicles such as the Nissan Leaf, which was used to justify the validity of our results. Our independent model created for the electric bus range validated the roughly 300km expected max range of the buses provided by the vendor.
Many case studies were reviewed when developing our design, ensuring that no unreasonable assumptions were made and that industry standards were followed. The City of Edmonton conducted a electric bus pilot project and published a feasibility report, which was used as part of our research when validating if our assumptions and design choices were appropriate for Calgary since Edmonton is geographically and socio-economically similar to Calgary.
The range of the electric shuttle buses matched roughly the expected value which was provided by the vendor Vicinity Motor Corp. Our range was also compared against other electric vehicles, most notably the Nissan Leaf. From this is was found our model produced similar results as seen in the figures below:
FEASIBILITY OF OUR DESIGN SOLUTION
Our design meets all of the design limits and constraints and is feasible. Since existing Calgary Transit blocks were selected, it was assumed that these routes would be feasible in terms of service and regular operation to provide service to the public. The ranges of our electric buses were modelled and validated, and the block schedules selected are feasible for the electric buses to run given their ranges. These ranges were different in winter and summer due to the temperature and use of electric heaters, and this was taken into account and block schedules were selected accordingly to ensure the distance travelled was not greater than the bus’s range.
All of our electric buses depart from and arrive at the spring gardens garden and only blocks that were feasible to do this were selected. This means that blocks which did not depart from and return to Spring Gardens garage were filtered out. Also, blocks which had pull in and pull out distances of 60+ km were filtered out as they were not feasible to the range of the buses in the winter. By minimizing costs, our design is feasible in term of cost to stakeholders, particularly the public. Considering environment sustainability is a large part of the design criteria for our design, we came up with a solution which feasibly reduces greenhouse gas emissions compared to gasoline buses. This is backed by our GHG analysis, and research conducted that all pointed to electric buses being more sustainable for GHG emissions.
Summary Sheet
Please feel free to download a copy of our summary sheet for our project.
Partners and mentors
We want to thank the many people who helped us with this project. Our Academic advisor Jacob Lamb who guided us through the process with patience and great advice. Also, our consultation with Saadiq Mohiuddin from the City of Calgary and Diana Soroaga from WSP was invaluable. They provided us with insight and guidance on our final deliverables as well as the information that made our design possible. A special thank you to capstone course coordinator Professor Jacqueline Vera and TAs Sebastian Perez and Ayla Lauret.
Our photo gallery
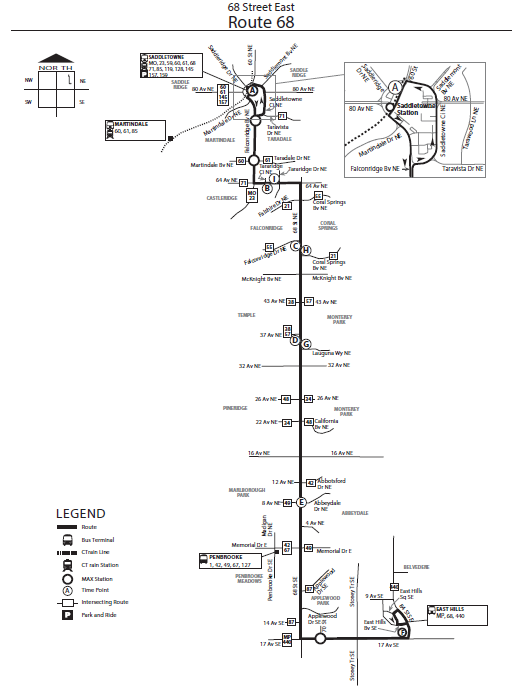

Both of these routes (68 & 118) will be run by one electric shuttle bus on a summer weekday
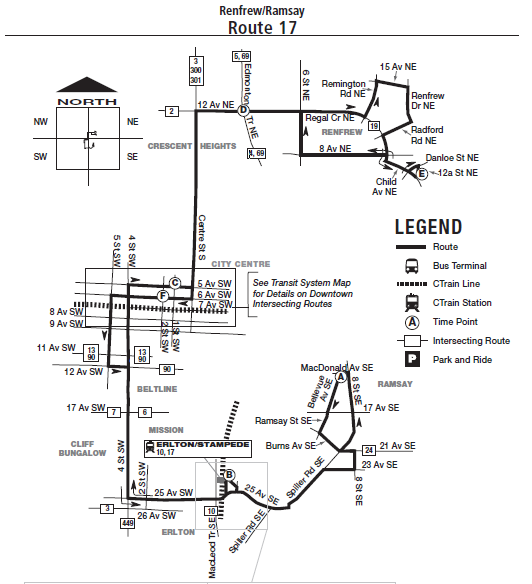
Multiple electric buses will be required to run this route (17) in the winter
References
[1] Vicinity Motor Corp., “Vicinity Lightning,” Vicinity Motor Corp.. 2022 [Online]. Available: https://vicinitymotorcorp.com/modelsm/vicinity-lightning-ev.html. [Accessed 3 April 2022].
[2] T. D. Group, “Public Transit Projects GHG Quantification Guide,” 2008.
[3] Marcon, “Electric Bus Feasibility Study,” City of Edmonton , Edmonton, 2016.
[4] M. Barnard, “Canada’s Carbon Price Will Hit Provincial Gasoline Prices Differently,” Cleantechnica, 2021.
[5] J. Aber, “Electric Bus Analysis for New York City Transit,” New York City Transit, New York City, 2016
[6] Marcon, “Electric Bus Feasibility Study,” City of Edmonton, Edmonton, 2016
[7] Proterra, “Proterra Charging Infrastructure,” Proterra, 2022. [Online]. Available: https://www.proterra.com/products/charging-infrastructure/. [Accessed 30 March 2022].
[8] E. Cooke, “Transition to Zero-Emission Techincal Evaluation Report,” Winnipeg Transit, Winnipeg, 2021.
[9] Proterra, “Proterra Spec Sheet,” 2022. [Online]. Available: https://www.proterra.com/wp-content/uploads/2021/09/Proterra-Spec-Sheet-CHG-SYS_1.5M_V5_9.27.21.pdf. [Accessed 30 March 2022].
[10] Government of Canada, “Canadian Climate Normals 1981-2010 Station Data” Government of Canada, 2022. [Online]. Available: https://climate.weather.gc.ca/climate_normals/results_1981_2010_e.html?searchType=stnProv&lstProvince=AB&txtCentralLatMin=0&txtCentralLatSec=0&txtCentralLongMin=0&txtCentralLongSec=0&stnID=2205&dispBack=0. [Accessed 3 April 2022].
[11] A. T. A. S. Mark Henning, “An Analysis of the Association between Changes in Ambient Temperature, Fuel Economy, and Vehicle Range for Battery Electric and Fuel Cell Electric Buses,” Cleveland State University, The Midwest Hydrogen Center of Excellent, Center for Transportation and Environment.
[12] V. S. K. H. a. J. M. Kristian Culik, “Interior Heating and Its Influence on Electric Bus Consumption,” University of Zilina .
[13] J. W. T. B. Guido Wager, “The effect of higher driving speeds on energy consumption and driving range for electric vehicles in Australia,” The University of Western Australia .
[14] Graham. “Spring Gardens Bus Storage” https://www.grahambuilds.com/projects/spring-gardens-bus-storage/ (accessed April 3, 2022)
[15] Calgary Transit, “Route 68 – 68 Street East” Calgary Transit, 2022. [Online]. Available: https://hastinfo.calgarytransit.com/HastinfoMVCWeb/RouteSchedules?Date=2022-04-04&RoutePublicIdentifier=68&RouteDirection=North. [Accessed 3 April 2022].
[16] Calgary Transit, “Route 118 – Hidden Valley” Calgary Transit, 2022. [Online]. Available: https://hastinfo.calgarytransit.com/HastinfoMVCWeb/RouteSchedules?Date=2022-04-04&RoutePublicIdentifier=118&RouteDirection=North. [Accessed 3 April 2022].
[17] Calgary Transit, “Route 17 – Renfrew/Ramsay” Calgary Transit, 2022. [Online]. Available: https://hastinfo.calgarytransit.com/HastinfoMVCWeb/RouteSchedules?Date=2022-04-04&RoutePublicIdentifier=17&RouteDirection=North. [Accessed 3 April 2022].
