Project Category: Civil
Q&A Zoom Room
If there are any issues logging into the Zoom room, please send an email to ucalgarysharedmicromobility@gmail.com for assistance.
About Our Project
In October 2018, the City of Calgary unanimously approved a two-year pilot program, allowing three private operators to deploy shared electric bikes and scooters onto the streets of Calgary. The costs of the pilot including device operation and any resources provided by the City were to be covered by the operators’ revenue.
The devices grew rapidly in popularity, and while they were embraced by many Calgarians, it was not without some opposition. By the end of October 2020, over 1.87 million trips had been made using these shared micro-mobility devices. Acting on feedback from its citizens, the City worked with the operating companies to implement measures such as low-speed zones, parking requirements, and by-law changes, in an effort to improve the streets of Calgary for both riders and non-riders.
With the conclusion of the pilot program, the City of Calgary was looking for specific insights regarding the program’s performance and micro-mobility device use. We were asked to provide pragmatic, data-driven recommendations to the City to improve the use of these devices and to boost mobility and vitality in Calgary. To deliver the results the City was after, the following engineering deliverables were developed:
- Data Analysis Model – Interactive visual dashboards built with Power BI and Python allowing the end-user to analyze data and generate specific insights.
- Data Output Report – Comprehensive report of numerical and visual outputs from the model, allowing the end-user to view key insights without using the model itself.
- Data-Based Recommendations – Feasible engineering recommendations based on conclusions drawn from the data analysis model cross-referenced with additional information sources. These recommendations needed to be straightforward and pragmatic, so they could be considered for implementation by the City.
The video linked below provides a concise look at our Interactive Data Analysis Model, including a brief demonstration of its use.
Interactive Data Analysis Model


The Data Analysis Model is a highly interactive dashboard of visuals that displays processed data from a range of sources in meaningful and easy-to-digest ways. The model was built using Microsoft Power BI and Python. The backbone of the model is made up of micro-mobility usage datasets provided by the City of Calgary:
- Origin-Destination Data – where and when trips originated and terminated, aggregated into a hexagonal grid system of 30,000 sqm.
- Route Data – usage frequency of route segments aggregated by month.
These datasets were aggregated to protect the identities of micro-mobility device users.
Python was used to process and transform these datasets to achieve the following:
- Associate trips with origin-destination points and route segments to communities and Business Improvement Areas (BIAs) within the City (.TopoJSON, .GeoJSON, .gdb, .shp, .kml, etc).
- Identify geometric boundaries of various areas of interest and coordinate pairs from the micro-mobility data that fell within these boundaries.
- Convert the spatial location classification into a non-spatial format (.csv) to be used in Power BI.
Micro-mobility devices can meet various user demands, whether it be recreation, commuting, or travelling to food and entertainment. Other datasets of interest used in conjunction with the micro-mobility datasets after examining potential trip generation and attraction factors include:
- Historical hourly weather data from the Calgary International Airport (.csv).
- Calgary’s business license listing (OData).
Power BI efficiently uses data from many different sources to create interactive visuals, and Python was used to link and reconcile the differences between spatial and non-spatial datasets to allow for smooth integration into the Microsoft program.
As seen in the timeline below, the model underwent several iterations with review conducted by members of the team and project advisors. Changes were proposed and new features were implemented to ensure stakeholders were provided with a product that met their needs. The solution also ensures the recommendations required could be achieved by examining model outputs.

The model uses three modes of analysis to fully assess micro-mobility usage in Calgary: Start-End Analysis, Time-Usage Analysis, and Trip Segment Analysis.
In the sections below, each mode of analysis is explained, and an in-depth breakdown of each page of the model can be viewed by expanding their respective title ribbons.
Final Model Overview
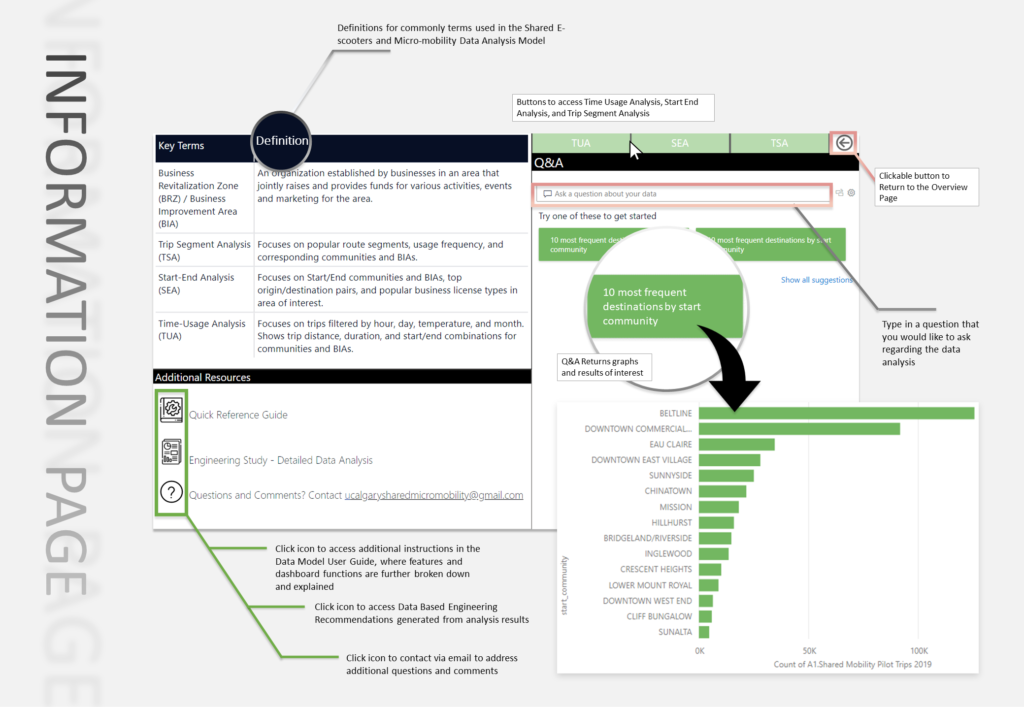
The Information Page provides the user with general information about the model. This includes definitions of key terms, resources such as the Quick Reference Guide and Detailed Analysis Document, along with an interactive Q&A feature through which the user can ask questions about the data and receive answers in the form of charts, graphs, and key indicators.
The Overview Page provides a high-level summary of the three analysis types included in the model. This page is perfect for stakeholders who wish to understand the big picture, without deep diving into the details of each analysis mode.
Information Page
Overview Page

Start-End Analysis
Start-End Analysis (SEA) examines trip start and endpoints, as well as why users were travelling to or from those areas. To identify the resources and attractions motivating users to travel by e-scooters, SEA analyzes the origin and destination points in reference to Business Improvement Areas (BIA) and communities within the City of Calgary, and the business licenses registered in those areas.
In order to analyze data at the community and BIA level, the trip data previously aggregated into 30,000 sqm hexagonal grids needed to be assigned to their respective communities and BIAs. Python was used to check which hexagons belonged to which of these areas, and to generate a key of these associations to be used in Power BI. This key allowed all data associated with a particular grid identification number to then be associated with a community or BIA name.
With stakeholder and public interest in mind, understanding the popular origins and destinations of trips, as well as the potential reasoning behind those trips assisted in generating recommendations for designated seasonal and event-focused parking spots within the City to mitigate scooter littering.
Start-End Analysis: Business Improvement Areas

Start-End Analysis: Communities

Start-End Analysis: Key Takeaways

Top 20 Destination Areas
This ranked list of the top 20 destination areas (based on 30,000 sqm hexagonal grids) in the City of Calgary is one key takeaway from Start-End Analysis. It was used as the starting point for our parking recommendations where these spots were compared with 311 caller-identified problem areas, proximity to other identified parking locations, and proximity to C-Train stations. The final parking recommendations are included below, in the Recommendations section.
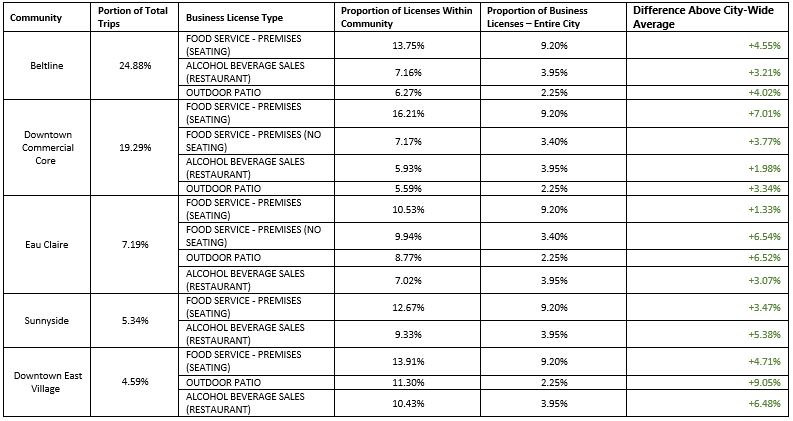
Business License Prevalence in Top Destination Communities
Business licenses registered in the top destination communities were examined to identify factors driving micro-mobility device usage in those areas. It can be seen that food service businesses including those with and without seating, with outdoor patios, and those with alcohol service all make up a greater proportion of the business licenses registered in the top 5 destination communities than the proportion they comprise of city-wide businesses. This identifies these businesses as a potential attractor for micro-mobility device use within a community.
Time-Usage Analysis
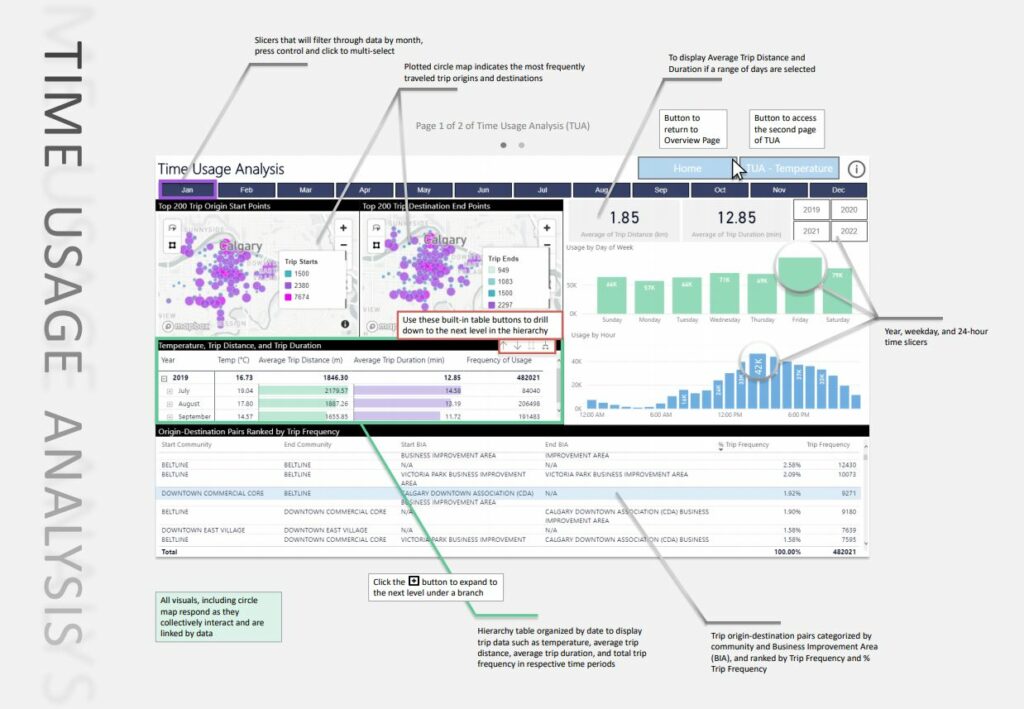
Time Usage Analysis (TUA) dissected the origin-destination pairs by different time periods and time frames to discover changes and recurring trends. Data was sorted by hour, by individual days, by days of the week, by month, and by year. Characteristics like temperature and weather data sourced from the Government of Canada website were also used to study their effects on micro-mobility device usage. Micro-mobility data provided date, duration, distance traveled, and start hour for trips that took place during July 1, 2019 to September 30, 2019. The relationship between usage demand and geographical location were analyzed and ranked based on destination frequency. TUA broke down available data into various time frames to capture smaller trends that existed within micro-mobility usage. TUA examined additional local and special events in Calgary in conjunction with TSA and SEA to identify event-specific trends.
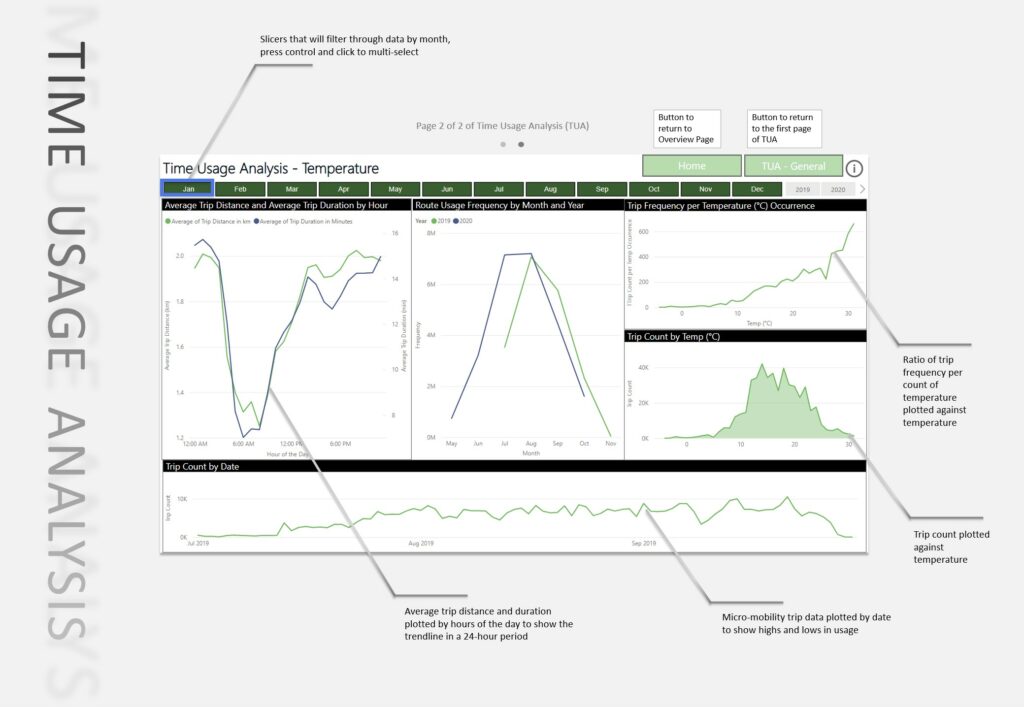
Time-Usage Analysis: Main

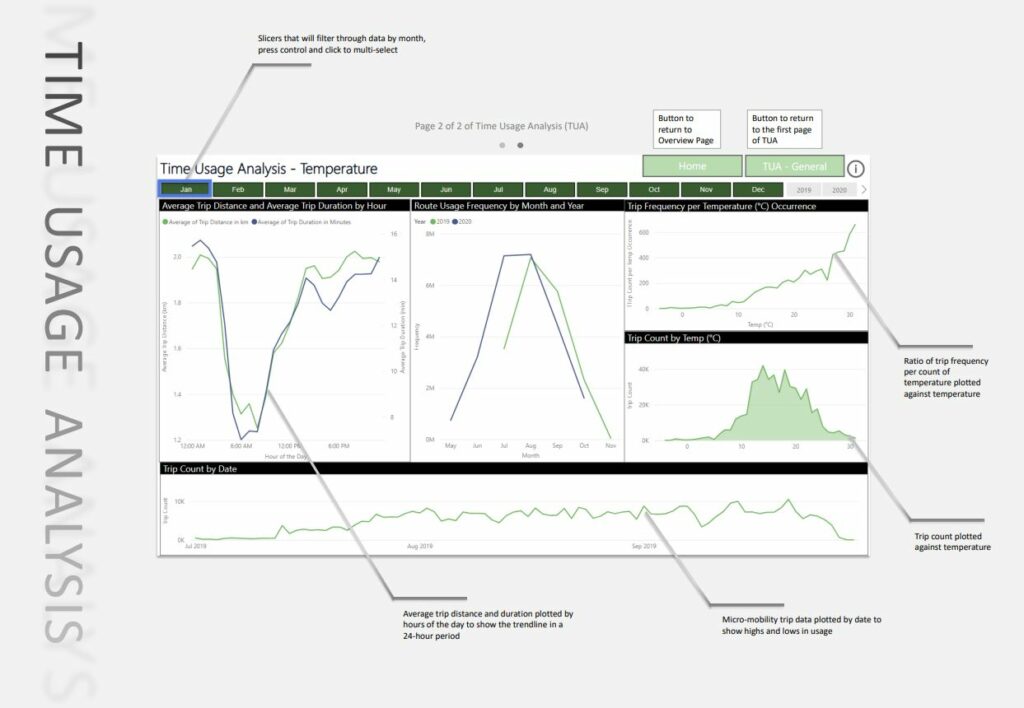
Time-Usage Analysis: Weather
Time-Usage Analysis: Key Takeaways
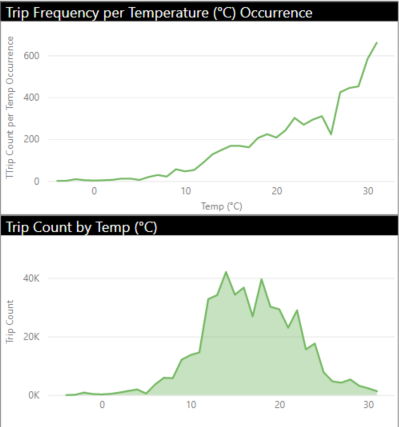
Usage at Higher Temperatures
In analyzing peak temperatures of usage, highest total usage was found to occur during 14°C. However, the trip frequency per temperature occurrence graph shown made it evident that higher temperatures have a higher usage per hour of temperature occurrence. For example, July-September of 2019 had 283 hours in which 14°C occurred, while 31°C occurred during only two hours in the same time period. This shows that although Calgary weather provides less opportunities for riders to use shared mobility devices during hot temperatures, users still gravitate more towards warmer temperatures.

Peak Hours for e-Scooter Travel
By looking into usage by hour, peak hours and patterns are found for weekdays and weekends. These peak hours are used to help determine during which times speed restrictions should be recommended to the City of Calgary. Furthermore, the peak hours can be determined for specific communities, and provide insight on peak times that each individual community may experience.
Trip Segment Analysis
Trip Segment Analysis (TSA) examined popular routes in relation to Business Improvement Areas (BIAs), communities, and road type. Route frequencies were tracked by how many times a micro-mobility device used a route segment. This analysis aims to understand which routes users of micro-mobility devices are using to travel between different areas, and what characteristics contribute to route popularity.
TSA plots the latitudinal and longitudinal coordinates of route segment centroids on a map of Calgary. In order to analyze data at the community and BIA level, a Python script was used to assign coordinate pairs to their respective areas of interest by checking against area boundaries. Python was used to generate a location key with these associations to be used in Power BI. The center points of route segments were used to approximate route location on a map of Calgary to limit the number of overlapping data points. This analysis primarily focuses on July to October 2020 data and compares the trends against July to October 2019, as there were many adjustments after the first year of the pilot program. Unlike the micro-mobility origin-destination dataset, route segment usage was not provided per individual trip, but as a cumulative total by month.
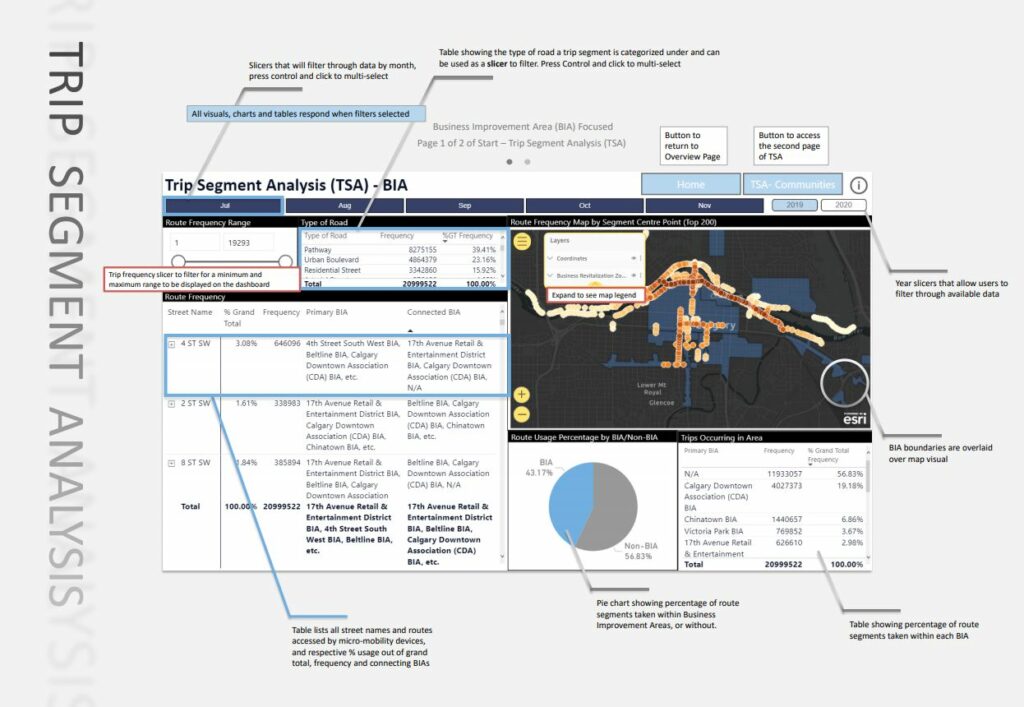
Trip Segment Analysis: Business Improvement Areas

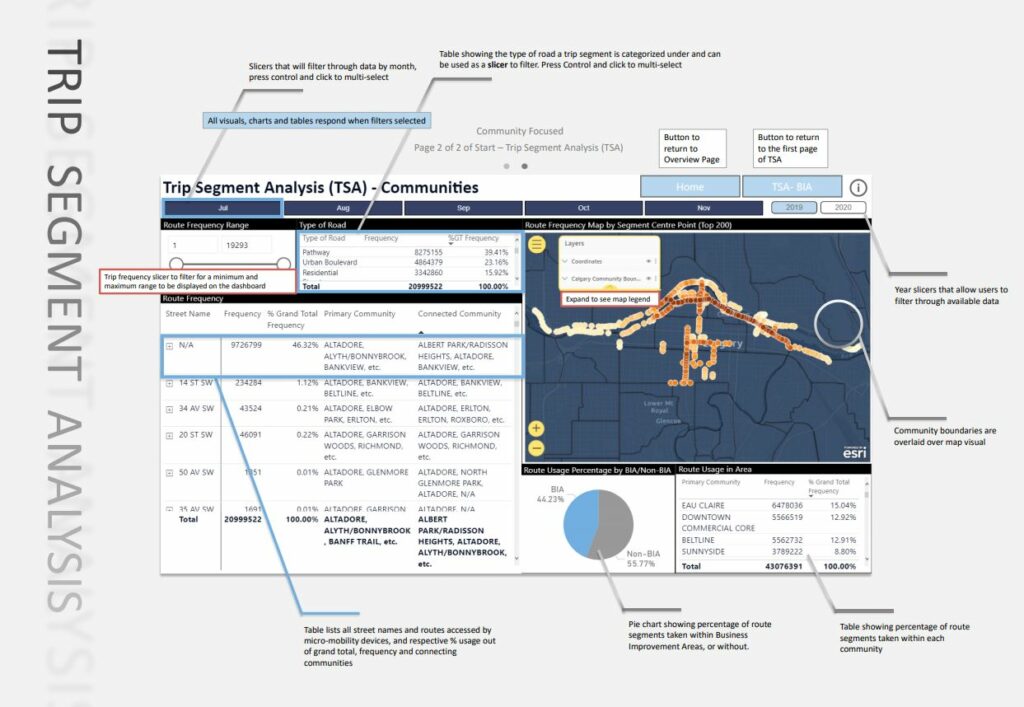
Trip Segment Analysis: Communities

Trip Segment Analysis: Key Takeaways
Most Highly Utilized Routes
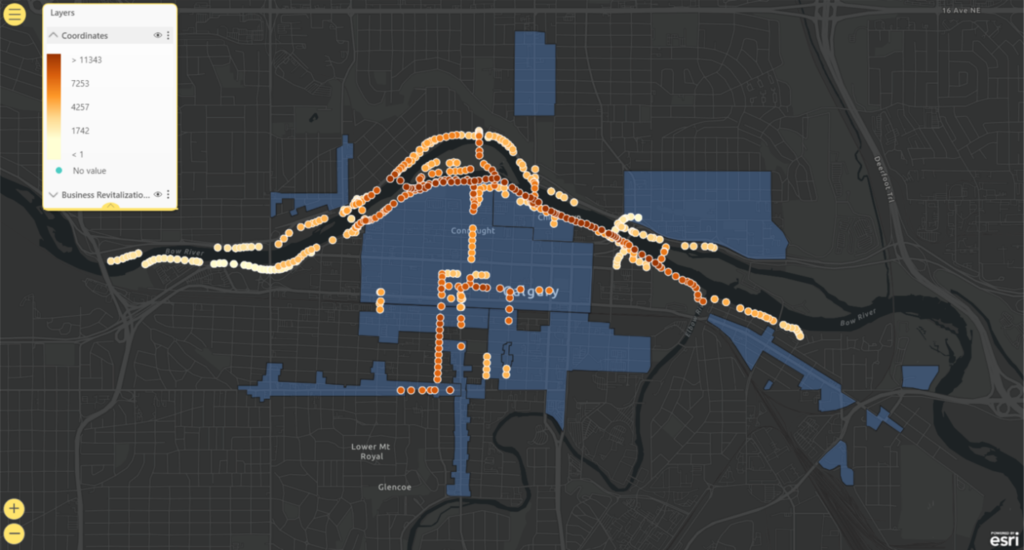
TSA focused on routes with the highest usage frequency and utilized findings to recommend additional micro-mobility linkage. The additional linkage recommendations considered the frequency of the route usage by micro-mobility users, road type, and the chosen route’s characteristics. The image to the left shows the top 200 route segments, demonstrating that route usage is most concentrated along the Bow River Pathway, and along urban boulevards and residential streets within the BIAs. Pathways, urban boulevards, and residential streets make up 38.95%, 23.44%, and 15.84% of total route usage, respectively.
Connecting Businesses
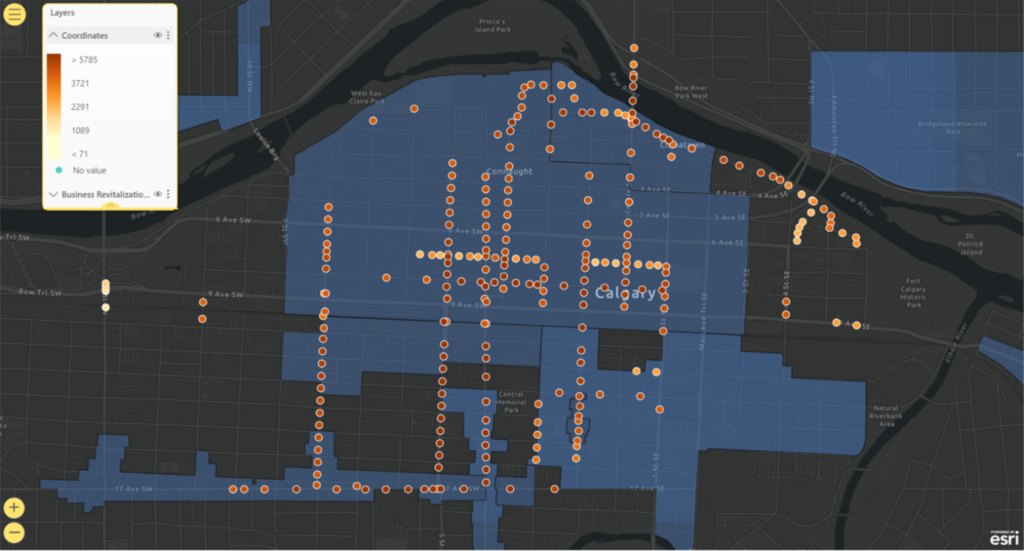
This map demonstrates the route usage that occurred on urban boulevards and residential streets which made up 39.24% of total route usage in 2020. The majority of the routes either lie within a BIA or connect the BIAs within the downtown area. The most notable routes are along 8 St SW, 5 St SW, 4 St SW, 2 St SW, 1 St SW and 8 Ave SW which were further examined to make additional linkage recommendations within Downtown.
Takeaways from Analysis Integration
Key takeaways from each of the three analysis modes were integrated to provide meaningful insights to existing micro-mobility issues within the city.
The analysis integration examined the change in destination frequencies and routes with respect to time and other characteristics like destination business licenses. From July to September 2019, both micro-mobility trips and route usage peaked in August. The most popular areas of the city are within downtown, with Beltline, Downtown Commercial Core, and Eau Claire as the three most popular destination communities of all time. Micro-mobility usage peaked on Wednesdays, Fridays, and Saturdays, and destinations with a higher percentages of food services and alcohol sales seemed to be more popular than non-peak periods. Business license types that generated the highest average destination frequency belonged to areas with apartment building operators, followed by outdoor patio and then food service premises with seating.
The most popular routes remained consistent irrespective of month and aligned with the most popular destination communities of Beltline, Downtown Commercial Core, and Eau Claire. Origins and destinations with respect to the morning and afternoon rush hours were also analyzed. From the period of 7am to 9am on weekdays, the Downtown Commercial Core experienced a significant increase in destination frequency as people migrated into this high-density area for the workday. On weekdays, a consistent pattern reversal was demonstrated from 4pm to 6pm, as Downtown Commercial Core experienced an increase in trip origin frequency as people migrated away from city center.
Data-Driven Recommendations
The map below outlines the data-driven recommendations that have been assembled based on outputs of the Data Analysis Model using the three modes of analysis described above. These recommendations are described in greater detail below.

Linkage Recommendations, Justification, and Implementation
Linkage recommendations to improve the existing micro-mobility network in Calgary are driven by findings from TSA and SEA. The proposed linkage additions are split into two groups: permanent and seasonal.
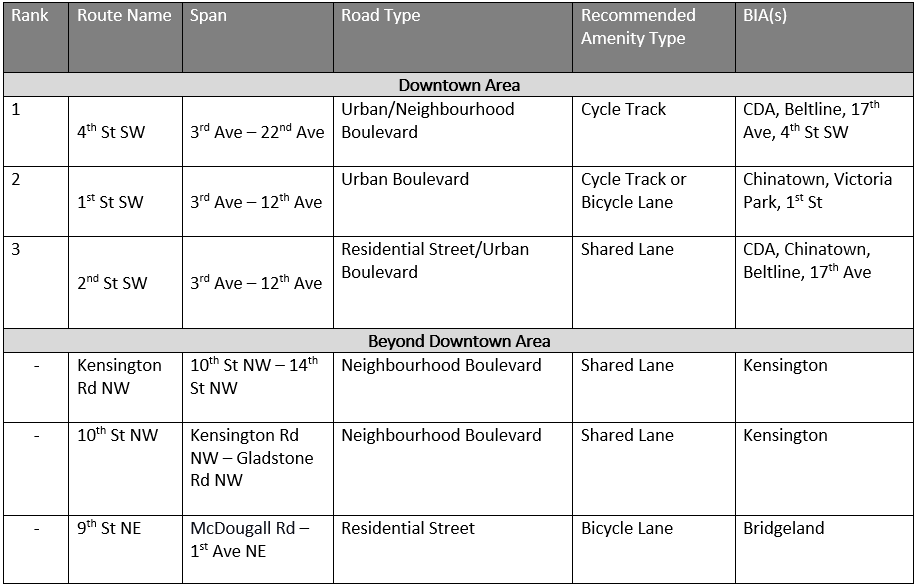
Permanent linkage recommendations are indicated in yellow on the map above with proposed permanent connections in downtown ranked by the criteria in the following table. The recommendations are largely influenced by usage frequency and route popularity, with an emphasis on connectivity between various high-interest business improvement areas. Cycle tracks or bicycle lanes are advised to be implemented on routes with more lanes, and streets with lower vehicular volume to implement shared lanes. Unlike bicycle lanes and shared lanes, cycle tracks have a physical barrier separating micro-mobility users from traffic. Usage of existing micro-mobility amenities were also examined, with proposed linkages prioritizing connection to popular amenities.

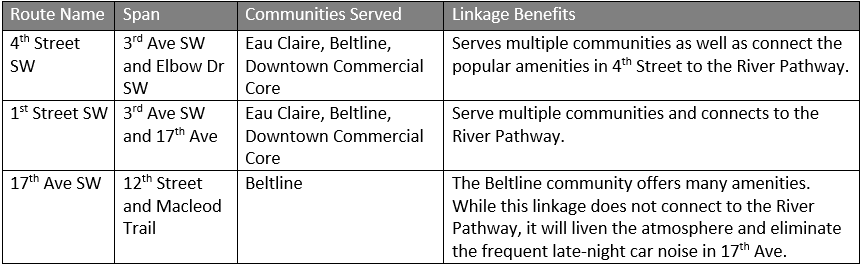
Seasonal linkage recommendations are made to reflect the higher micro-mobility demand during the summer months, while minimizing the negative impact on local traffic and businesses. Two of the recommendations, 4th St SW and 1st St SW, overlap with the proposed permanent linkages. To mitigate the effects of the recession as a result of the COVID-19 pandemic, seasonal network recommendations like temporary lane closures address the demand for micro-mobility, while avoiding unfavorable construction activities that result in area closures for an extended period. Based on findings from TUA, the seasonal network should be in place in preparation for when average temperatures are 14-15 °C. These temperatures caused ridership to dramatically increase and accumulated the most trips. Permanent linkage recommendations are indicated in light blue dashes in the map above.
Device Parking Recommendations, Justification, and Implementation

Popular trip destinations were determined from the Micro-mobility data analysis model’s Start-End Analysis (SEA) where the top 20 most frequently traveled destinations were scored and ranked based on various consideration factors. Map visuals showcase these trip endpoints and their relative locations in Calgary. Plots of scooter parking spaces were marked on Google Maps’ street view to indicate the exact areas of where they would be placed.
The priority sequence to which the parking locations should be installed is determined with a scoring mechanism. The scoring criteria include the popularity ranking, where trip destinations that are more frequently traveled are ranked higher. Public stakeholder feedback via 311 call complaints for e-scooter parking locations are also considered, along with parking location redundancy, as well as the parking location’s distance to a C-Train station. The criteria are adjusted based on importance scale factors shown in the table below.

Feasibility of Implementation
Using the third generation Lime scooter dimensions as a reference, its length, width, and height are respectively: 116.3 cm, 48.5 cm, and 120.4 cm. Extra access room was added to accommodate for ease of access, and the estimated area taken up by each scooter was changed to 50 cm by 150 cm. Each parking location was designed to fit at least 5 scooters, and therefore the minimum area needed to install a parking space is 2.5 m by 1.5 m.

Feasibility of implementation needed to be assessed for the generated engineering solutions. The City of Calgary has $30,000 in funding to allocate towards parking infrastructure, and the recommendations must stay within this budget.
The proposed 20 parking locations are all on public property and sidewalks, paint lines can be put in to indicate the location of the parking space. The micro-mobility program is only active during spring and summer months, when snow will not heavily obstruct visibility of the ground’s surface. Paint lines is an efficient, semi-permanent method to install parking infrastructure. A unit price estimation was done on painting parking lines in terms of its labour, equipment, and materials based on bare cost to provide a rough order of magnitude. The 2021 construction unit price came out to be $34.80 per parking spot with a lump sum of $696.00, which is under the city proposed budget.
Safety Recommendations, Justification, and Implementation
Based on data outputs from the Start End Analysis (SEA), Trip Segment Analysis (TSA) and Time-Usage Analysis (TUA), time periods, areas and routes with high micro-mobility usage were considered for speed reductions in attempt to enhance safety in ridership, limit disruption between pedestrians and micro-mobility devices. The recommended operation speed for e-scooters and other micro-mobility devices was dependent on route popularity and peak usage hours. The maximum operational speed for an e-scooter is 20 km/h. In all existing road types in the city of Calgary, routes that allow e-scooters and other micro-mobility devices to operate with a physical barrier separating them from vehicle traffic are excluded from speed restrictions along with streets that have pathways, shared lanes, cycle tracks, and other designated infrastructure. These engineering justifications assume that pedestrians travel with discretion and do not encroach on bike lanes, and that there is enough shared space on existing pathways.
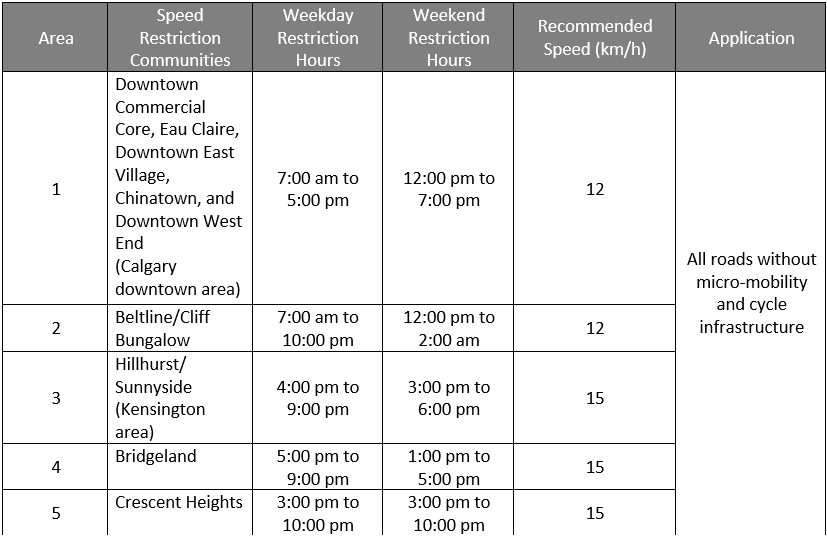
The top 10 communities with the highest route usage frequency were considered for speed restrictions; Downtown Commercial Core, Eau Claire, Beltline, East Village, West End, Chinatown, Cliff Bungalow, Hillhurst, Sunnyside, Bridgeland and Crescent Heights are responsible for 80.13% of the total route usage. Each community’s road types were examined in parallel with peak hour distribution data to determine if speed reductions were necessary. Speed reductions were applied to livable road types that prioritize walking, cycling, and transit patrons while hosting higher vehicular volumes. A notable safety concern was raised when examining popular routes leading into Bridgeland BIA. The data suggests that users were travelling along the 4th Avenue Flyover, a skeletal road with high speeds and high vehicular volume. Skeletal roads are not designed for micro-mobility devices, it is advised that riders use the neighbouring Langevin Bridge instead. Micro-mobility providers and the City of Calgary should be aware of this safety risk and potentially implement geofencing or fines for travelling on routes that are unsuitable for these devices.
Implementation of speed restriction recommendations would be carried out by third-party software in the shared mobility devices, as well as regulations put in by the City of Calgary. Additional speed restriction areas and times are highly feasible as certain areas in Calgary already have speed restrictions. In cases where restricted speed limits impact micro-mobility user experience and satisfaction, further stakeholder opinion and usage data post-implementation is to be continuously monitored.
Sustainability Considerations in Design
E-scooters are small scale rechargeable electronic devices that are designed to leave a smaller carbon footprint on the planet compared to traditional methods of transportation. To compare electric alternatives with traditional methods, the value of emissions is distributed over a measured distance. A typical branded model emits around 60.75 grams of CO2 equivalent per passenger kilometer (gCO2e/km) as reported in its Life Cycle Assessment (LCA) [1]. In comparison, traditional methods such as car ride service vehicles emit anywhere from 344-469 gCO2/pmt. E-scooters release at least 6 times less carbon emissions when compared to private vehicles. Carbon emissions from micro-mobility devices come from the manufacturing process or while charging, as 87% of electricity generated in Calgary is sourced from the burning of coal or natural gas [2]. There are no direct chlorofluorocarbon emissions associated with scooter distance traveled. E-Scooters are also recycled at the end of their lifespan, thus reducing landfill waste.
From the City of Calgary survey data, 55% of scooter users would have walked to their destination, and about 40% of users would have traveled in a fuel burning vehicle, including private car, transit, or ride share [3]. Data-based recommendations play a role in creating a more sustainable mobility network. Recommending optimum, designated parking locations can reduce complaints about micro-mobility parking and usage, while making the devices more accessible for potential users. Additional linkage recommendations improve upon the existing mobility network and increase access to popular areas within the city. Finally, the existence of a summertime network can connect riders to seasonal attractions, local businesses, and promote a healthier lifestyle while minimizing negative environmental impacts.
This project examined underlying data trends within micro-mobility usage and used key takeaways to make engineering recommendations to improve the existing mobility network. These parking, linkage, and safety recommendations may increase the appeal of micro-mobility to a wider audience and promote modes of transportation with a lower carbon footprint. This project paves a new path for sustainable mobility in urban cities and encourages new perspectives on mobility in the future.
References
[1] “Life Cycle Analysis Reveals Vast CO2 Emissions Gap Between Cars and Scooters.” Bird Cities Blog. Web Address: https://www.bird.co/blog/life-cycle-analysis-co2-emissions-gap-between-cars-scooters/ (Accessed April 5, 2021)
[2] “The Main Electricity Sources in Canada by Province.” Energyrates.ca. Web Address: https://energyrates.ca/the-main-electricity-sources-in-canada-by-province/
[3] A. Sedor and N. Carswell. “Shared electric scooter pilot.” City of Calgary. Web Address: https://www.calgary.ca/transportation/tp/cycling/cycling-strategy/shared-electric-scooter-pilot.html
The Team


Our Advisors
We would like to graciously thank our Academic Advisor, Dr. Farnaz Sadeghpour, as well as our two Industry Advisors, Andrew Sedor and Monique Castonguay, from the City of Calgary. All of our advisors encouraged us to be curious, dig deeper, and strive for excellence in our work. They offered valuable advice and guidance throughout the course of our project. We thank you!

University of Calgary

The City of Calgary

The City of Calgary
