Project Category: Civil
Join Our Zoom Q&A
About Our Project
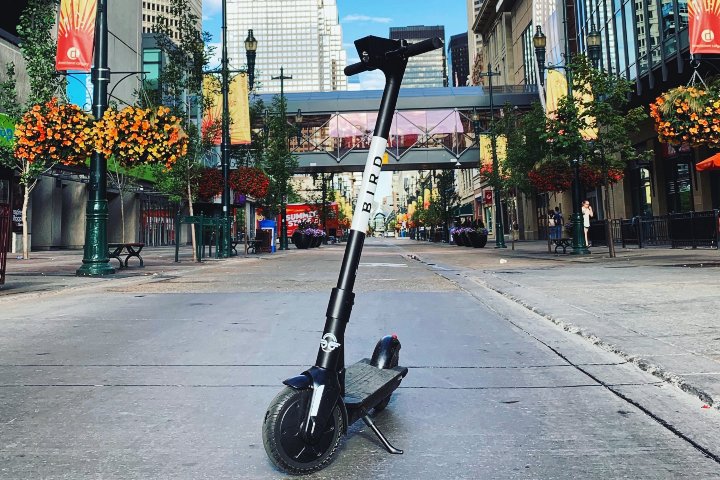
In July 2018, the City of Calgary introduced a 16-month shared e-Scooter and micro-mobility pilot program in the streets of Calgary. As of January 2021, the return of privately-operated e-Scooters has been approved by the City of Calgary.
Throughout the course of the pilot, various user-data was collected via user surveys, citizen queries, and GIS tracking systems, which now need to be analyzed and presented in an understandable manner in order to help make meaningful conclusions about the viability of e-Scooters as a long-term transportation mode in Calgary.
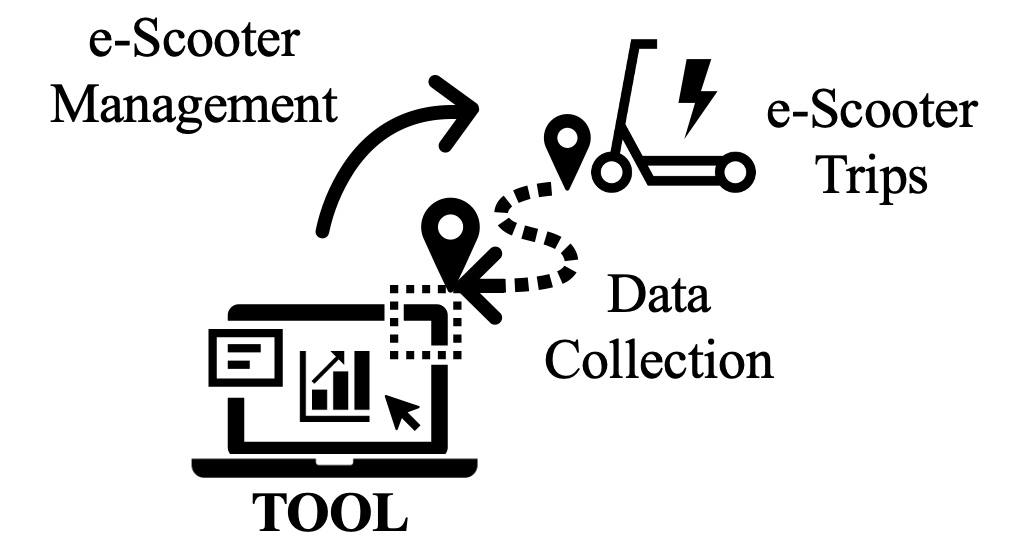
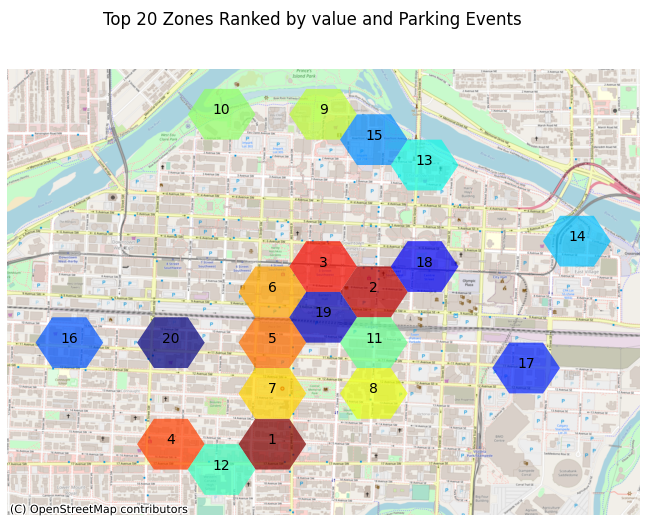
Our project involved creating a data analysis tool to help inform and defend recommendations to the City of Calgary regarding e-Scooter use and management. The findings of the data analysis program, TOOL, will be used to provide recommendations to the City of Calgary on the future of e-Scooters in Calgary. With the tool, the user may measure the success of the initial pilot program and determine if it is a worthy investment to maintain this transportation mode in the future. A recommended parking map will also be generated along with 4 alternative maps based on each category: general, community, safety, and environment.
Recommendations may also include parking solutions, route connectivity, and temporary infrastructure placement based on the case studies selected to analyze.
Details About Our Design
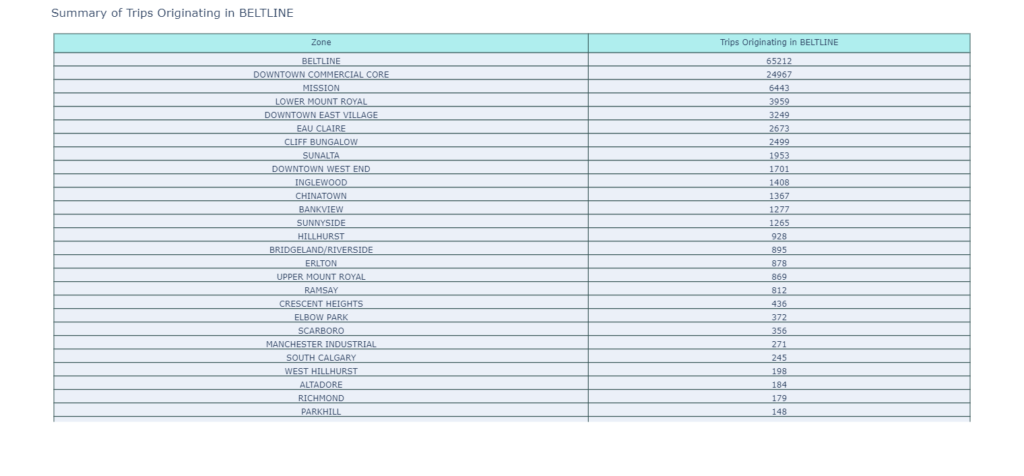
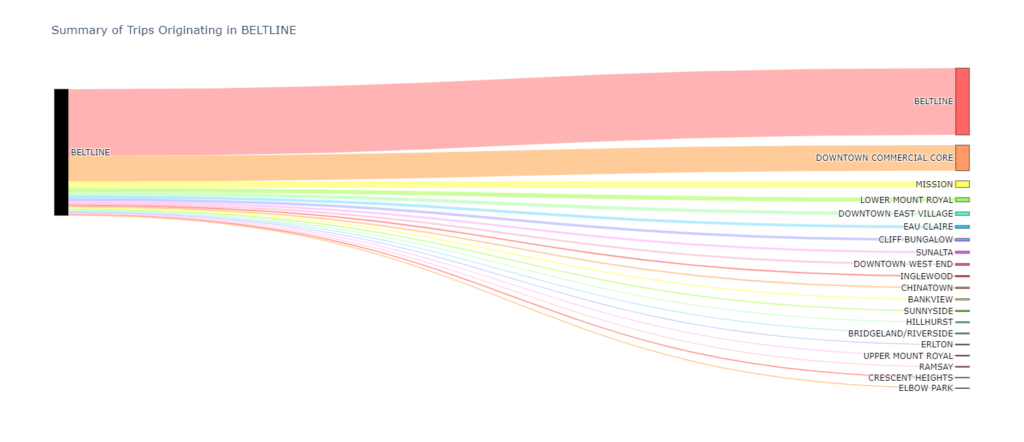
Coded completely from scratch in Python, TOOL is the first program that was created to directly cater towards the analysis of the City of Calgary’s e-scooter data. TOOL is a fully functioning data analysis program which has the ability to conduct four different types of analysis:
- Tabular Analysis – “Table Summary”
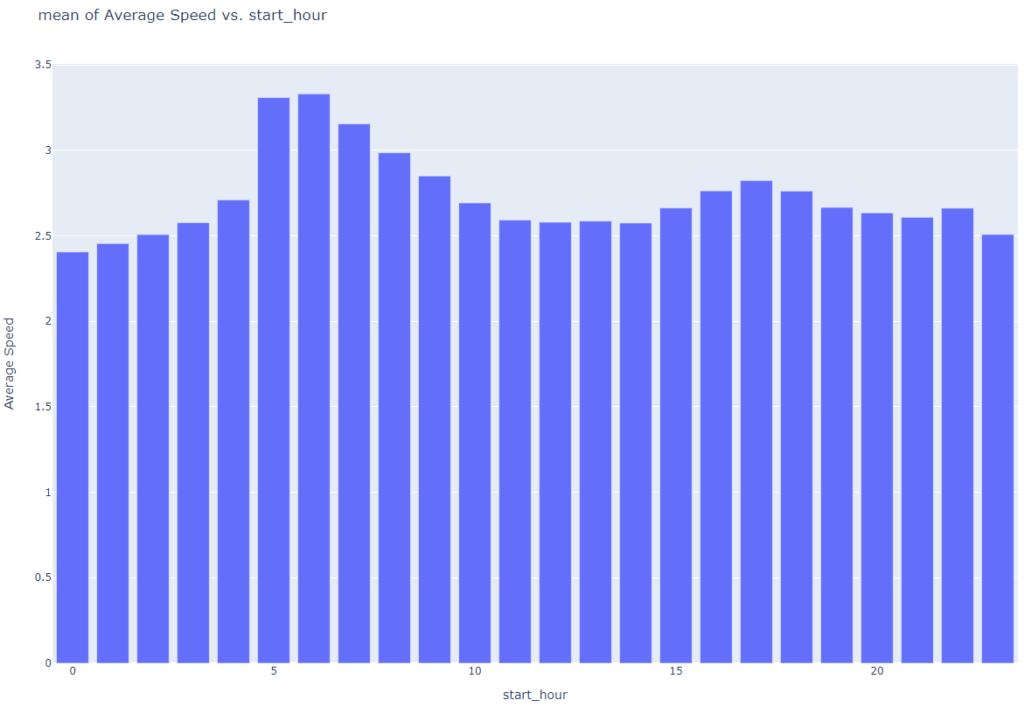
- Graphical Analysis – “Graphical Summary”
- Origin-Destination Analysis – “O-D Analysis”
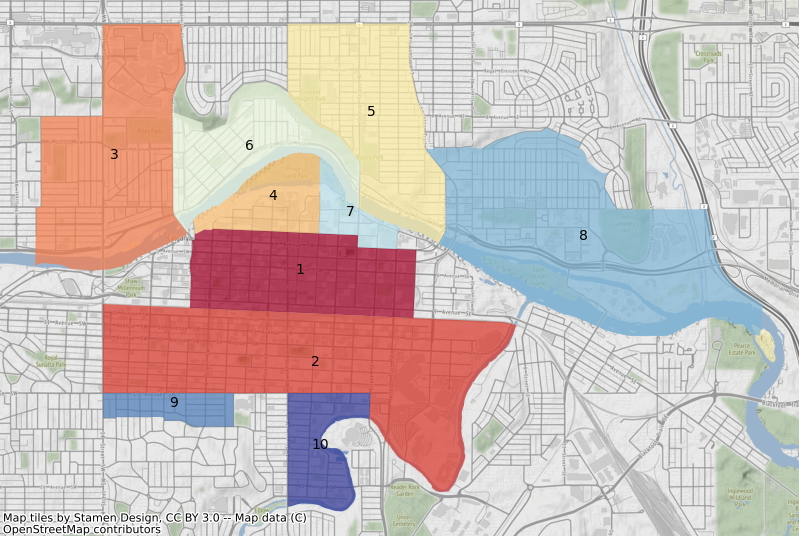
- Geographical Zone Comparison Analysis – “Compare Zones”
HOW OUR DESIGN ADDRESSES PRACTICAL ISSUES


With the rapid trend of mobile devices and applications incorporating into our daily lives, the ability to generate and collect customer-data has become a common activity for many businesses. Understanding what that data actually means through data analytics has enabled businesses to make more informed and objective decisions that lead to higher productivity and more efficient operations.
TOOL can be used to address the e-Scooter management problems proposed by the City of Calgary industry advisors by analyzing the data collected during the pilot program. One of the problems addressed was e-Scooter parking, or “Share n’ Go zones”, and where they should be implemented to promote better parking practices by e-Scooter users based on a variety of factors. After thorough evaluation of geospatial data, a set of recommended locations for Share n’ Go zones was provided to the City of Calgary.
Other practical issues identified in the e-Scooter Pilot Program Final Report, such as user-behaviour and safety-related concerns, can be addressed using the objective insight provided by TOOL.
WHAT MAKES OUR DESIGN INNOVATIVE
As one of the first North American cities to embrace e-Bike and e-Scooter pilot programs, the City of Calgary is a leader in emerging micro-mobility devices. TOOL’s design may be one of the first of its kind specifically programmed to process and summarize large sets of mobility data.
TOOL has been designed to accept individual or multiple input files in various formats, including .csv, .shp, .geoJSON, and .xlsx, which enables the user to easily mix and match data from different sources. This feature future-proofs the design, as files taken from open source are subject to change and update periodically. TOOL also has the unique ability to link geospatial data, quantitative and qualitative datasets can be easily compared and used together to paint a more accurate picture than if you were simply analyzing each separately.
TOOL also has an in-depth user manual with a step-by-step explanation for each function along with screenshots directly from the code for enhanced clarity.


WHAT MAKES OUR DESIGN SOLUTION EFFECTIVE



TOOL is very convenient and simple to use. The tool also has many embedded functions to optimize user friendliness and experience.
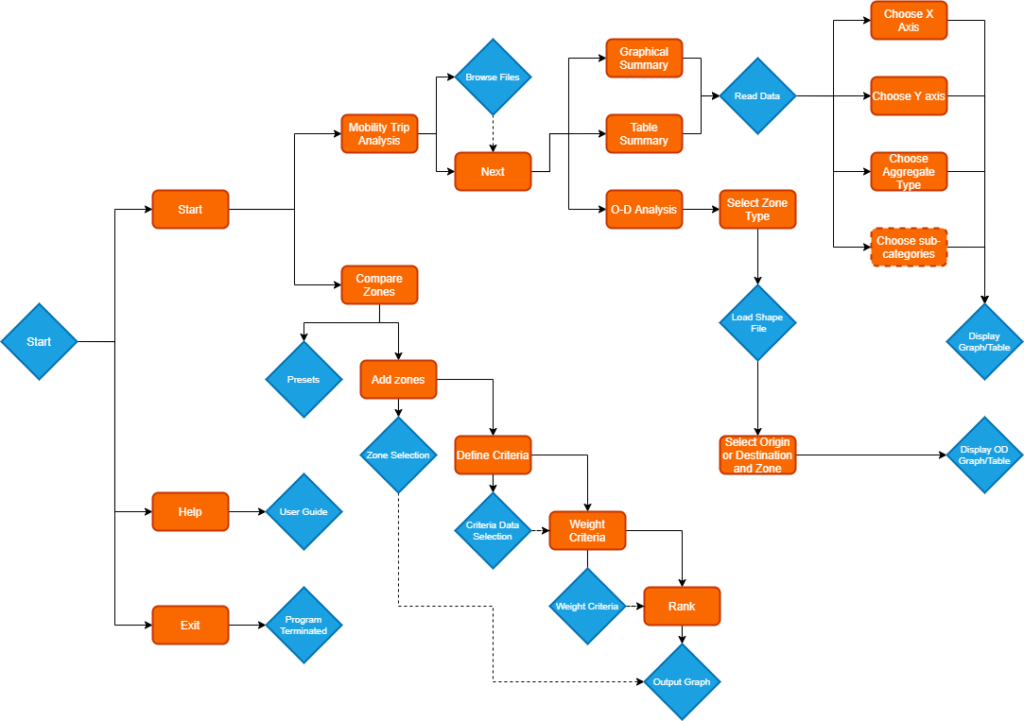
The tool takes the user from start to finish in an organized and logical process with a start page and separate pages for the analysis functions. Category and sub-category selection for the tabular and graphical analyses enables the user to drill-down and focus on the relevant data effortlessly.
We have also introduced “Preset” options on the Compare Zones and Graphical Summary functions, which produce pre-determined data summaries we have already found to be useful. Preset options expediate the analysis process, and can be performed periodically as data sets change over time.
In addition, we have added drop-down menus for ease of use and the titles and text on the buttons take out any second-guessing on how to use the program. The “help” and “exit” buttons are also available on each page in case the user is lost or require assistance.
HOW WE VALIDATED OUR DESIGN SOLUTION
Throughout the coding process of TOOL, troubleshooting was completed in an iterative process.
Python has automatic debugging that tells us where and what was the issue in our code if there was one, this enabled us to produce a bug-free code each iteration, thus allowing our final program to run smoothly without errors.
Additionally, tables, graphs, and comparison matrices generated through TOOL were compared to figures produced manually and with other analysis tools to validate the functionality of TOOL and to ensure accuracy with our program.


FEASIBILITY OF OUR DESIGN SOLUTION


With all the required Python add-ins included directly in the code, new users can get started with a simple download at no cost. The built-in TOOL user manual provides easy to understand instructions for a stress- and hassle-free analysis experience for users at all skill levels.
As technology and trends evolve, it is important that the design remains applicable and useful to suit the user’s needs. This was ensured by making TOOL adaptable based on user input. Functions such as creating tables, graphs, and decision matrices will receive the user’s criteria, unique to their own problem definition. Therefore, the tool is not only valuable to the City of Calgary in the present, but can be valuable to Calgary in the future, where the city’s problems may be vastly different. Additionally, it may be adopted by different cities as they embrace and develop their own micro-mobility programs.
TOOL’s Workflow Schematic
Meet Our Team Members





Marion Brown | Susan Chen | Hayden Grotkowski | Adina Mah | Momin Muhammed | Anna Tyan | Errolle Ubalde
Partners and Mentors
We want to thank the many people who helped us with this project. Our civil engineering professor Dr. Farnaz Sadeghpour guided us through the process with insightful advice and encouraging support. We would also like to thank our consultation with our City of Calgary, Livable Streets advisors, Andrew Sedor and Monique Castonguay, who challenged us to address a diverse range of applications with our project.
