Project Category: Electrical
Join Us on April 5th From 10:00 am – 12:30 pm in the Engineering Building at Table 12
About Our Project
We are Farm Overheating Detection System or FODS for short. The current problem is that fires are being caused by overheating farm equipment. For example, the dry wheat on the hot equipment will ignite and cause a loss of expensive farm equipment, loss of income, and the potential for a loss of life. These fires can cause over $20 million in property losses in addition to lost time and downed crops during the busy harvest season [1]. Each year upwards of 40 injuries and 1 death is caused by equipment fires [1]. Early detection of these ignition points on farm equipment can help prevent these devastating fires. The current solution requires farmers to manually detect hot spots using heat-sensing cameras or thermal sensors and pay special attention to the cleanliness of their equipment. The problem with this solution is that farmers may forget to check their equipment at the end of the day, which leads to hot spots igniting during the night.
The objective of our project is to alert farmers of dangerous heat levels before a fire starts. FODS is partnered with Aurora Wireless Networks (AWN) to implement our thermal detection system with their MLink technology. Thermal detection sensors will be deployed on farm equipment to detect overheating. Farmers will be notified through a push notification if their farm equipment thermal level exceeds the safe operating threshold. Through our easy-to-use thermal detection system, we plan to reduce the loss of farm equipment due to the ignition of dry material on hot equipment. Our project aims to automate and streamline the heat detection process.
HOW OUR DESIGN ADDRESSES PRACTICAL ISSUES
The current issue is that fires are being caused by overheating farm equipment. The solution to address this issue is to detect the overheating before the ignition point is reached in which a fire is caused. Details on how our system operates can be found in our Design Overview section.
WHAT MAKES OUR DESIGN INNOVATIVE
Farm fires are not ideal and are a farmer’s worst nightmare. Through our extensive research, we found that most farm fires start because of overheating farm equipment. However, there was not a proper working solution to this problem until now. Our design provides an affordable, expandable, and easy-to-use system to help detect farm equipment temperatures and notify farmers of their overheating equipment.
WHAT MAKES OUR DESIGN SOLUTION EFFECTIVE
Our design solution successfully helps to detect rising temperatures on many types of farm equipment. It can successfully inform the farmer through a mobile app about these rising temperatures wherever they are. Therefore, this system gives the farmer a chance to react to their overheating farm equipment before it starts a farm fire.
HOW WE VALIDATED OUR DESIGN SOLUTION
Throughout the design process, several tests were performed. The first major tests were to check the accuracy of all the data collected by the thermal sensor module. The next tests were done to confirm if all the data was being transmitted by the thermal sensor module and were received successfully by the base station. Then, tests were done to confirm if the data received were successfully stored in the Amazon Web Services (AWS) database. Lastly, tests were done to make sure the app designed for the system was pulling the data in the AWS database correctly. Two field tests at WA Ranches were conducted to test our entire system by putting it through a real-life scenario. More detailed descriptions of our tests can be found in the Design Overview section.
FEASIBILITY OF OUR DESIGN SOLUTION
As demonstrated in the Feasibility section, the design is a minimal cost solution to avoiding devastating farm equipment fires.
Design Overview
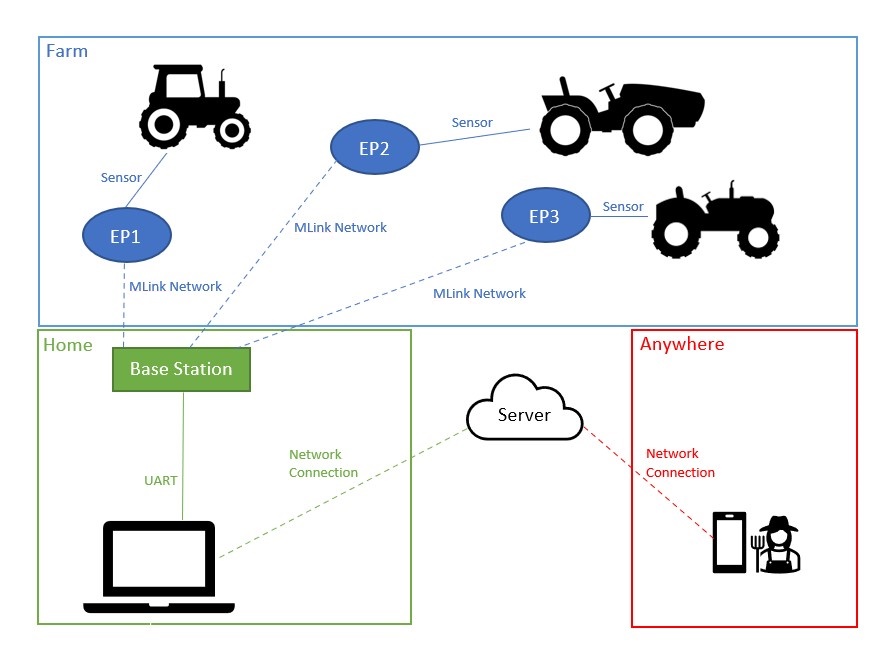
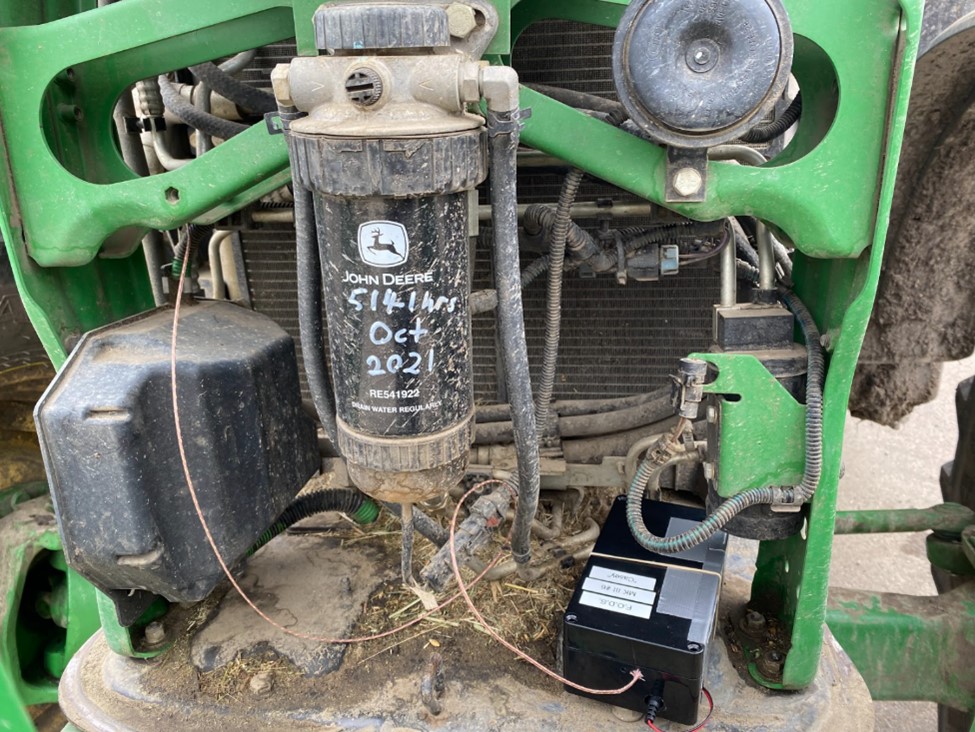
FODS will be implemented using a network of internet-of-things (IoT) devices based on the MLink system, developed by Aurora Wireless Networks (AWN). A series of MLink endpoints (transmitters) will be integrated on a PCB, alongside thermal sensors for deployment on farm equipment. The thermal sensor module will be directly mounted onto the machines. The thermocouple wire is able to extend beyond the module to reach the main hot spots of the engine within the farm equipment.
The thermal sensors will communicate with a single base station located in the home of the farmer. The MLink base is the point of communication between the MLink endpoint on the thermal modules. The base will be responsible for polling each endpoint for data at a fixed interval for temperature, battery charge, and GPS data. A simple client app running on a desktop computer will communicate with the MLink base over UART, gather the aggregated data from the base, and upload it to a web server.
A phone application will communicate with the webserver, allowing the user to track the status of all sensors in the network, or be alerted (via a push notification) about any temperatures that exceed user-configurable warning or critical alert thresholds (the app will default to a threshold temperature of 204 °C [2]).
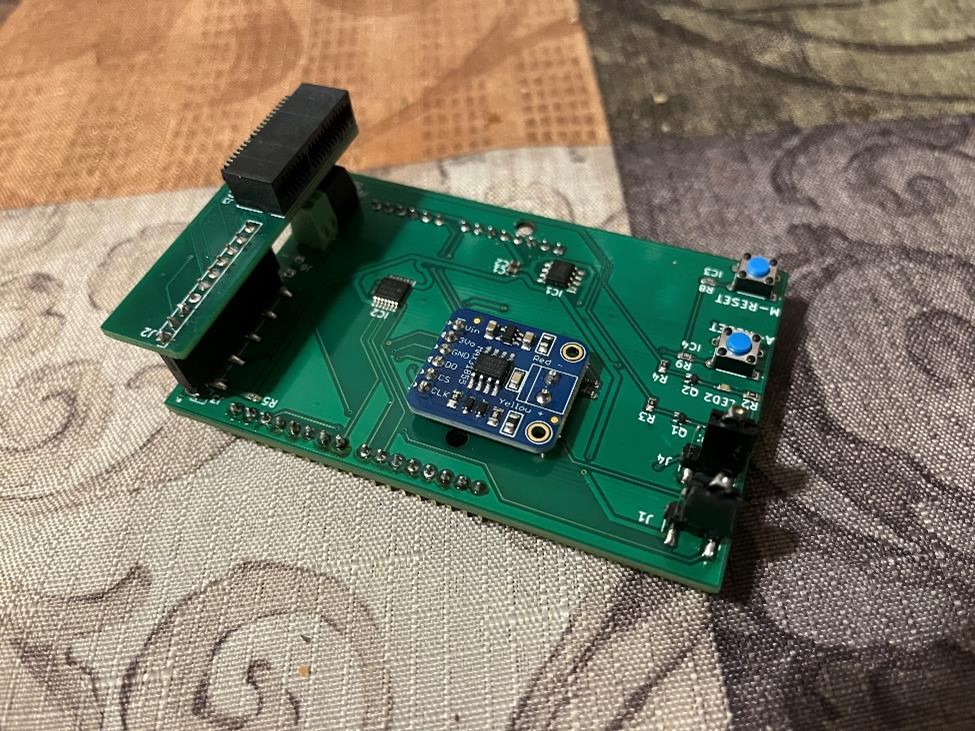
Thermal Sensor Module
The thermal sensor module consists of three main components: MLink Endpoint, Arduino Uno, and an Adafruit Thermocouple.
A thermocouple of Type-K glass braided and insulated wire was selected as it can withstand temperatures up to 500 °C [5]. The thermocouple amplifier (MAX31855) was selected as the device that relays the temperature data to the Arduino Uno.
The Arduino Uno is the link between the temperature readings from the thermocouple and the long-range wireless communication of the MLink endpoint. The Uno will read temperature data, package it, and send it to the MLink endpoint via a UART connection.
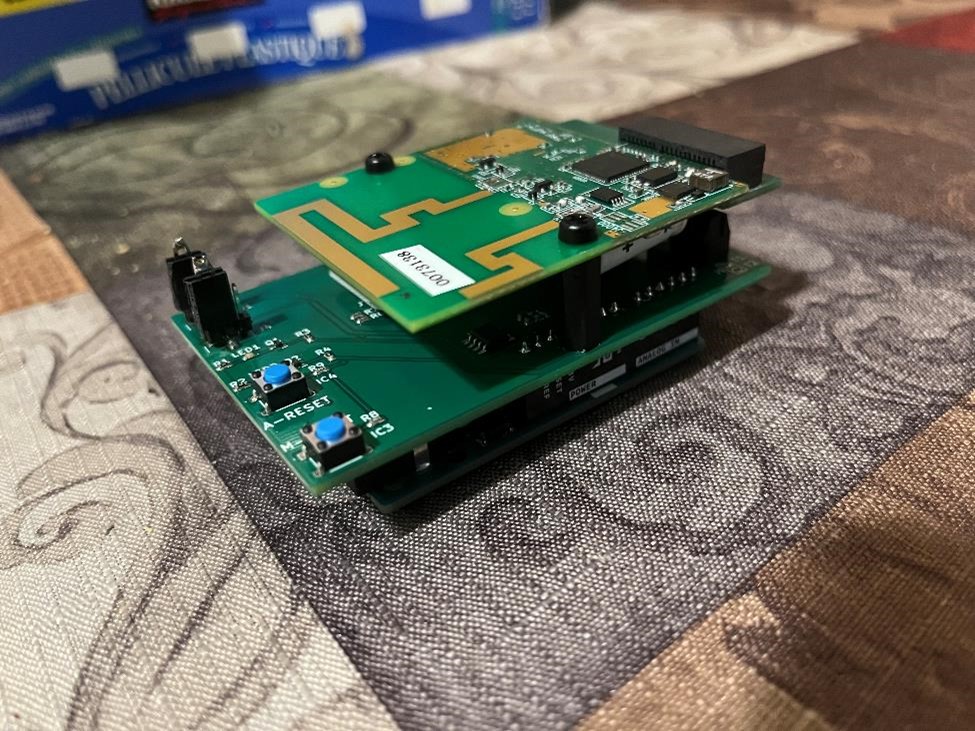
The MLink endpoint is the long-distance communication from the thermal module attached to the farm equipment and the base station. The communication between the MLink endpoint and MLink base is over a radio frequency also known as the “MLink Network”. Communication over the MLink Network can reach distances of approximately 1 km.
The thermal sensor module will be communicating three main packets of data to the base station. Firstly, the temperature that was recorded on the farm equipment by the thermocouple. Secondly, the GPS data. The GPS module is a part of the MLink endpoint. The GPS will allow farmers to know the approximate location of their machine in case an emergency arises. Thirdly, battery information will be relayed back to the base station. This way the farmer is able to tell when the battery is getting low and promptly change it for continued use.
The battery value is measured using a voltage divider to acquire a voltage that can be read using 1Mohm resistors to reduce current leakage and power loss. This reduced voltage is measured by the Arduino analog pin and compared to the battery voltage drop data we acquired using a constant current load of 100mA. By comparing these two sources of information we can determine if the battery has a high, medium, or low amount of power remaining, and send an alert in the app to change the battery when it gets low.
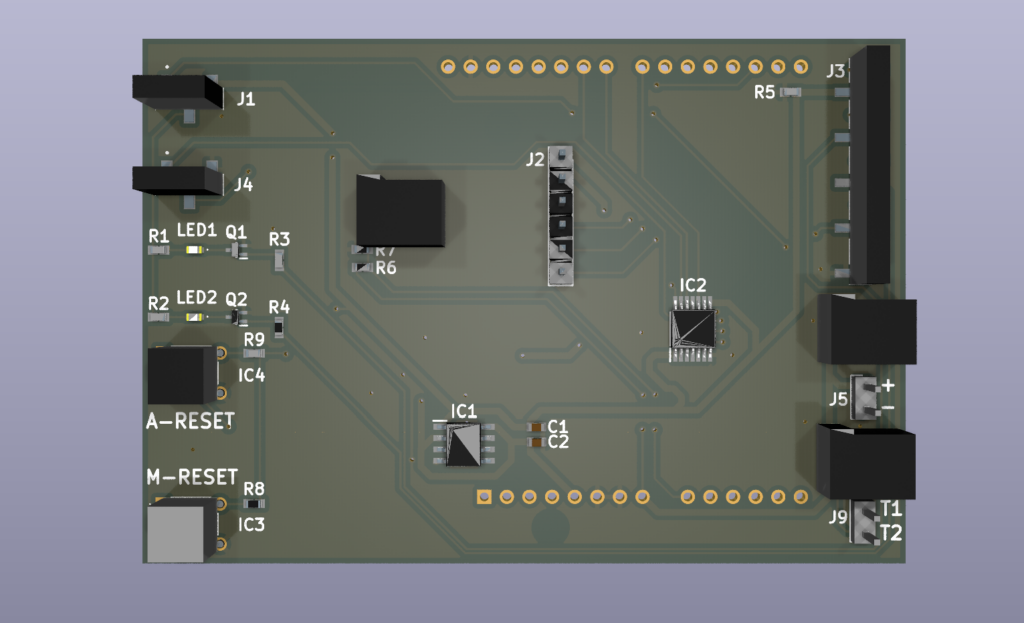
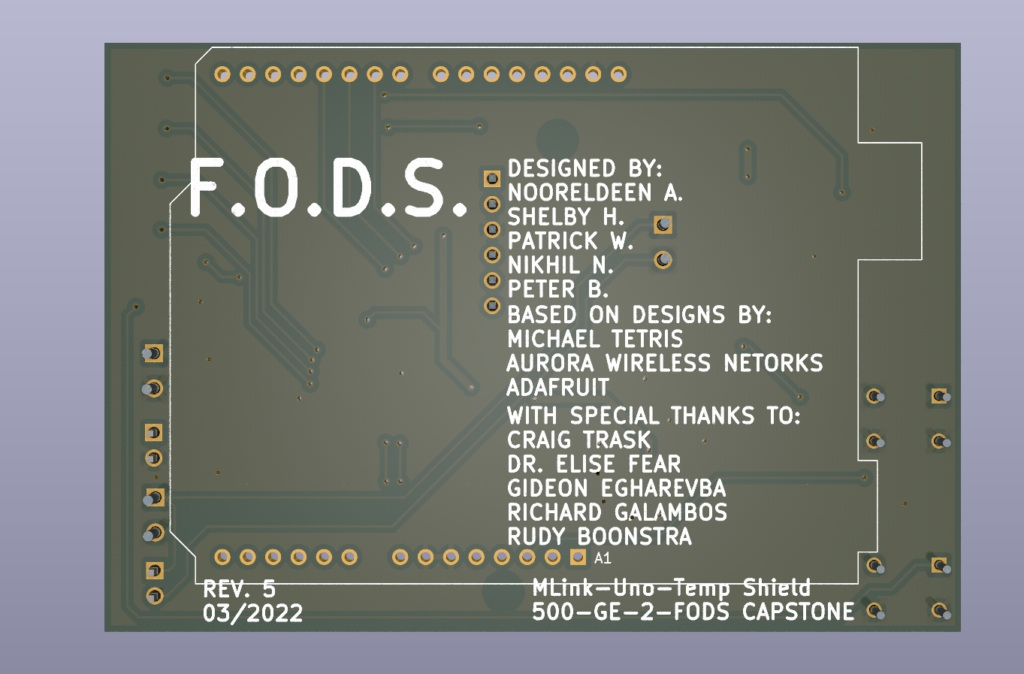
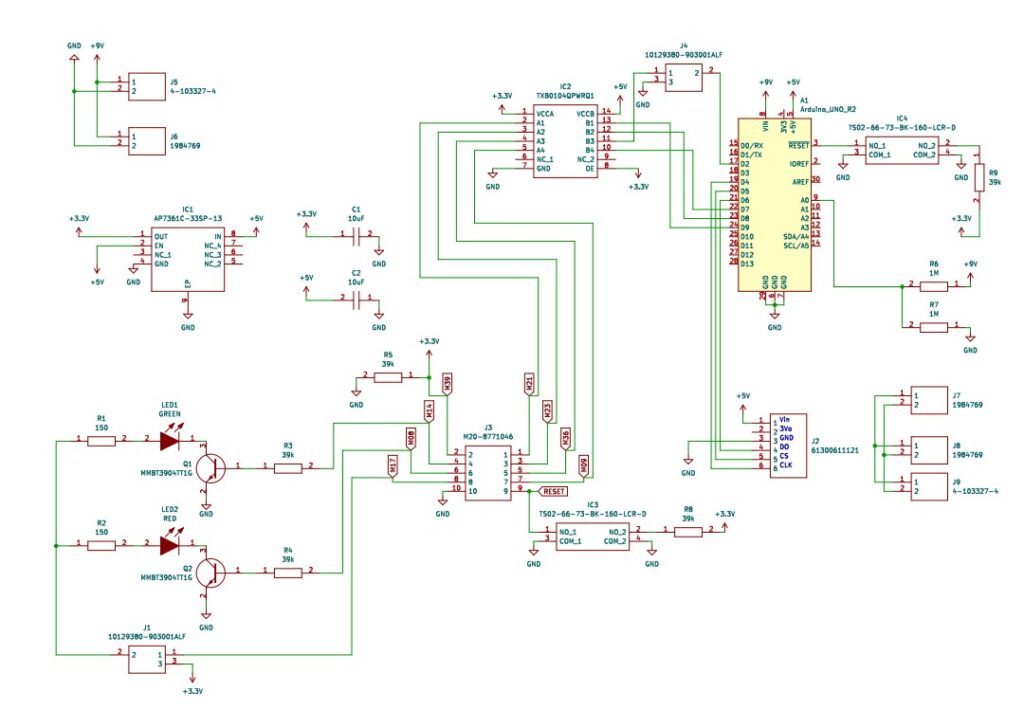
Thermal Sensor Module Schematic
Base Station
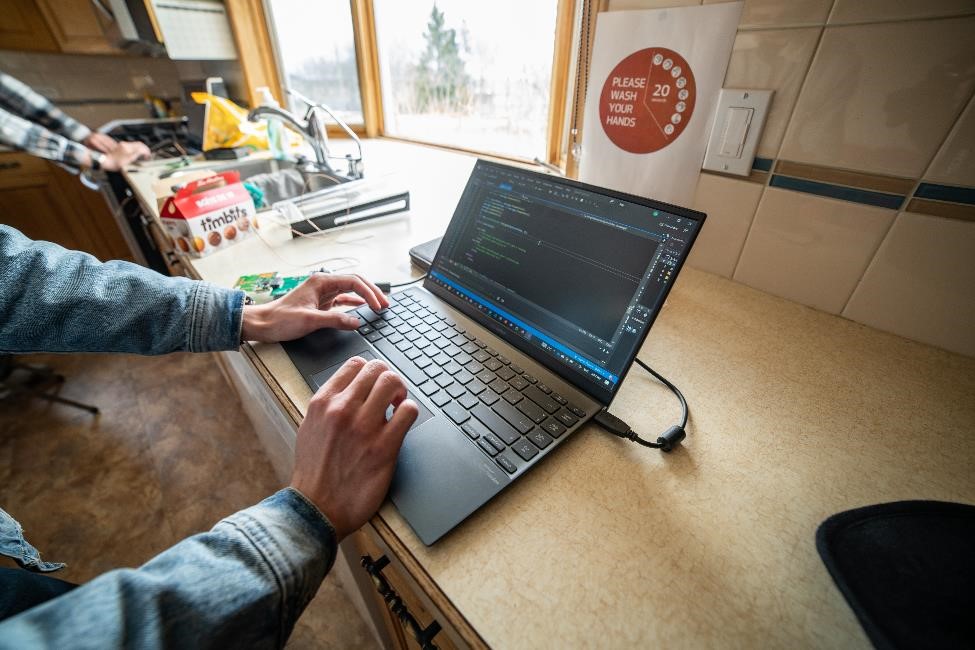
The base station will reside in the house of the farmer. There are two main components required to operate the base station, a computer, and an MLink base. The computer will be connected to the WiFi within the house of the farmer. A desktop app that was created using C# will be running on the computer continuously.
This app has two very important tasks. The first task is to collect and decode all the data that is being received by the MLink base which is connected to the computer’s UART through USB. The app’s second task is to make a connection with the MySQL database hosted on AWS and store the recently received decoded data in a specific table in the database.
Mobile Application
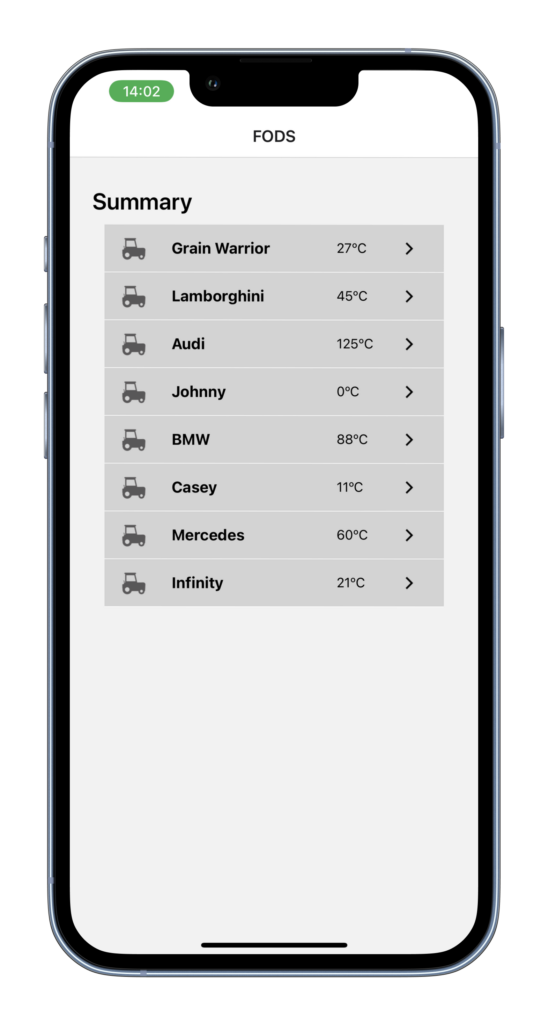
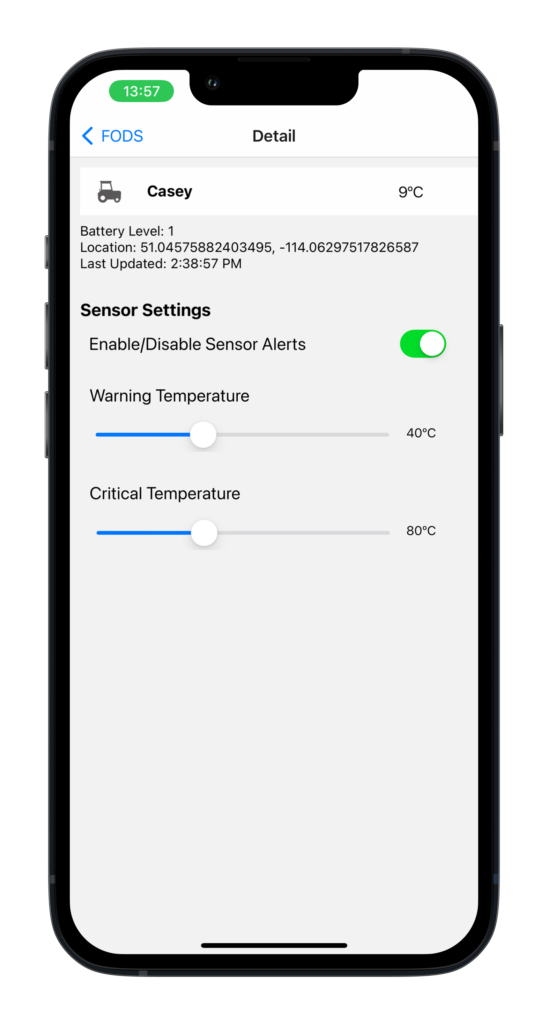
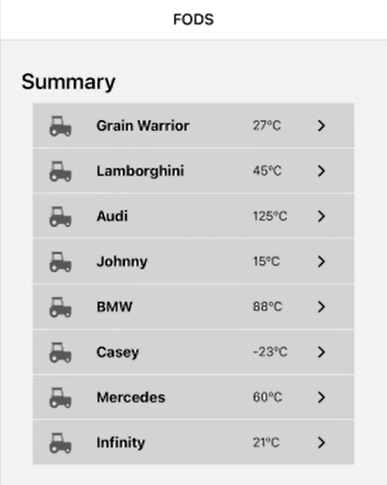
A mobile app will be created with React Native for iOS and Android interoperability. The purpose of the app will be to send database get requests to the webserver at a predetermined time interval, providing the user with a snapshot of all temperature, location, and battery data in their FODS network. The user will be able to view all temperatures at a glance on a summary page, and manually set warning and critical alert thresholds for each connected sensor. If either of these thresholds is exceeded, a mobile push notification is sent to the user’s device. This push notification identifies the sensor that generated the alert by name (assigned by the user), whether the warning or critical threshold was exceeded, and the GPS location of the sensor.
Housing
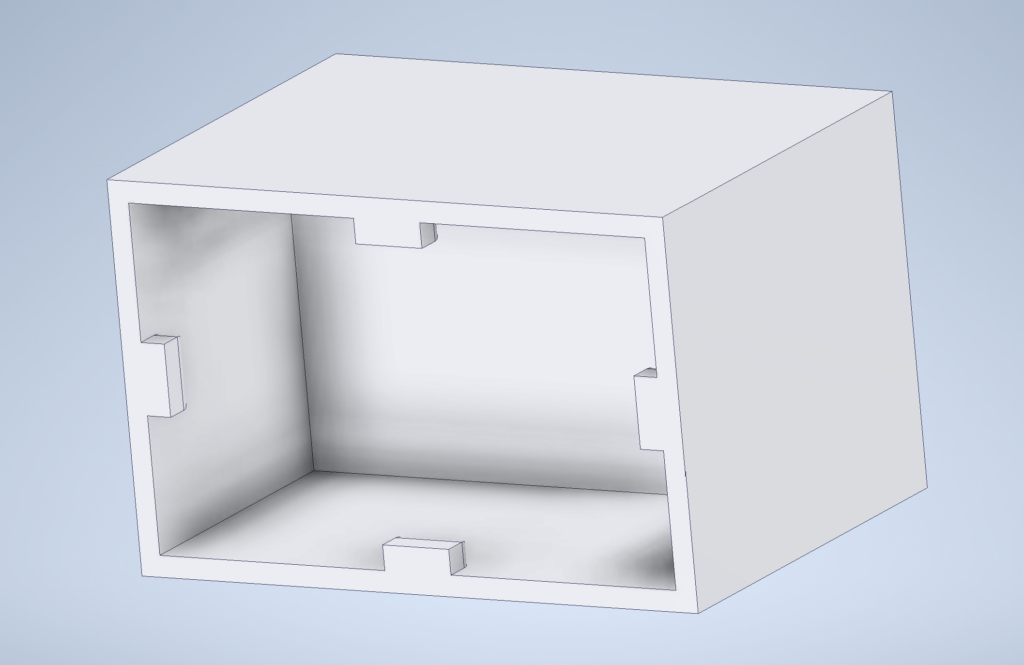
The housing was printed using PLA and was modeled using Autodesk Inventor. It was precisely designed to fit around the custom PCBs and minimize wall thickness where possible to minimize interference with data transmission. The design allows for easy and convenient installation, maximizes water resistance, and ensures easy access for unlikely but possible repairs needed in the future.
Testing and Validation
Thermal Sensor Accuracy Tests
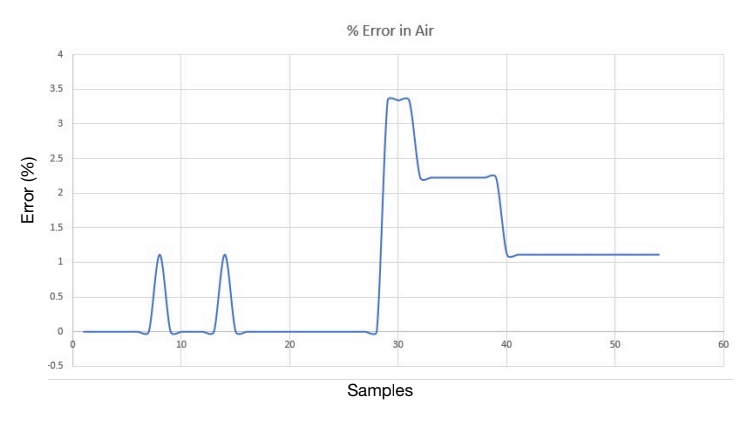
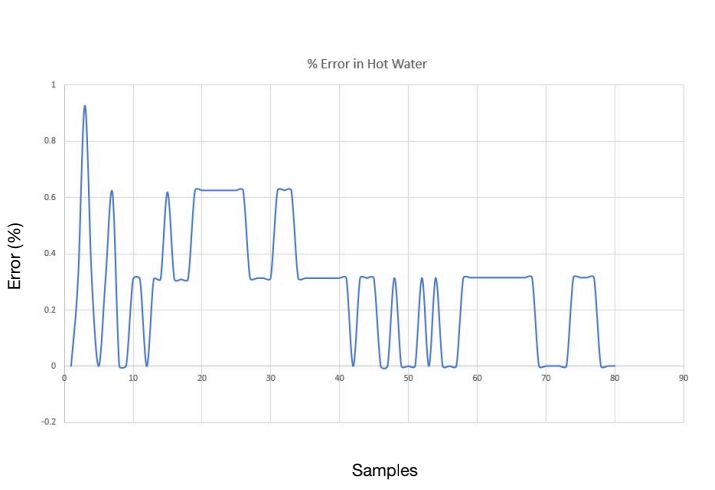
Testing the thermocouple involved writing test code, obtaining a thermometer with a small error rating, and breadboarding the connections between the Arduino to the thermocouple to achieve a functional setup. The process involved logging data from the Arduino, as well as the thermometer, and then comparing the results. The thermocouple data was collected while being in contact with ambient air, ice, and hot water. The final experimental error rating of the thermocouple was found to be about 0.3%.

Battery Life Tests
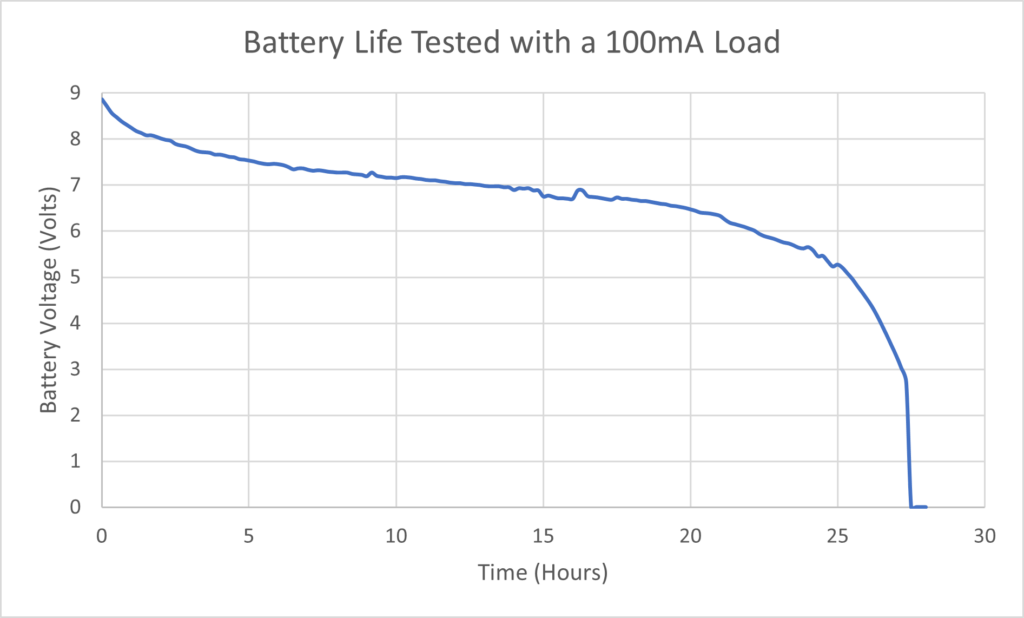
Based on the battery drainage test we know that our battery drops below 6V at 22 hours and 10 minutes (22.16667 hrs). This means our battery setup supplies 2216.67mAh. After measuring the average current draw of the system to be 137 mA we can calculate the expected battery life to be 16.18 hrs.
mAh = hrs * mA = 22.1667hrs * 100mA = 2,216.67mAh
Runtime = (Battery mAh) / (mA drawn by system) = 2,216.67mAh / 137mA = 16.18hrs
While this is far below our ideal setup we have some solutions that we believe will improve this. First, the Arduino Uno in use draws over 40mA. If replaced with an Arduino Pro Mini 3V we could reduce the current draw to 4mA at 3.3V which would improve battery life drastically. Additionally, by implementing sleep functions in the Arduino code we believe we could reduce the average current draw further. The other cause for the high current draw is the rapid updates that the MLink is transmitting. Currently, it is sending temperature updates every 5 seconds and battery updates every 20 seconds. The final area of research that would lead to improved runtime would be the batteries that we are using and the configuration.
Database Validation Tests
The database tests performed were to ensure two important goals. The first goal is to ensure the mobile application is able to connect to the database and hold that database connection successfully. To test this objective, we left the system running overnight a few times, and at all times the system was successful in holding the database connection throughout the whole test period.
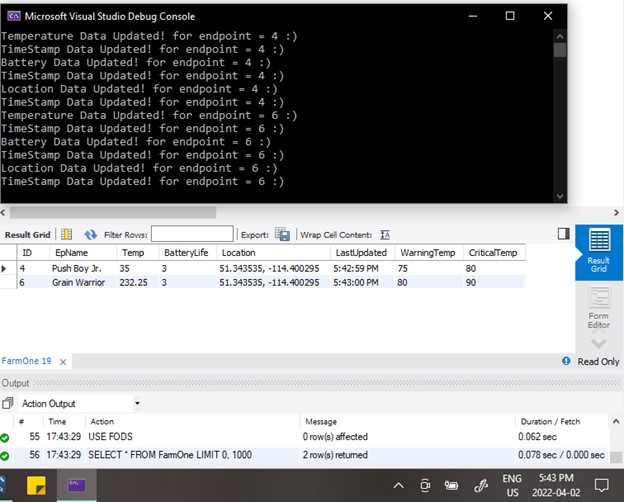
The second goal was to ensure the web app was able to successfully communicate with the database and to store all the data correctly in the table set up on the MySQL database which is run using AWS. Two types of similar tests were done to check this objective, one with dummy data and the other with real-time data. All of this data was sent to the database using the mobile application. To confirm that all the data was stored properly in the database, MySQL workbench was used to display the table, and timestamps were used for each row, to see when every row was last updated.
These tests were done at various locations including but not limited to the University of Calgary, at team members’ houses, and at WA Ranches.
Mobile Application Tests
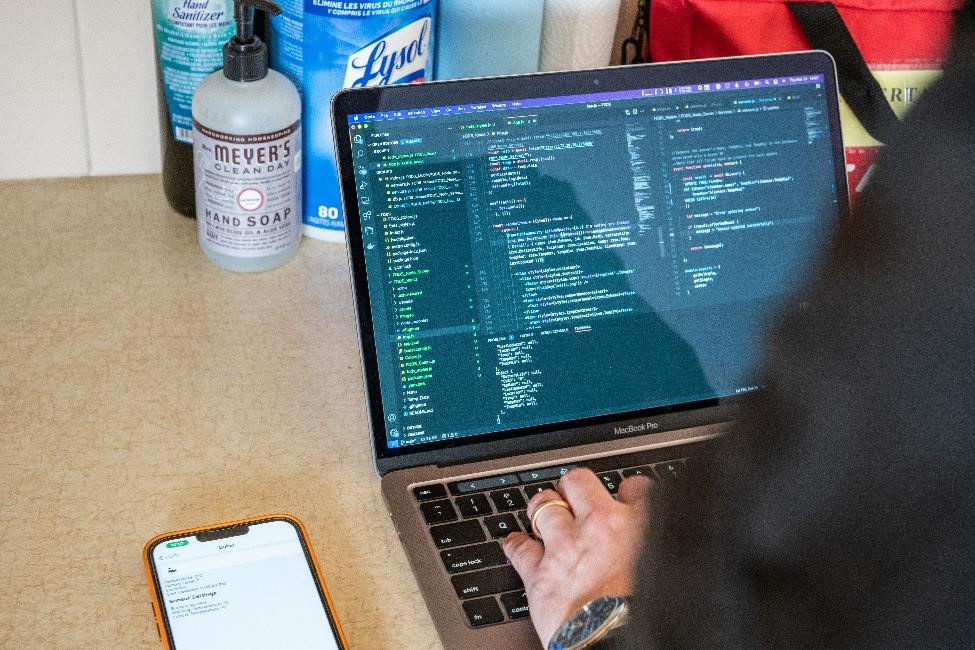
The mobile app consists of two basic components – the React Native front-end component, and the Node.js server retrieving data from the AWS database and serving it to the React Native front-end. The FODS React Native app was tested on an ongoing basis during development to ensure that the user interface responds as expected, animations were smooth, and data was loaded correctly.
Initial testing included simply loading the AWS database with dummy data and confirming that this could be retrieved with the Node.js server. Thereafter, once the Node.js server had been connected to the front-end, testing was performed to verify that the full list of sensors (populated with dummy data) was visible within the app’s Summary and Detail views.
Finally, the testing performed at WA Farms confirmed that live updating data was reliably reflected in the app. During the first round of testing, some reliability errors were discovered when the server was connecting to the database. However, this was mitigated during further testing by limiting the number of connections to the AWS database.
Housing Tests
The housing prototype has been through many iterations as shown below.
Initially, it was an electronics hobbyist box to maximize water resistance and protect internal components. Unfortunately, this option had some sizing issues, made preliminary troubleshooting difficult, and may have led to some interference with the transmission of data from the thermal sensor module to the base station.
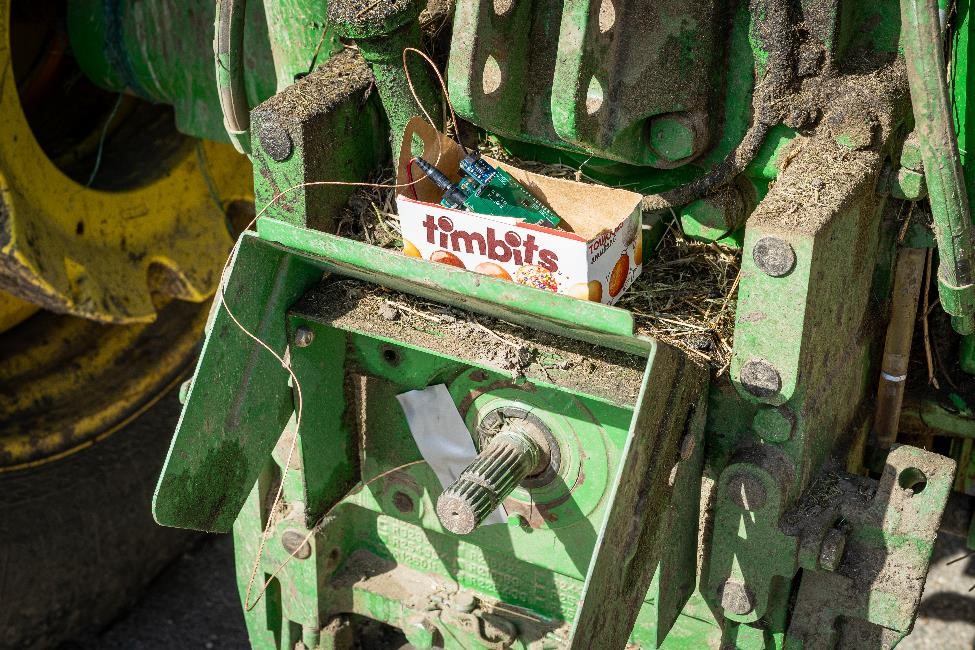
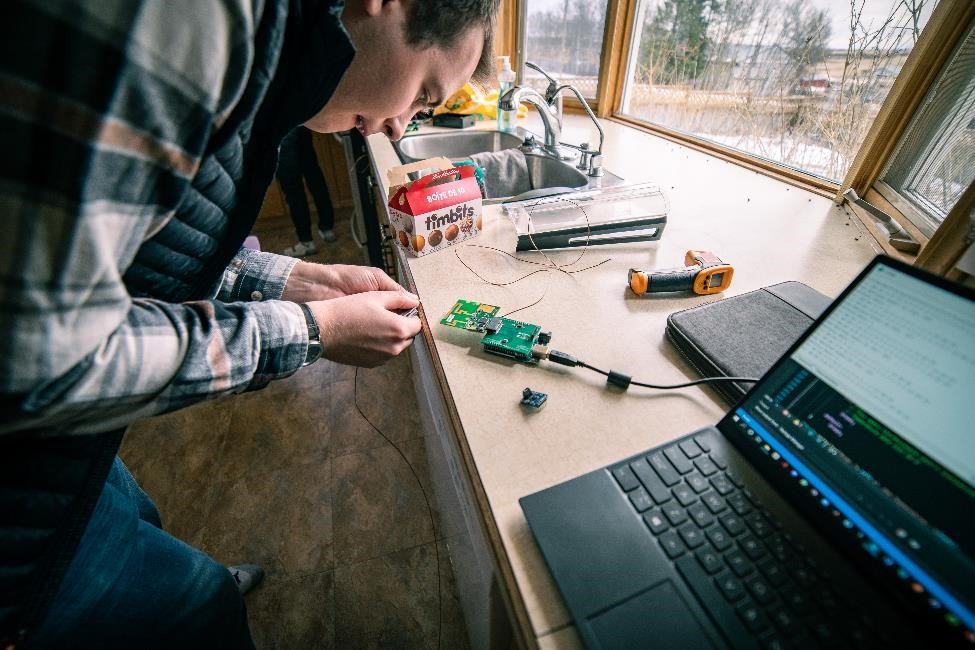
In order to have a quick testing turnaround, an improvised housing was used based on a Tim Hortons Timbit container. It provided the minimum amount of protection of components required for field testing. However, it served its purpose of not interfering with the thermal sensor module and base station signals as well as keeping the components compact and ready to be attached to the tractor.
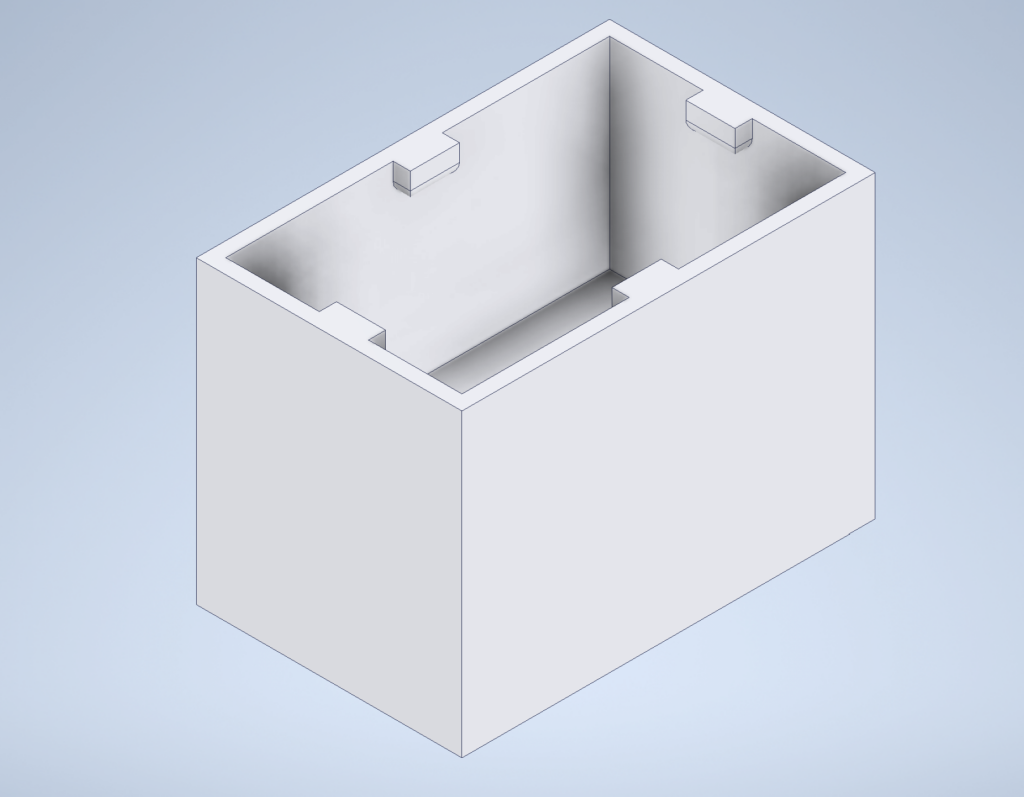
The final house was carefully designed to fit the components of our thermal sensor module. More details about the final case are highlighted in the housing section.
Field Tests
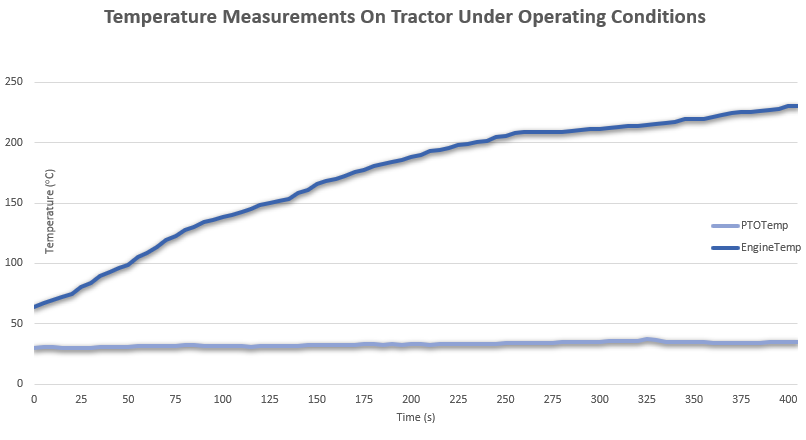
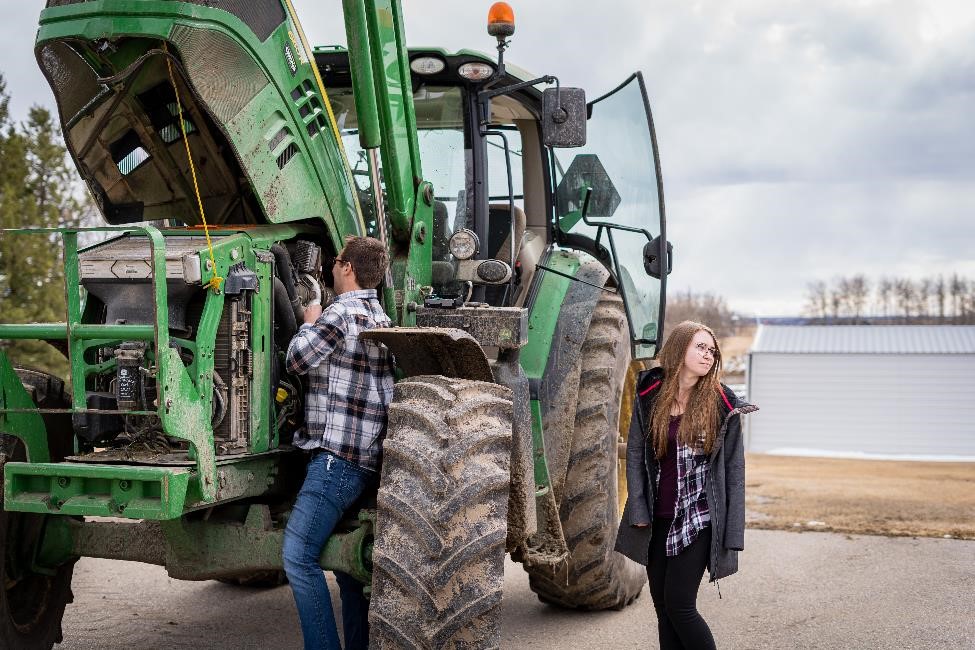
All of the field tests were conducted at WA Ranches. We wanted to simulate how our prototype would respond in the field under real operating conditions.
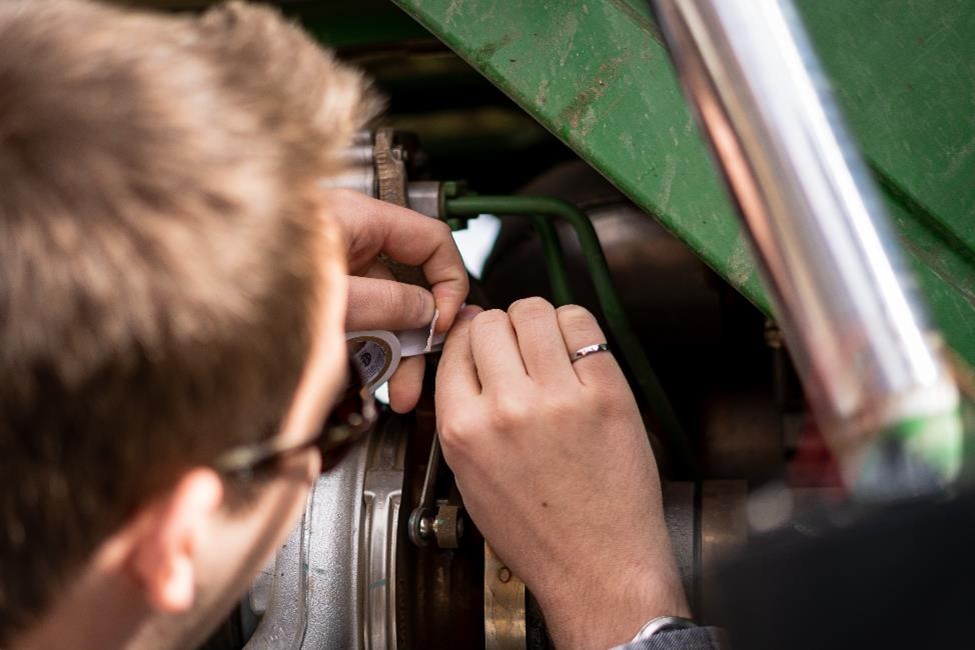
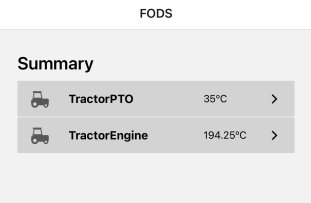
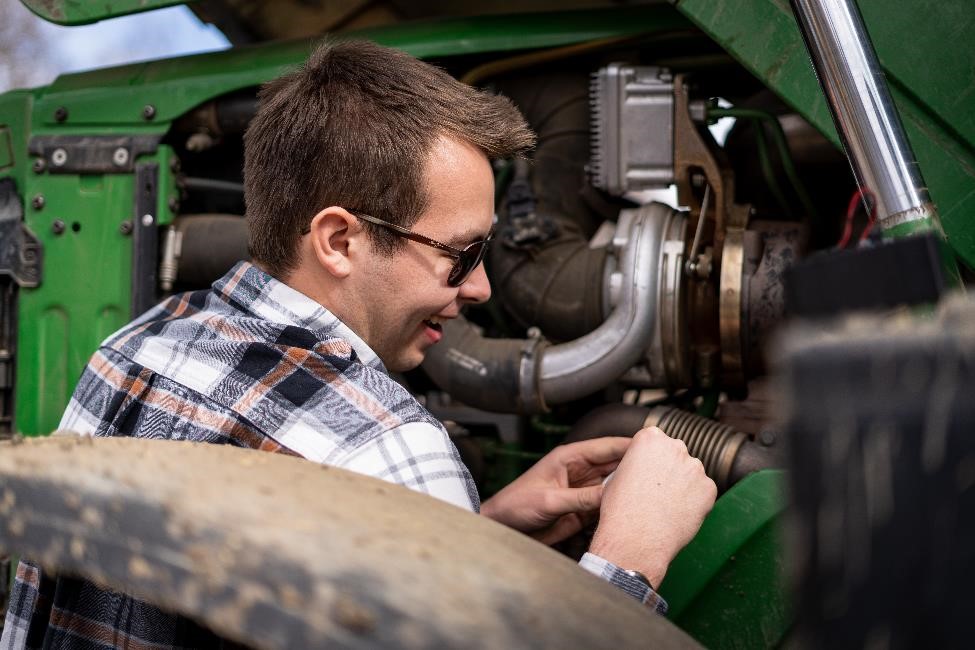
We started by carefully installing the thermal sensor modules onto the tractor. A thermal sensor module was installed on the PTO while another was installed on the engine of the tractor. Advice from Jonny Bennet – Ranch Manager at WA Ranch – indicated that these two spots are the hottest running on the tractor during normal operations.
The next step was to measure the accuracy of the temperature readings we received from the thermal sensor module. To do this, Jonny started up the tractor and we began measuring the incoming temperature data. The accuracy of the thermal sensor module was measured by comparing the data to that of a heat sensor gun we borrowed from WA Ranches. We have a video of the live-action demo of this process. As a result, the data received from the thermal sensor module was very close to the measurements that the heat sensor gun read.
Finally, we wanted to test the mobile application and the base station connection while the tractor was in motion. The purpose of this test was to ensure that the signal between the thermal sensor module and the base station was not lost as the tractor is moving around on the farm. Jonny drove the tractor a ways away from where the base station was set up. The connection remained strong and resulted in a successful test.
Feasibility
Our prototype was tested at WA Ranches to gain an understanding of the feasibility of our device. One thermal sensor module will be mounted onto each farm equipment that the farmer wishes to monitor the temperatures of. The base station will be set up in the farmer’s house as the centralized temperature, GPS, and battery data collection point. The base station is able to run off the power that is supplied to the house. The thermal detection modules are able to run off 6 AA batteries.
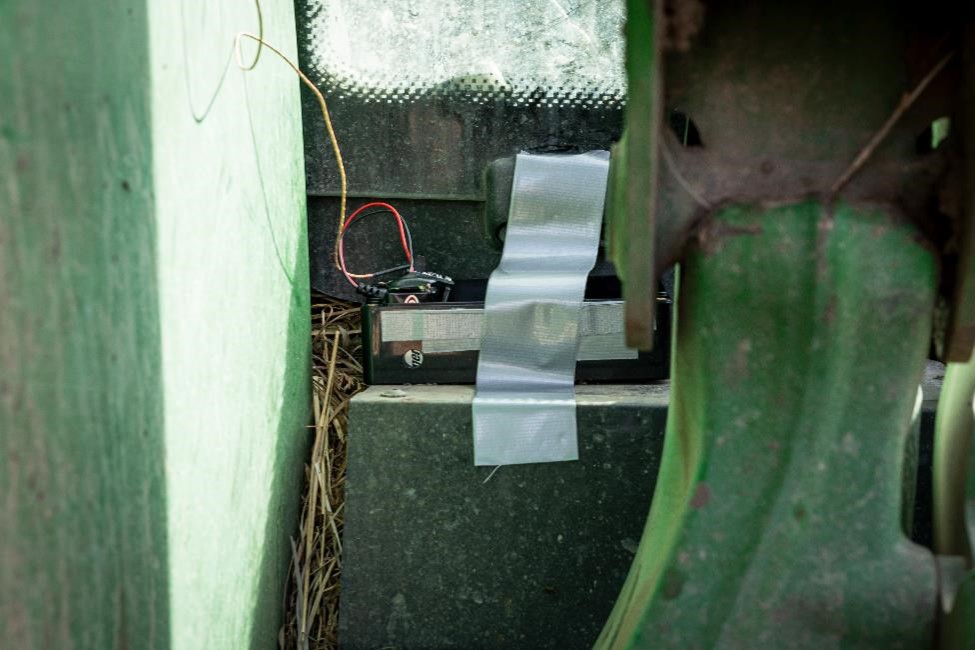
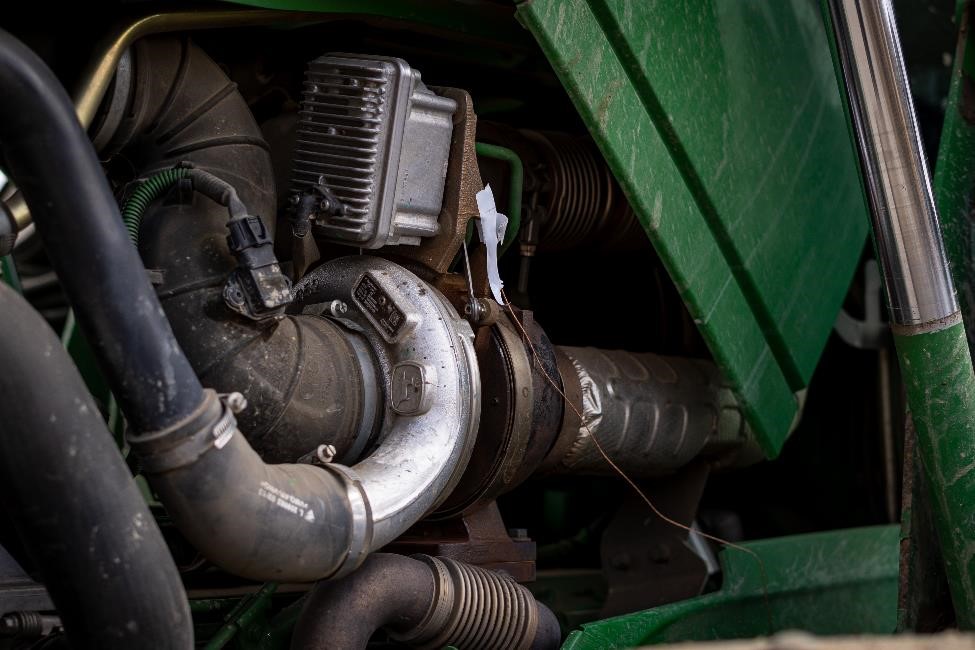
The thermal sensor module will be directly mounted onto the farm equipment. The module will be mounted away from the heat source to avoid damaging the unit. The thermocouple that extends from the module itself, however, will be attached directly to the heat source to give the most reliable data.
The cost per unit for the thermal sensor module is $159.63. The cost per unit for the base station is $100. If farmers have 3 thermal sensor modules deployed on their farm the total cost of our thermal detection network would be $578.89. This proves to be a cost-effective way for farmers to monitor their farm equipment and a proactive way to reduce disastrous losses.
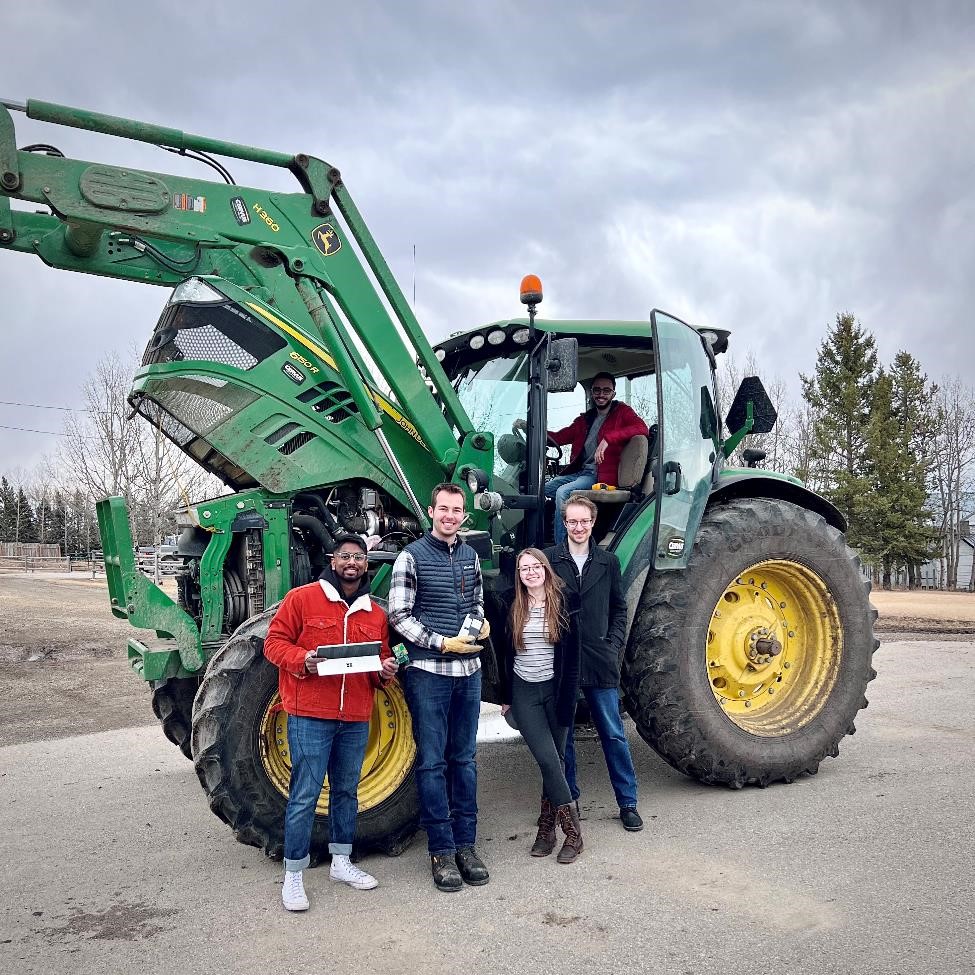
Meet The Team
Shelby Herle – Project Manager
Shelby has recently completed her 16-month internship at Aurora Wireless Networks (AWN) and has returned to her final year in Electrical Engineering. During her time at AWN, she developed an interest in project management as she was working on many different projects throughout her internship. She is currently involved with the “Go Baby Go” club at the University of Calgary as the Electrical Lead for the Original Design team. Throughout the capstone project, she was the project manager and a part of the hardware and testing team. She is excited for the next chapter as a Maintenance Engineer at Schlumberger upon graduation.
Peter Boonstra – Hardware Lead
Peter has experience in circuit design and PCB design, 3D modeling, working with test-bench equipment, and troubleshooting electronics. He has many relatives and friends involved in the agriculture industry and is personally very excited to be working on a practical project that can help improve the lives of others. He enjoys spending his spare time tinkering with electronics, radio, or audio equipment, taking advanced first aid classes, woodworking, or tackling rapids in his prized canoe.
Nikhil Naikar – Firmware Lead
Nikhil just completed his first term for the SCETA program offered by Siemens Energy and is currently completing the final year of his Electrical Engineering degree. He plans to pursue power engineering when he graduates. Throughout his undergraduate years, he has worked on many projects and enjoyed all of them. He loves to collaborate with people and solve problems. He is very excited to use his software knowledge to help complete this capstone project, while also looking forward to enhancing his problem-solving and teamwork skills.
Nooreldeen Abdallah – Integration / Testing Lead
Nooreldeen has completed an internship at AWN and is currently in his last year of Electrical Engineering. At UCRA (University of Calgary Robotics Association), he developed an interest in software development. AWN helped introduce him to the engineering design and testing process and taught him how to find information that isn’t readily available. It has been Nooreldeen’s pleasure to be a part of FODS.
Patrick Willmann – Software Lead
Upon completion of his software development internship at AWN, Patrick is attending his final year of Electrical Engineering. Through his experience at AWN writing software for the company’s automated firmware testing system, as well as prior course work, Patrick has developed a passion for the applications of software development. He is excited to broaden his software skill-set and work with the team to come up with creative and elegant solutions.
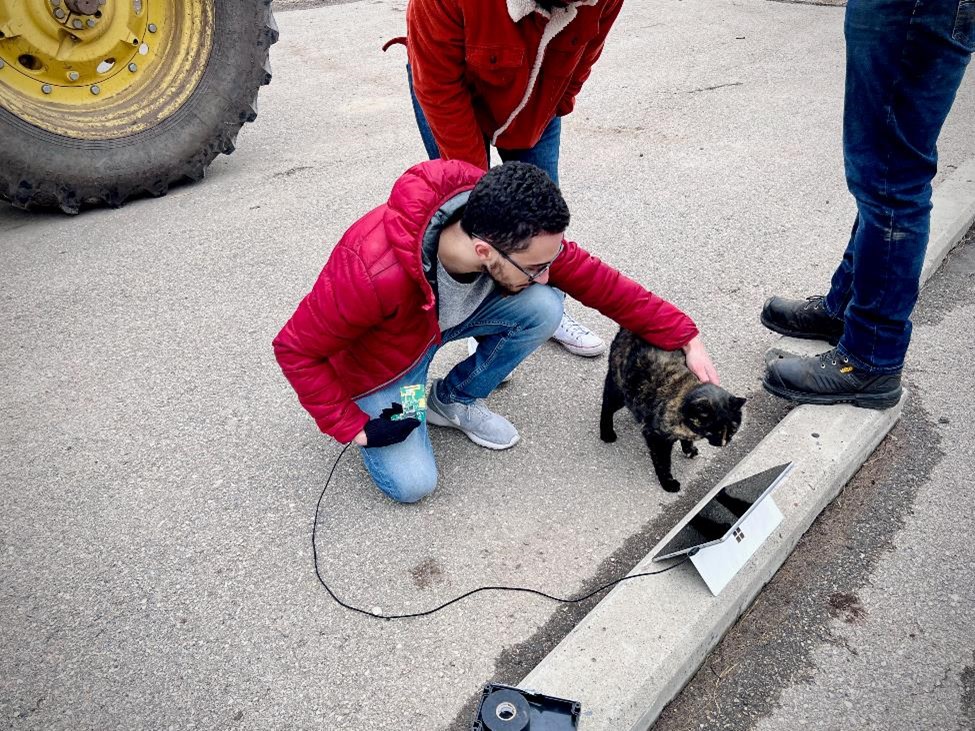
Black Magic – Moral Support
Black Magic is an outdoor cat who resides at WA Ranches. She was an integral part of keeping up team morale during some tough testing days at WA Ranch.
Partners & Mentors
We want to give a huge thanks to our sponsor Aurora Wireless Networks as their technology was an integral part in the completion of our project. We want to thank Dr. Elise Fear, Craig Trask, and Gideon Egharevba for giving us helpful feedback throughout our project.
We are grateful to WA Ranches for allowing us to test our prototype on a few occasions on their tractor. We want to extend a special thanks to Jonny Bennet – Ranch Manager – as his advice and support of our project were invaluable throughout our testing phase.
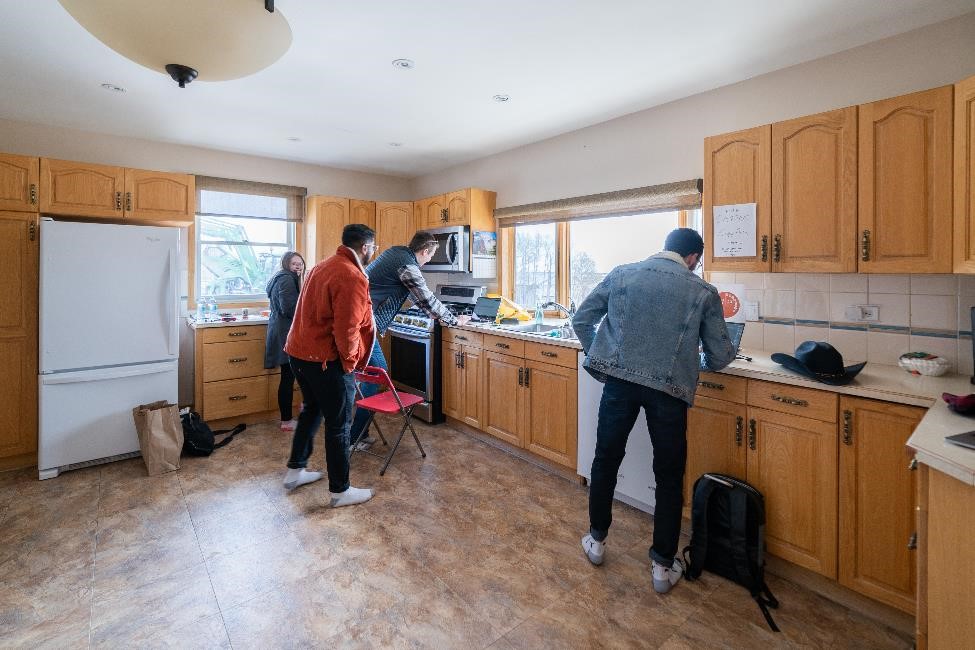
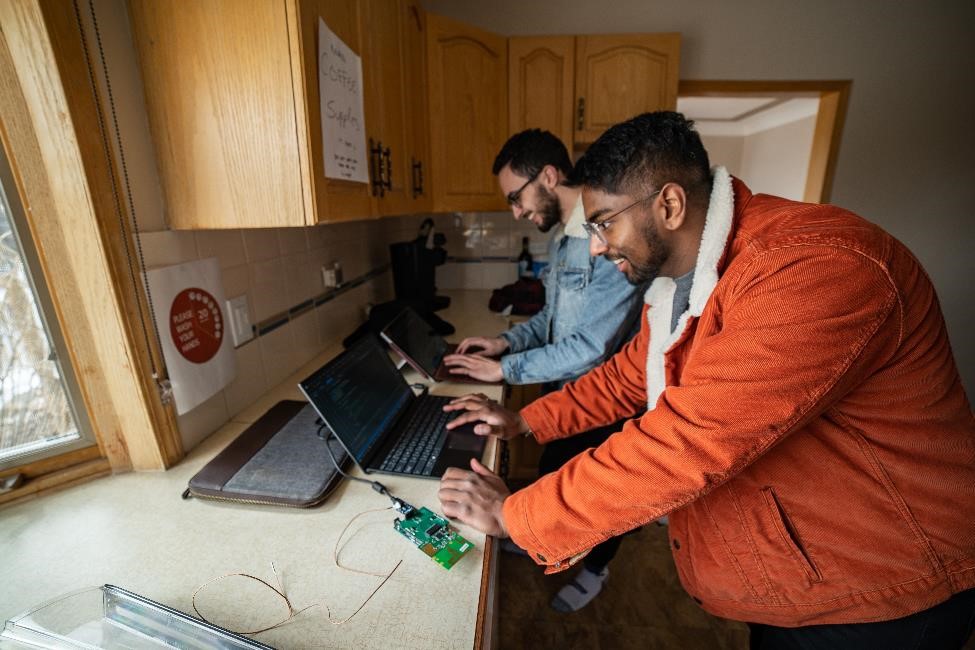
Our Photo Gallery
References
- Combine and tractor fires – a burning problem. Agricultural Safety & Health. (n.d.). Retrieved April 2, 2022, from https://fyi.extension.wisc.edu/agsafety/machinery/combine-and-tractor-fires-a-burning-problem/
- OHV Safety. OHV Safety | AAF – Agriculture and Forestry. (n.d.). Retrieved April 2, 2022, from https://wildfire.alberta.ca/prevention/ohv-safety.aspx#:~:text=Exhaust%20systems%20heat%20up%20to,heat%20up%2C%20smoulder%20and%20ignite
- Henke, J. (2019, December 2). John Deere Maintenance Monday: Engine operating temperature. Successful Farming. Retrieved April 2, 2022, from https://www.agriculture.com/family/living-the-country-life/john-deere-maintenance-monday-engine-operating-temperature
- Download free vector art, Stock Photos & Stock Video Footage. Vecteezy. (n.d.). Retrieved April 2, 2022, from https://www.vecteezy.com/
- Industries, A. (n.d.). Thermocouple type-K glass braid insulated. adafruit industries blog RSS. Retrieved April 2, 2022, from https://www.adafruit.com/product/270
- MLink Interface Control Document
- Cow mooing sounds 100% real – youtube. (n.d.). Retrieved April 3, 2022, from https://www.youtube.com/watch?v=J0HgEEY2jts
- Yee Haw (Cowboy Sound). YouTube. Retrieved April 3, 2022, from https://www.youtube.com/watch?v=rdEvACroDKs&ab_channel=SoundGuy.
- AC/DC. (1979). Highway to Hell.
- Alabama. (1992). I’m in a hurry and don’t know why
