Project Category: Electrical
Join Our Presentation
About Our Project
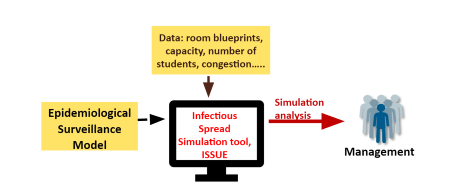
Infectious Spread Simulation in University Environment (ISSUE) is an interactive online web-based desktop analytical tool that will model the spread of COVID-19 at the University of Calgary. The tool will support decision makers, such as school administration, by simulating infection spread and risk for a variety of seating arrangements within lecture spaces on campus. The result of the simulation will show a simple layout of the desired room with an overlap of a heat map. Using this visualization, users can adjust infection parameters and the location of each individual “agent”, in order to create a safe environment for students and staff to return to post-pandemic life.
About Our Team
Nafisa Tabassum
Project Manager/Full Stack Developer
I am in my final year of Electrical Engineering. I have great interest in computer networks/telecommunications, information security, and data analytics. I completed a 16 month internship at 3D-P where I automated network configuration and management of Intelligent Endpoints, an edge computing device, through orchestration tools and scripting. My skills are focused on software development and some hardware/PCB design. I would like to continue working as a software developer after I graduate and potentially do research in the future.

Sachinee Wijetilleke
Lead Researcher
I am a final year Electrical Engineering student. My passion lies in power engineering and renewable energy. During the past 16 months, I’ve interned at TC Energy as a Corrosion Prevention Engineering intern, where I had the opportunity to explore my interests in the energy industry and business ventures. My skills are focused on electrical engineering design and power system analysis, where I hope to develop my professional career in. I enjoy spending time learning and challenging myself with opportunities for growth both technically and professionally.

Abhijeet Jagdev
Technical Lead
I am a final-year Software Engineering student pursuing a minor in Data Science. Over the last few years, I’ve delved into various applications of machine learning in fields such as robotics, computer vision, and biomedical imaging. In my internship at Au-Zone Technologies, I got the opportunity to learn about deep learning model optimization for embedded platforms (which are typically constrained by processing speed and the availability of on-board memory). I plan on continuing onto post-graduate studies where I can further explore and refine novel applications of machine learning to these challenging domains.

Linh Nguyen
Lead Researcher
I am in my final year of Electrical Engineering. Though I am not specialized in it, I have a minor interest in programming. My main interests that I’ve explored as a student leans more towards power engineering and design, particularly in motors and buildings. Over the past year, I have completed an internship with Stantec, a design and consulting company, where I developed knowledge and skills for the electrical aspects of buildings and infrastructure design. I hope to continue to cultivate and learn new skills to become a well-rounded electrical engineer.

Muhammad Farooq
Full Stack Developer
I am a final year Electrical Engineering student also pursuing a minor in Computer Engineering. I have always been passionate about software and technology, seeing innovations in the technology industry has really inspired me to get involved. I have spent the past 16 months doing an internship at Pason Systems as a Signal Processing Intern. During these 16 months I learned a lot about my interests. I really enjoy working with other engineering disciplines to challenge myself and solve real world problems. My skills lie in software development and electrical engineering design.
Nafisa Tabassum
Sachinee Wijetilleke
Abhijeet Jagdev
Linh Nguyen
Muhammad Farooq
Design Details
Project Practicality
Throughout the past year we have seen how drastic of an impact COVID-19 has had on every one of us. It is clear that to properly mitigate the risks of COVID-19 we need to plan around it as it has become a norm in our society. It is simply not good enough to “wait” for it to be “over”, rather we must account for it and make sure we are prepared to handle it. This COVID-19 simulation tool that we have designed can be used by universities as well as workplaces to ensure the safety of all employees and students as they transition back to workplaces and school. We wanted to automate as many steps of the process as possible to ensure minimal labor and manual work was required, because of this we created a computer vision based script to map the seats in each room. As well, we have found open source software that can be used to convert excel files to JSON files which will be imported into the web application to ensure an up-to-date database.
The total cost of our project is $0. This was done intentionally as we did not want cost to be a hindrance for individuals using our web application. We wanted this tool to be accessible to all regardless of financial situation. We achieved this by using open-source software that did not require licenses, as well as using the free tier of Heroku to deploy our website.
Design Innovation
When deciding how we wanted to develop this tool, we came to a crossroads between 3 major choices: a web application, a mobile application, and a desktop application. We chose to proceed with a web application as it allows for the most flexibility and can be used by anyone who has access to the internet and a browser. Both of which are ubiquitous in todays technology entrenched environment.
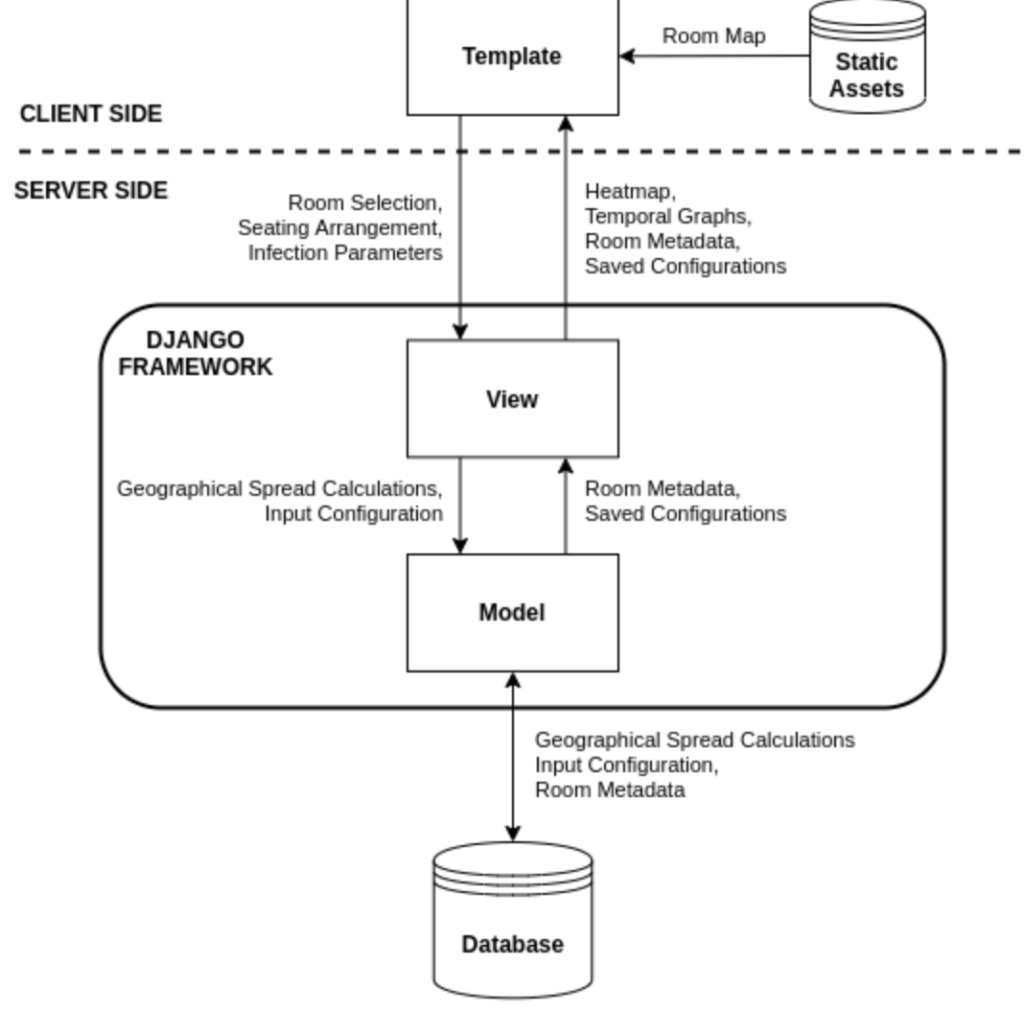
We used a Django framework that is based on python to create a web application. Django allowed us to rapidly prototype and get our website up and running as we continued to work on it. This was essential given the short timeline of the project. We have incorporated COVID-19 infection parameters by reading educational papers that were created by scientists that studied the disease. This allowed for us to create a COVID-19 model that represents the risks associated with the virus and present it in a way that will be user friendly to maximize productivity and reduce overhead required to use the application. Furthermore, our current model works in the 2-D space, however, we have accommodated the model to be readily available to work in 3-D simulations by making some simple changes within our code base.
Design Effectiveness
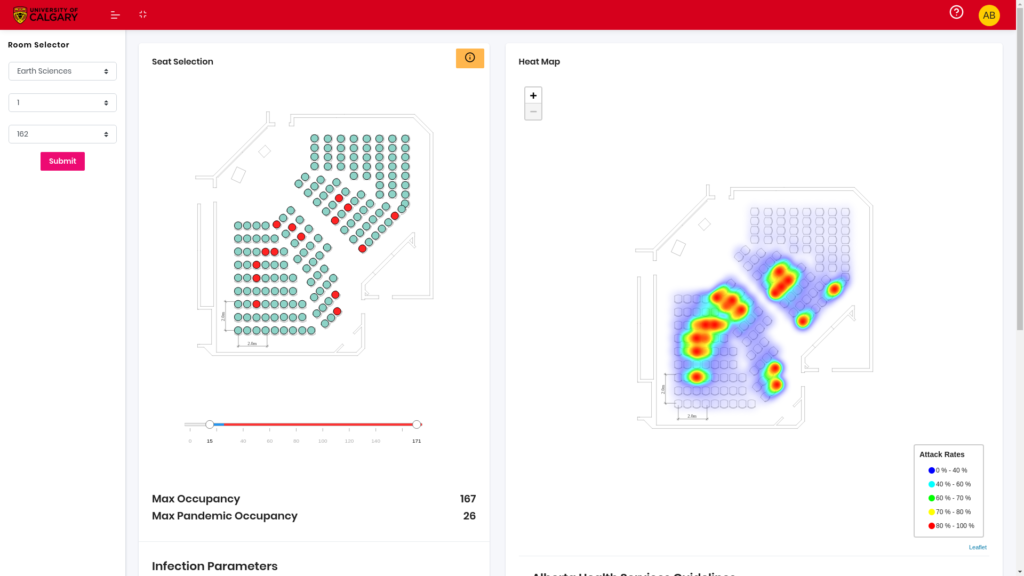
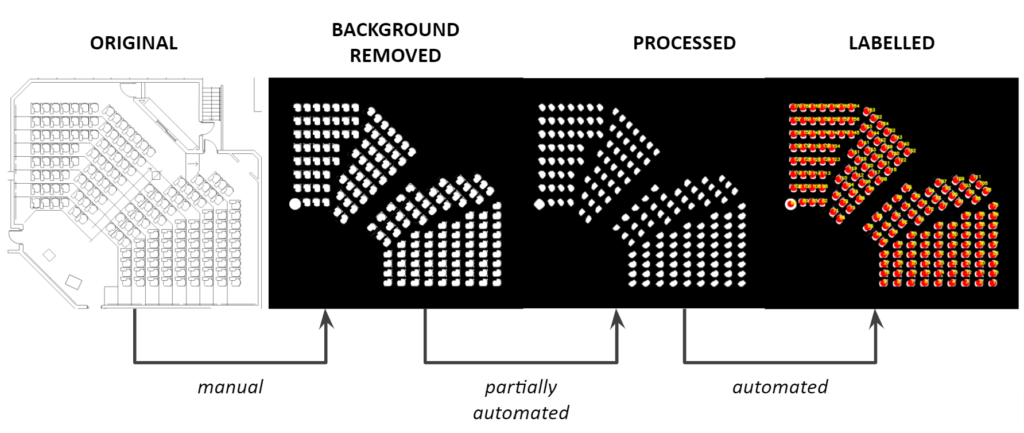
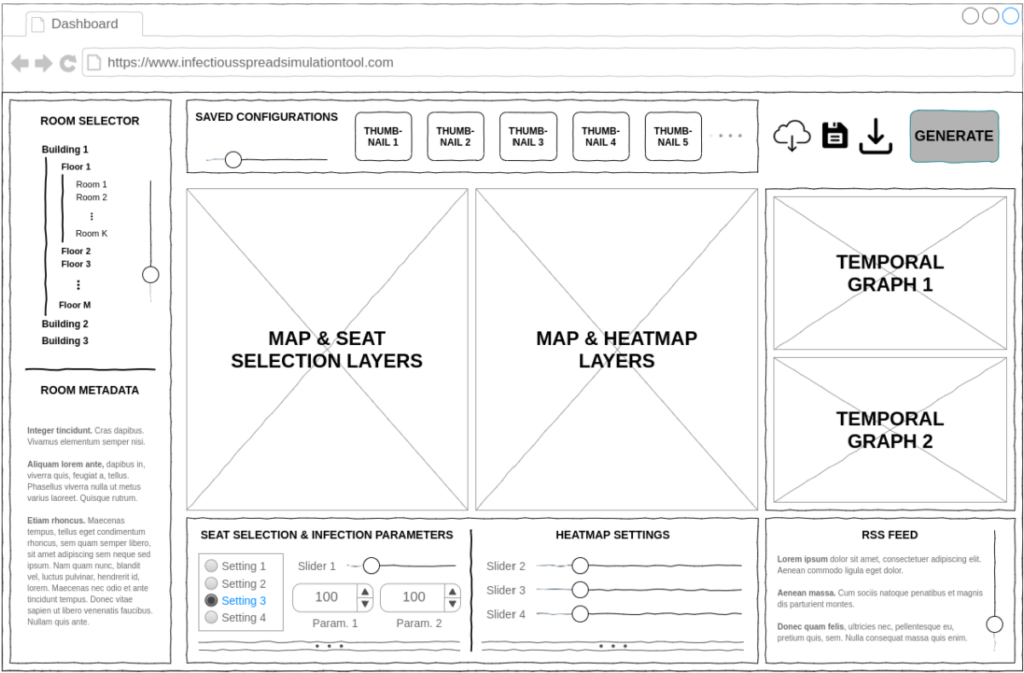
Our design solution is effective because we have automated many of the tasks that users would have to manually do. One of these tasks is automatically placing seats on a floor plan which can be quite tedious as the amount of floor plans grows to manually map the seats on each room. With our automation, users simply pick a room, place students in the room and the application takes care of the rest. The application will provide a heatmap with the attack rates and a temporal graph showing how time will affect these attack rates as well. The temporal graph will be imperative in deciding the length of classes as it will visualize the difference in the spread of COVID-19 in a 50 minute class vs a 75 minute class. We have also partially automated the work required to add additional rooms, using computer vision we can categorize seats without an individual manually labelling them.
Design Validation
Our COVID-19 model was based on data obtained from a passenger train, because of this, we had to make reasonable assumptions along the way. However, to validate our model we ran many different simulations in which we tested corner cases to confirm our model was able to handle them. To ensure we had created a web application that had a robust and user-friendly interface, we created a survey and asked a wide range of users to provide feedback. Most of the feedback was positive, and the issues that we consistently saw users have, we were able to add into the web application to further improve our design. We added features such as a user manual which acts like the documentation for the simulation tool. We also added information pop-ups over every visualization to provide more information to the user about how to use and interpret each visualization.


Design Feasibility
The intention is that users can import data/floorplans about the space that they would like to simulate i.e., an office or the university. The ability to simply upload data and floorplans for any space and then be able to simulate COVID-19 in that environment makes our design solution very feasible and manageable for most users. This assumes that floorplans and data are available; but for most commercial buildings, that data is available because it is required as per the Alberta fire code. We have also created our design solution in a modular way that will allow for it to be adaptable to other viruses and be used for pandemics in the future. Furthermore, the website is safely secured behind a login page, this is to ensure no sensitive data (such as room floor plans etc.) is leaked to third parties.
Partners and mentors
The Biometric Technologies Laboratory (BT Lab) has been our sponsor for the duration of this project and their guidance has been key to our success. We want to thank the many people who helped us with this project. Our electrical engineering professor Svetlana Yanushkevich guided us through the process with patience and great advice. And, our consultation with a masters student Philip Ciunkiewicz was invaluable. We would also like to express our gratitude to the authors of the following paper “The risk of COVID-19 transmission in train passengers: an epidemiological and modelling study” as without their research into COVID-19 on a passenger train we would not have made the progress that we did. Finally, we would like to recognize both our ENEL 500 Professor Hamidreza Zareipour and our TA Nima Sarajpoor for their continuous support throughout the semester.


Photo Gallery
High-Level Architecture
Web Design
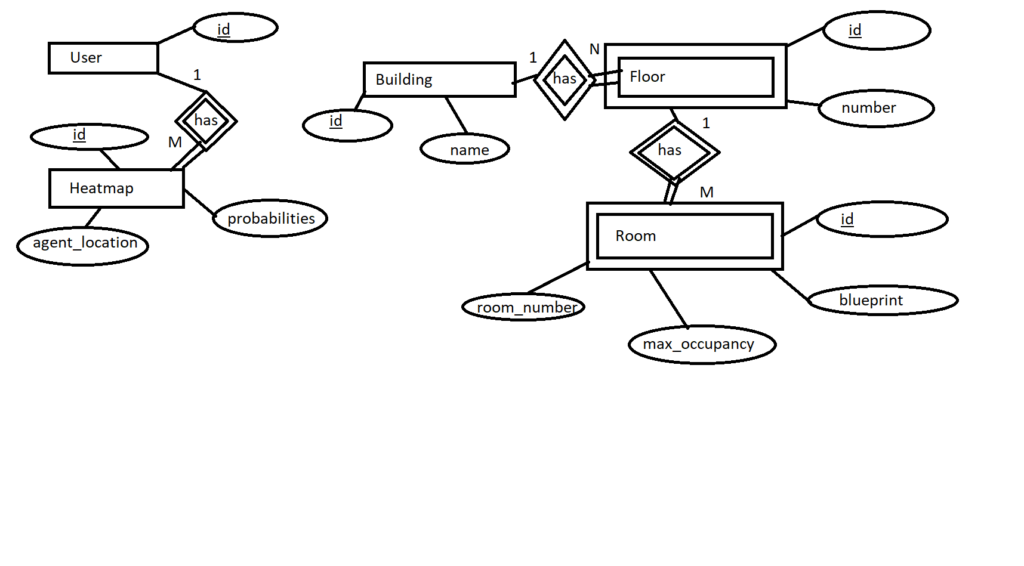
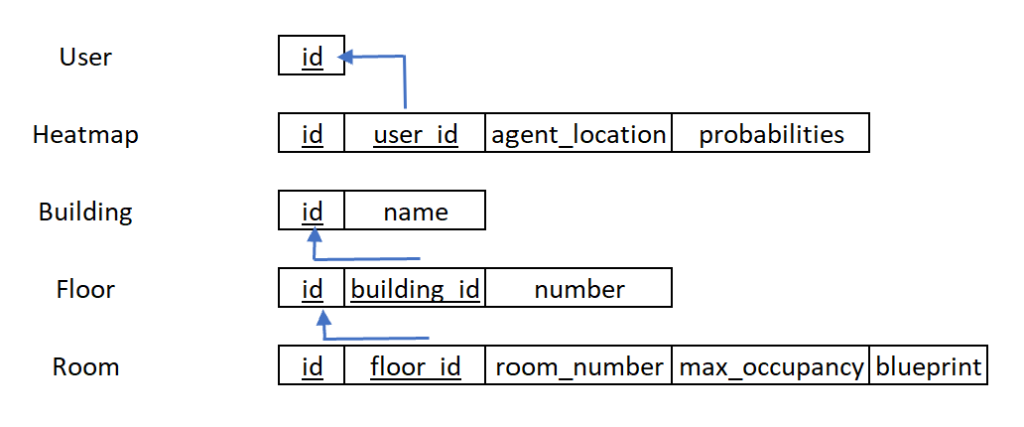
Database Design