Project Category: Geomatics
Join our presentation
https://ucalgary.zoom.us/j/91232597557
To join our zoom meeting, click the link above, no password required! To log on manually, the meeting id is: 912 3259 7557
About our project
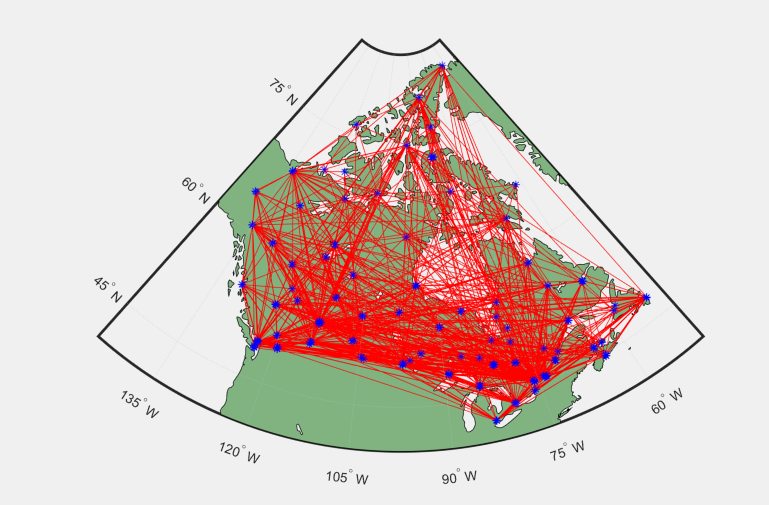
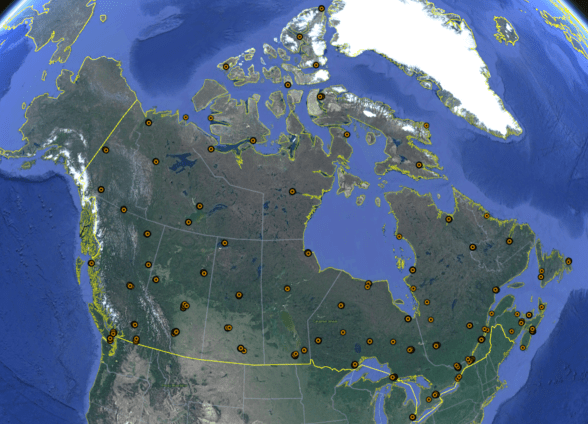
The purpose of this project is to readjust the Canadian primary gravity network, utilizing a one-dimensional least squares readjustment method. Ideally, the results of the adjustment will be used to align the Canadian Gravity Standardization Network (CGSN) with today’s International Gravtity Reference System (IGRS) standards. This project focuses on only bases located in Canada, however, this is being built with the intention of integrating the data with the work that CGS and Natural Resources Canada is doing, and so it will eventually be integrated into the IGRS.
The data that was used in the least squares adjustment is provided by CGS and will be the epoch 2020.0 results from the CGSN. There were multiple adjustments applied to the data. The first adjustment, a least squares static adjustment, determined the value of gravity, g, at each station. This adjustment was completed in terms of the absolute gravity measurements. A separate kinematic adjustment has been applied to estimate further parameters, which are the instrument scale factors, the instrument drift factors, and the gravity velocity at each station in the network.
Want to know more? Follow the link below!
Meet our team members

Bryn Griffiths
Technical Lead
Hello and welcome to our project. I am a University of Calgary student completing a bachelor’s degree in geomatics engineering with a concentration in cadastral surveying. My professional experience thus far includes one summer of work as a survey assistant working in commercial oil and gas and municipal construction. Following this semester, I will be embarking on my third season of tree planting then returning to pursue a career in the surveying industry.

Carley Hopkins
Project Manager
Welcome to our project! I am taking Geomatics Engineering with a Cadastral Survey Concentration. After graduation, I will be starting work with Trimble as an Applications Engineer. I hope to develop a career in the construction surveying industry!

Sebastian McGonigle
Communications Lead
Thank you for taking an interest in this undergraduate project, and in myself as a developing student. The focus of my studies is the Cadastral Surveying Concentration within the Geomatics Engineering program at the University of Calgary. Upon graduation my goal is to launch a prosperous career in Land Surveying.
Details about our design
HOW OUR DESIGN ADDRESSES PRACTICAL ISSUES
The practical issue can be expressed as the lack of updated fulfilling designs for 50 years while the technological demands have increased. Our design bridges the gap between 1971 and 2021, ushering in a new era for the Canadian Gravity Standardization Net. Our design is not rigid but malleable to the changing conditions of the network, which makes it very applicable for future integration of additional stations and measurements within the network.
Additionally, one of the primary applications of long term gravity changes in Canada is post-glacial rebound. This is a phenomenon that disproportionately affects Canada, and has a significant impact on sea level rise. Post-glacial rebound occurs when glaciers melt and the weight of the glacier on the earth’s crust lessens. The tectonic plate the glacier is located on was being compressed by the glacier, and without that weight, the tectonic plate “bounces back”, or “rebounds”. Both glacier melt and plate rebound affect gravity in the area, as gravity is affected by mass and mass changes.
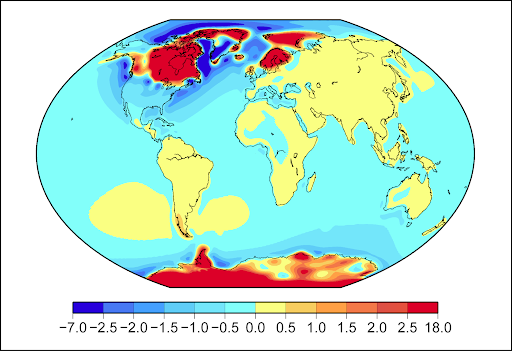
http://www.antarcticglaciers.org/glaciers-and-climate/sea-level-rise-2/recovering-from-an-ice-age/.
WHAT MAKES OUR DESIGN INNOVATIVE
The 1950’s and 1960’s saw improvements to the absolute gravity instrument accuracies. These improvements to the absolute gravimeters allowed for data from the new ballistic absolute gravimeters, relative pendulum gravimeters, and relative spring-based gravimeters to be consolidated worldwide. This consolidated data was solved simultaneously and was published as the International Gravity Standardization Net 1971 (IGSN-71). This gravity datum is still the “official gravity datum worldwide today”, and has an accuracy of +/- 0.1 mGal. The past 51 years, however, have seen large improvements to the accuracy of gravimeters and more widespread use. As a result, this datum system has begun to be phased out of use.
It has been determined that the ISGN-71 “no longer fulfills the requirements and accuracy for the understanding of the Earth’s system”. Additionally, gravimeter measurements have improved from a level requiring a tolerance of 100 μGal to a “few μGal”. Additionally, since 1971, every continent has been densifying their networks, and contain much larger systems than accounted for 50 years ago.
This reference system differs from the standardization net in multiple ways, and the use of the word “reference frame” as opposed to naming the updated gravity datum IGSN15 was done deliberately. A reference system assumes that the definition of gravity is stable over time, while a reference frame is “subject to model improvements or updated requirements”.
HOW WE VALIDATED OUR DESIGN SOLUTION
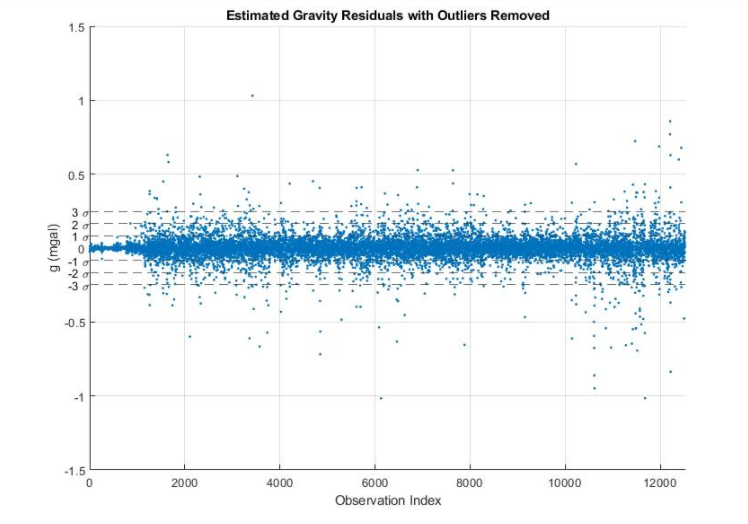
To validate our design solution, we utilized least squares analysis and statistcal testing. The statistical constraints were determined and set by the team. Displayed below is are residual results of the gravity observations generated by the program. The standard deviations are overlayed across the residual plot in dashed lines.
The acceptance criteria for our results can be approximately defined as a few hundred micro gals, and it is possible to see that even within the 3 sigma allowances, which allows for approximately 99% of observations.
FEASIBILITY OF OUR DESIGN SOLUTION
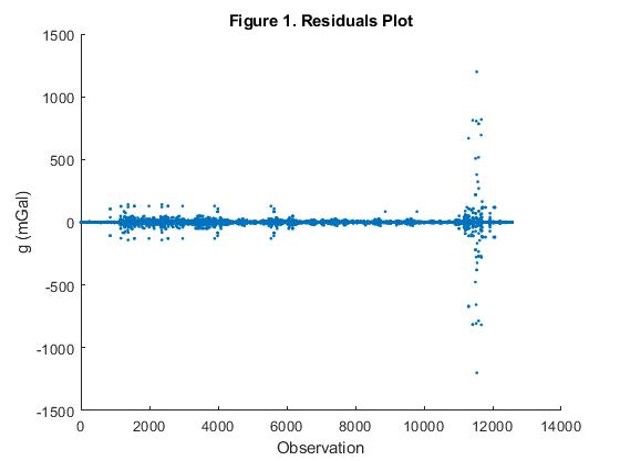
The results generated with the program have been determined to be feasible. The initial results, displayed in figure two below, demonstrate a wide range of residuals. It should be noted that the team was advised to generate results that fell within a few hundred microgals. As seen in figure two, pre-correction data was far outside of that criteria, displaying residuals of more than 500 milligals.
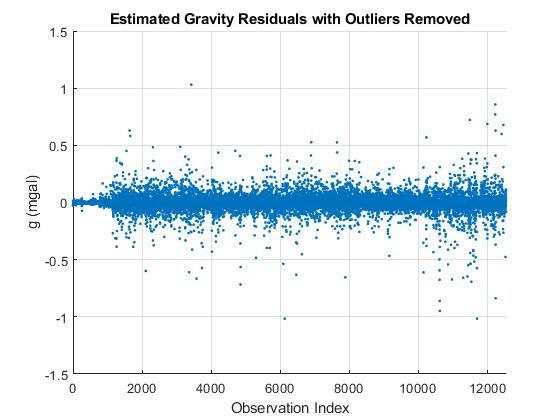
Post correction, when applying the scale factor correction to the results generated in figure two, leaves the residual results seen in figure 3 that are defined as feasible by the team. Of the 12,540 observations evaluated in the program, three gravity observations had residuals of more than one milligal , or 0.0002% of results.
As can be seen in our solution validation section, the residual plot has the standard deviations of sigma 1, 2, and 3 applied. The 3 sigma accomadates for approximately 99% of observations, and it is clear that these observations fall within the team’s criteria.
Partners and mentors
We would like to thank our advisors at the Canadian Geodetic Survey: Marc Veronneau, John Crowley and Jianliang Huang for their aid with our team during this project. A special thanks to Dr. Micheal Sideris, our academic advisor, for his valuable feedback, and always pushing us to improve.
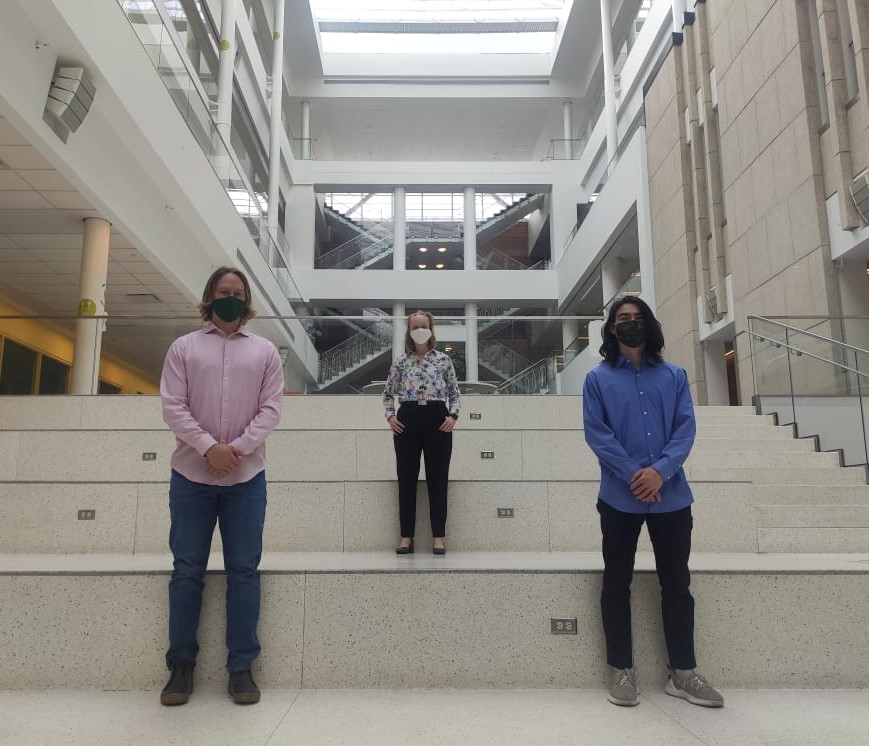
Our photo gallery