Project Category: Geomatics
Ask Us Questions
About Our Project
In recent years, the race to fully automate driving vehicles has sparked new application ideas and actualization of many industries. In this particular project, the focus is on personal self-driving vehicles and the accuracy of the modules. The general idea of a fully autonomous system is to integrate different systems of modules to result in the most accurate and reliable combination, in terms of hardware, technology, or algorithms. For this project, the focus of components are GNSS and IMU systems. The cost and accuracy has a “trade-off” relationship; having high accuracy will increase the cost greatly, while keeping relatively standard accuracy can be cost friendly to individual users. One of the ways to meet the accuracy and standard, is to choose the best frequency band and constellation pairs, such as choosing L1+L2 over L1 only.
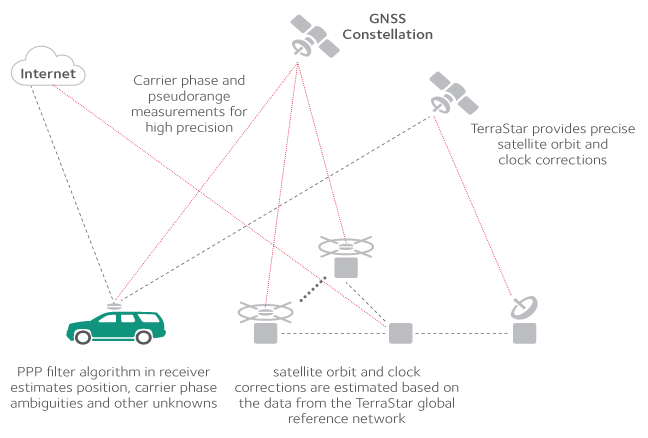
The aim of this project is to analyze different frequency band and satellite constellation combinations in a variety of driving environments using the OEM7500 module and the PIM222A module. Additionally, a PwrPak 7D-E1 module will be used as a truth system for the kinematic tests. After processing the output data, the performance of all proposed frequency band and satellite constellation combinations will be analyzed for each environment. Finally, recommendations will be made based on price and performance analysis for each module.
Meet Our Team

Data Analytics and Data Representation

Software Design and Programming
Hardware Design and Data Acquisition

Data Analytics and Data Representation
Details About Our Project
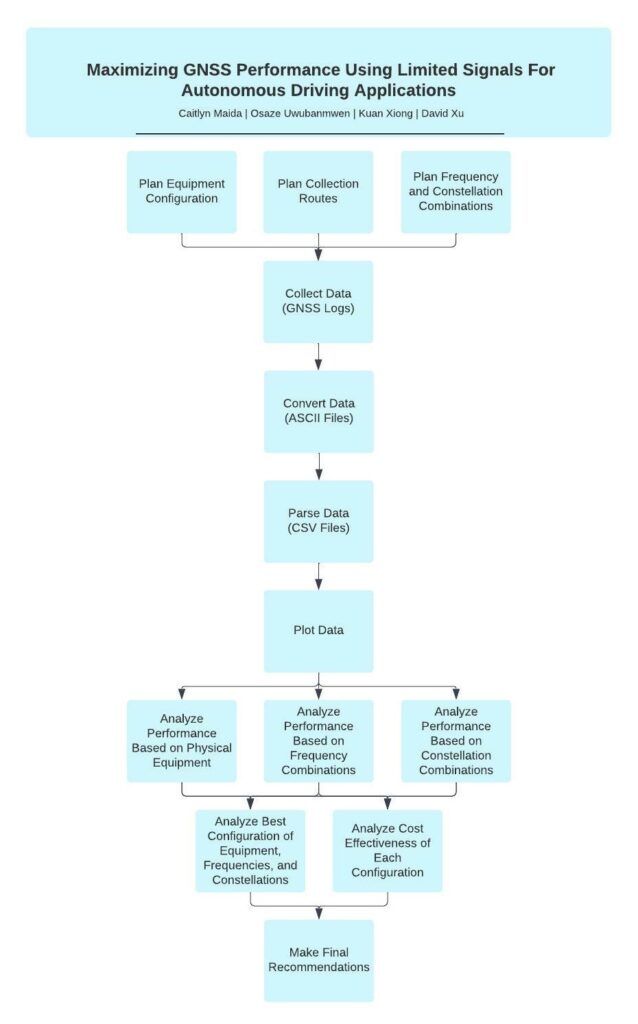
PROJECT FLOWCHART
The final deliverable for this project is an analytical paper on the data we collected, as such, we do not have one final deliverable “design”. Instead, over the course of this capstone project, we have designed multiple tools/techniques to aid us in the acquisition, parsing, analysis, and visualization. As such, we will break down the designs for each stage and explore the issues they address, their effectiveness, and their performance. Below is a flowchart outlining the basic path of our project from beginning to end.
TEST DESIGN
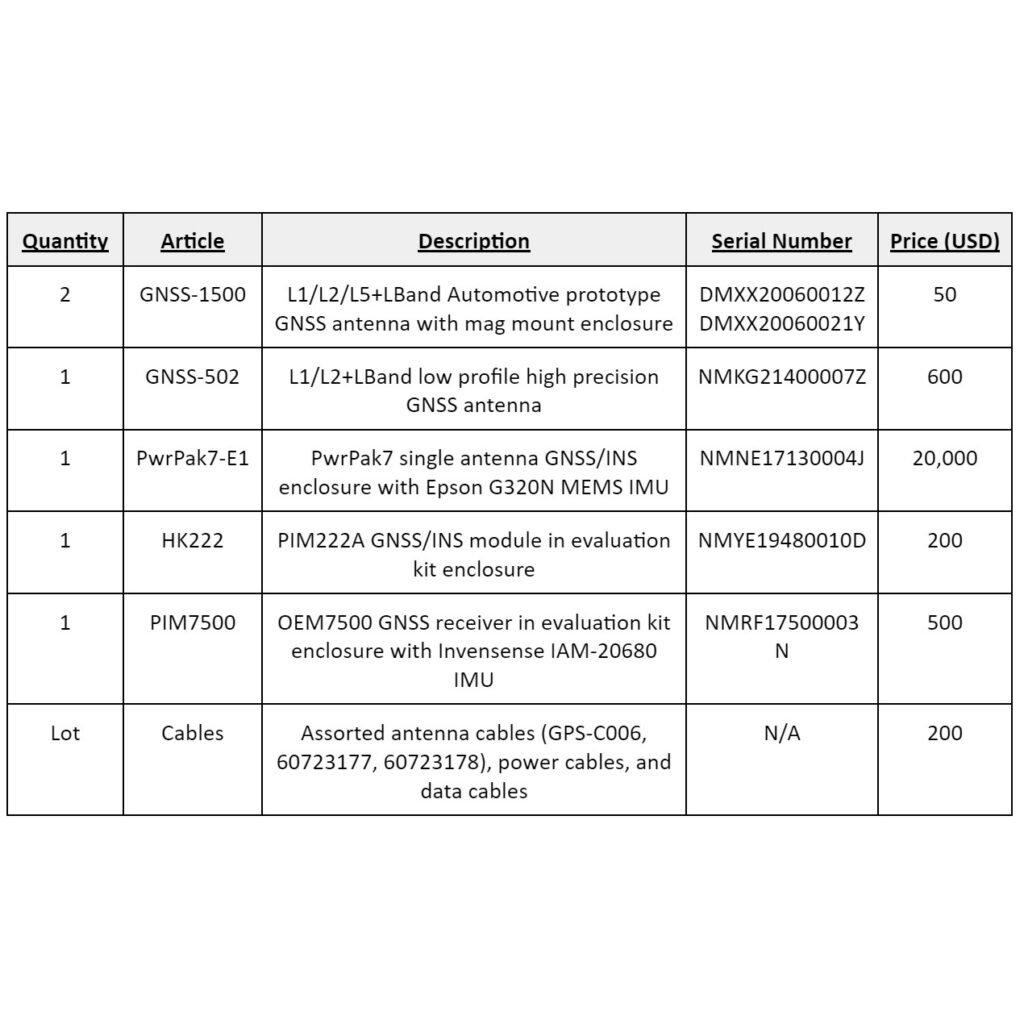
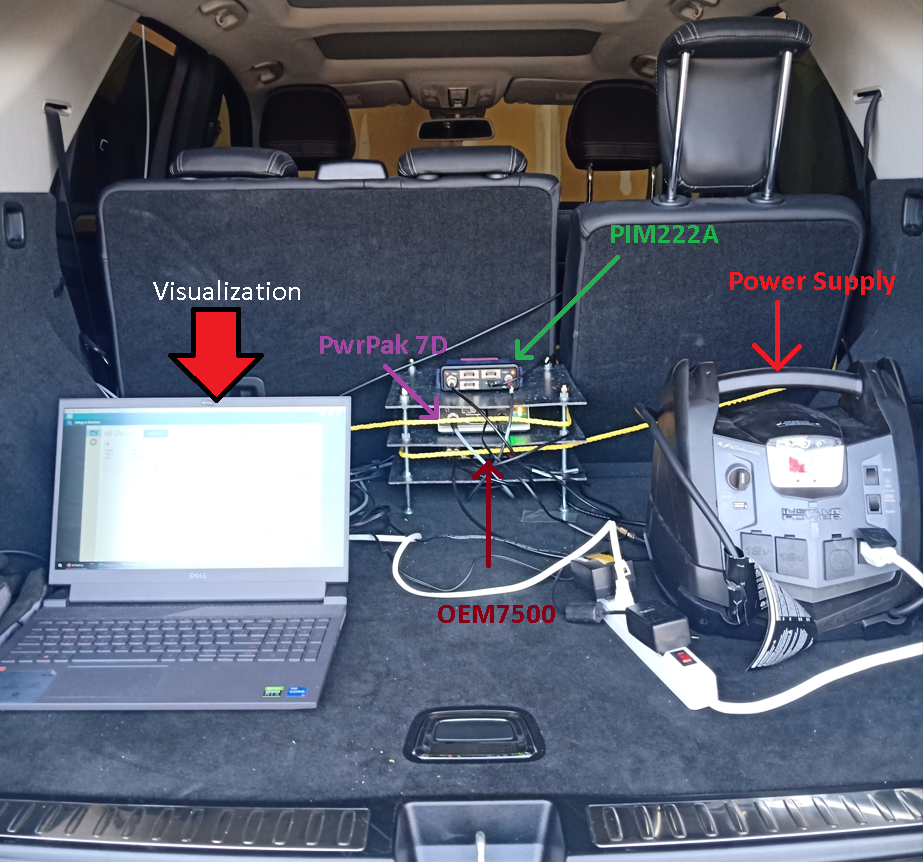
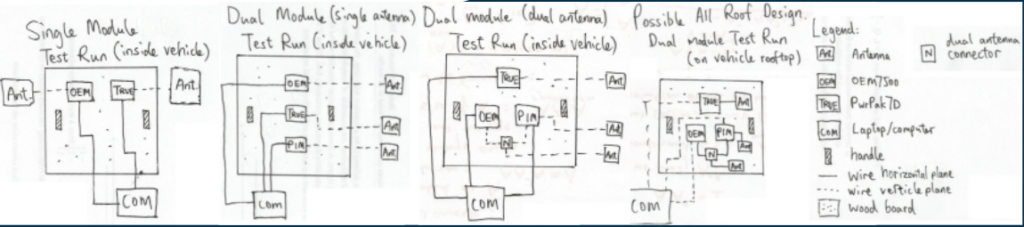
The team tested two affordable GNSS modules available on the market, the OEM7500 (~$500 CAD) and the PIM222A (~$200 CAD). The outputs of these modules would be compared against the “true” values. In order to determine the “true” values, the team employed a high-end GNSS module, the PwrPak 7D-E1 (~$20,000 CAD).
First, the team defined the criteria of what constitutes a successful data collection session as follows:
- All three GNSS modules are configured properly and are fully operating, with their relative positions accurately measured and logged.
- The planned route was executed within only one environment of interest; this was done to ensure all datasets were independent of each other.
- Finally, each test would run for approximately thirty minutes, as the data sampling rate for GNSS logs ranged from approximately 100 milliseconds to 1 second, this would ensure approximately 1800 to 18,000 data points for each data collection session.
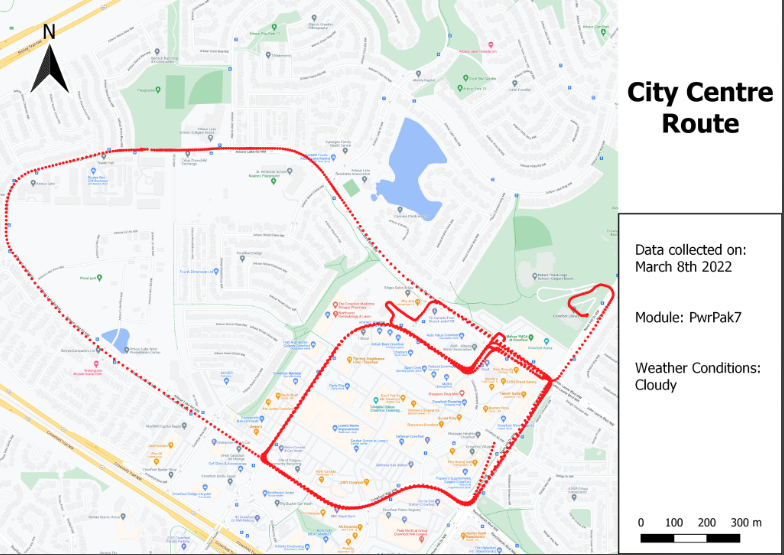
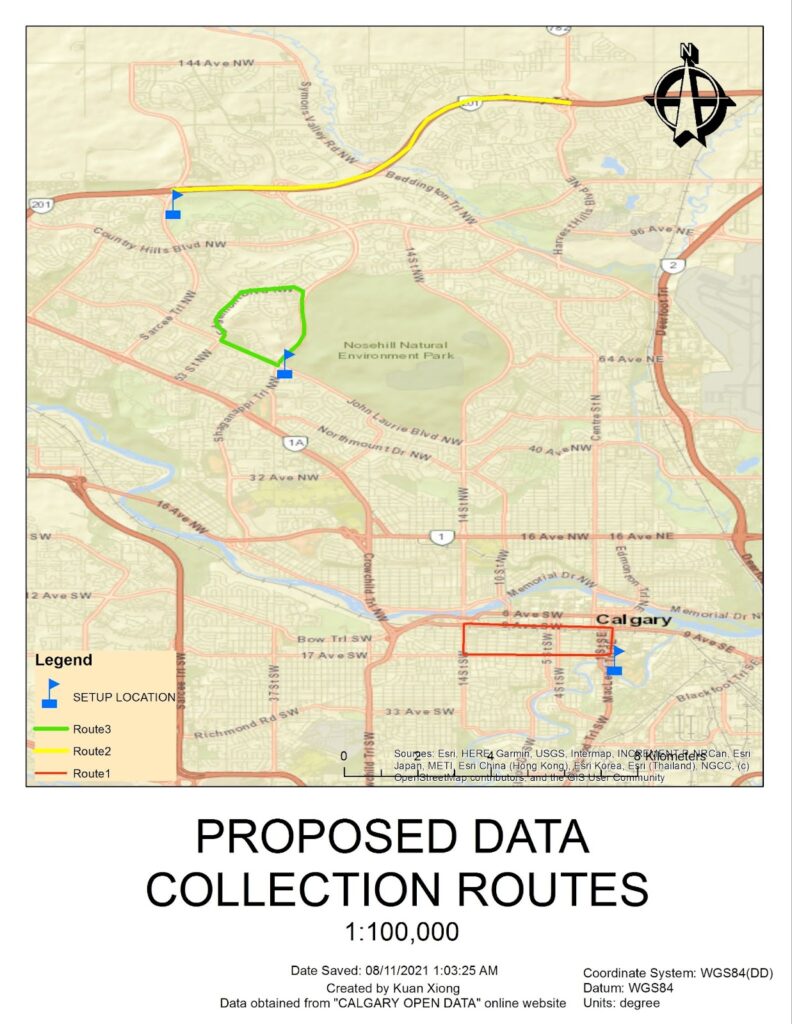
The objective of this project is to mimic conditions which autonomous vehicles would encounter frequently. As such, the team decided on three key physical environments for testing: city centers, suburban neighborhoods, and highways. Each of these environments come with their own set of challenges.
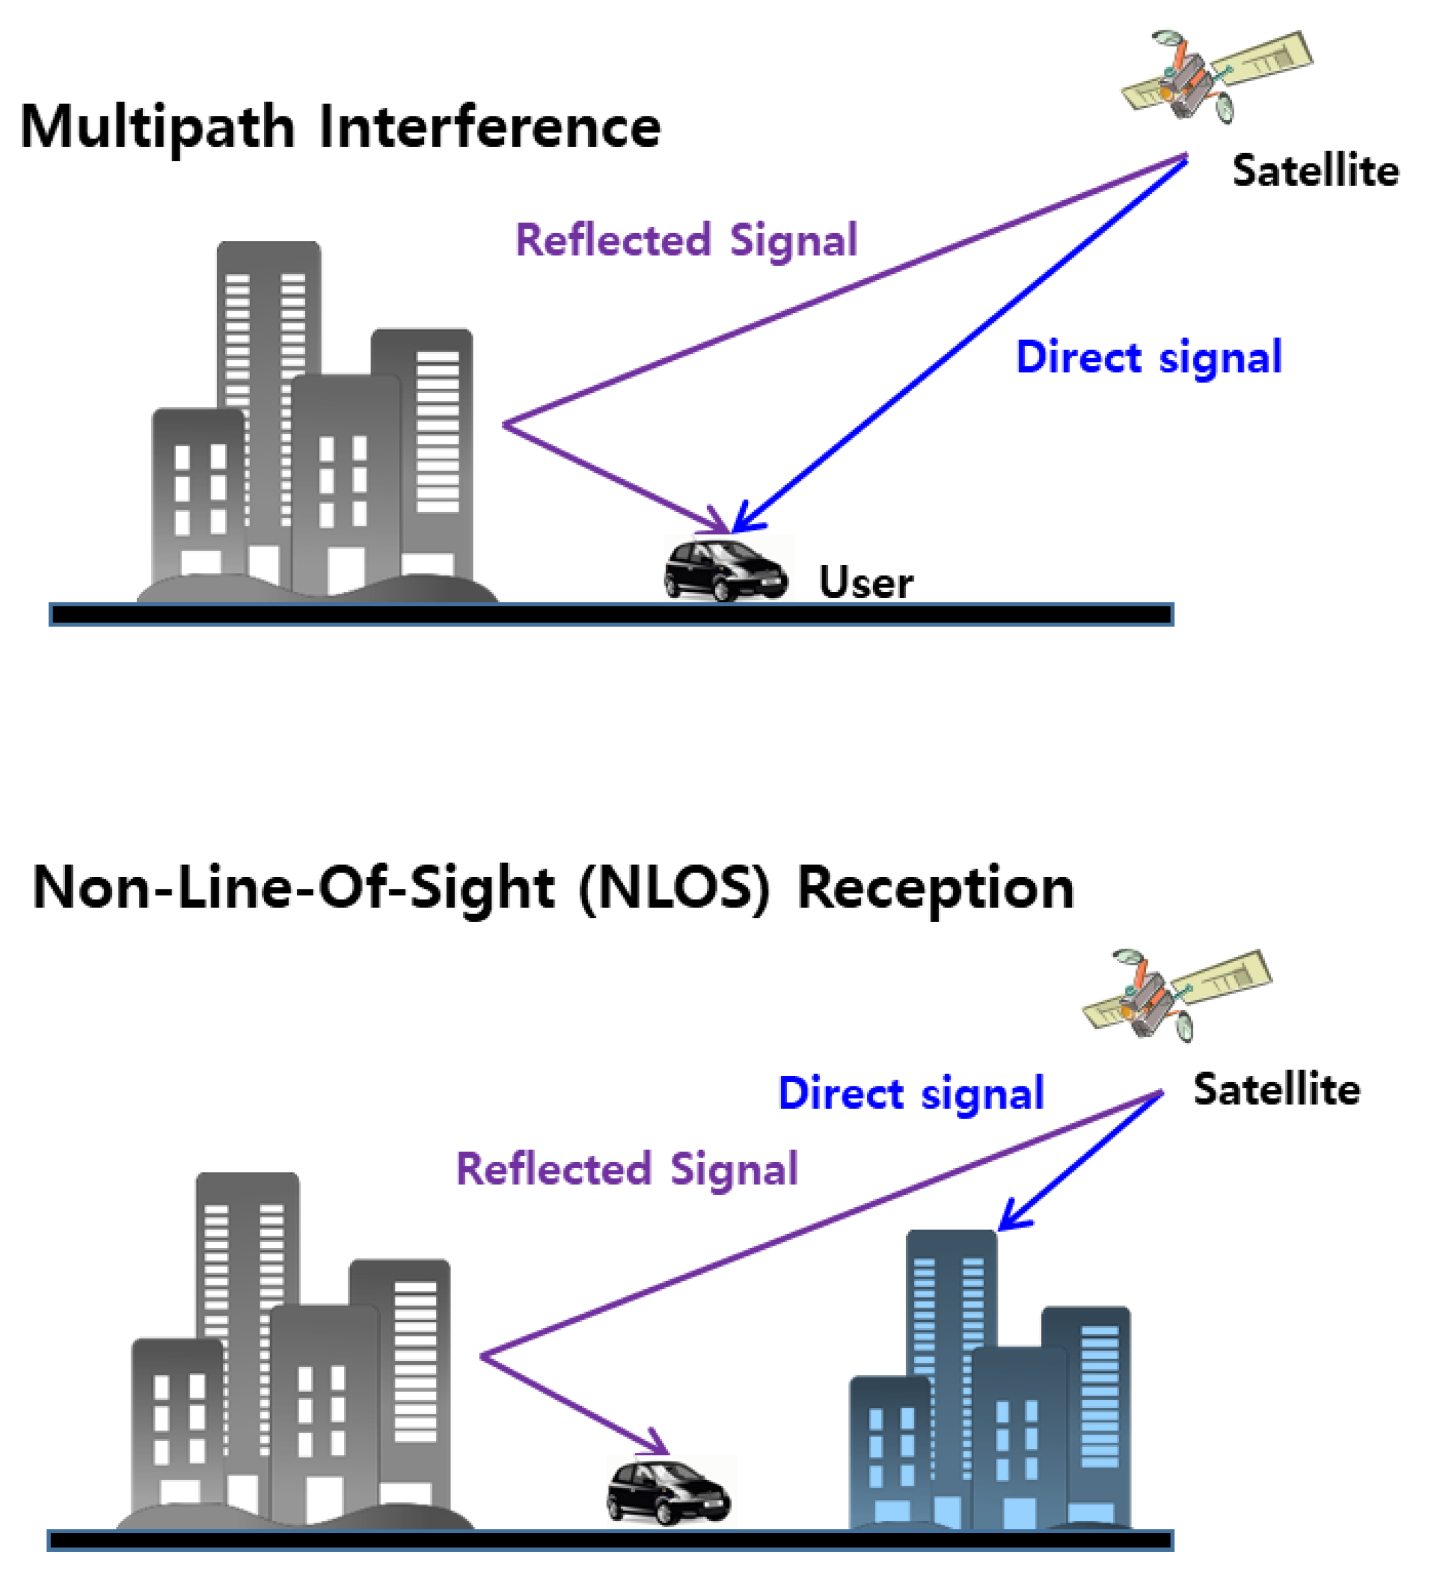
City centers tend to have wider lanes than suburban roads, but they prove difficult for GNSS signal reception. This is because the large, crowded structures often result in line-of sight signals being frequently blocked. These environments are also susceptible to interference from a variety of signal sources which are transmitted adjacent to GNSS frequency bands. Finally, of the three environments, city centers are the most likely to experience multi-pathing, a phenomenon defined as the reception of echoes of the transmitted signals, often signals which have been reflected/diffracted. These multipath signals often have severe effects on the doppler and pseudo range measurements used to compute the user’s location, in some cases the position solution can be lost due the limited measurements.

For this reason, within the city centers the team will be testing for the combinations which produce the most consistent and least interrupted position solutions at each epoch. It was expected that these solutions would come at the cost of accuracy.

Within the scope of our project, suburban neighborhoods were viewed similarly to city centers. The error sources of multipath, interface, and loss of sight are applicable to this environment but are expected to be encountered at a significantly lower degree. The property which makes suburban neighborhoods distinct from the other environments is the large difference in road sizes. This results in a lower testing threshold for cross track accuracy with a larger deviation.

Finally, highways are most often less susceptible to the phenomena of multipath, interface, and loss of sight. The focus for this environment was strict accuracy measures as highways have small deviations. Large deviations in positioning accuracy can prove quite dangerous in high velocity environments.
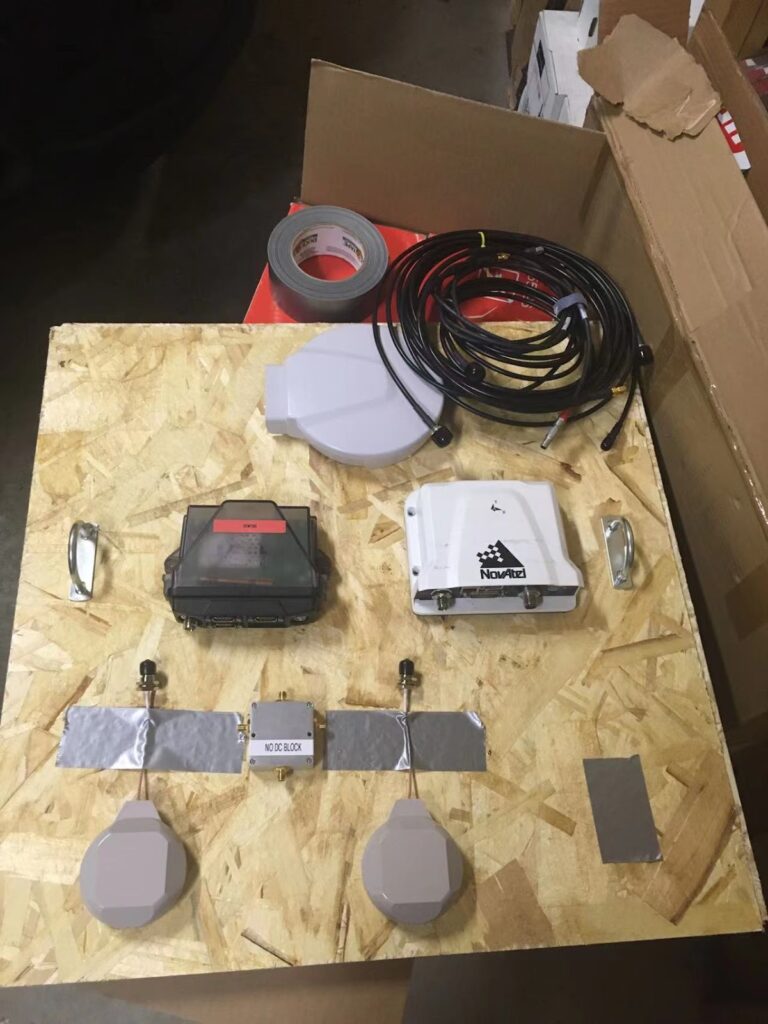
HARDWARE DESIGN
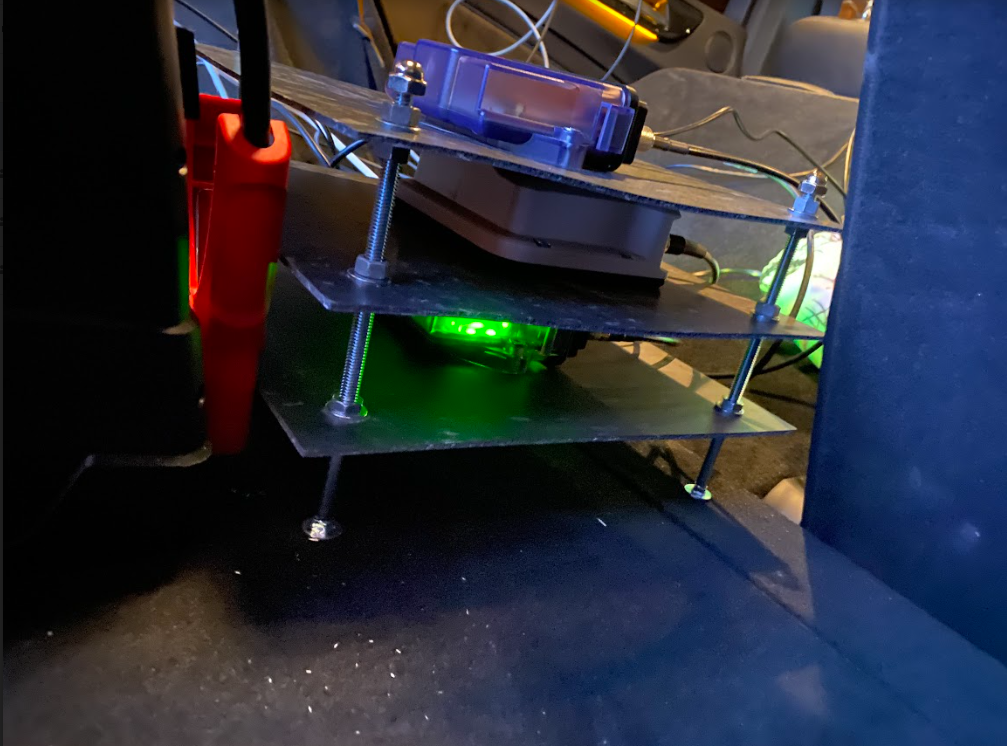
The physical design of this project went through many iterations, the goal was to produce a simple, reusable design which did not affect the solutions. The final design saw a three-tiered rigid structure with each module spread out approximately 6 cm (±1mm).
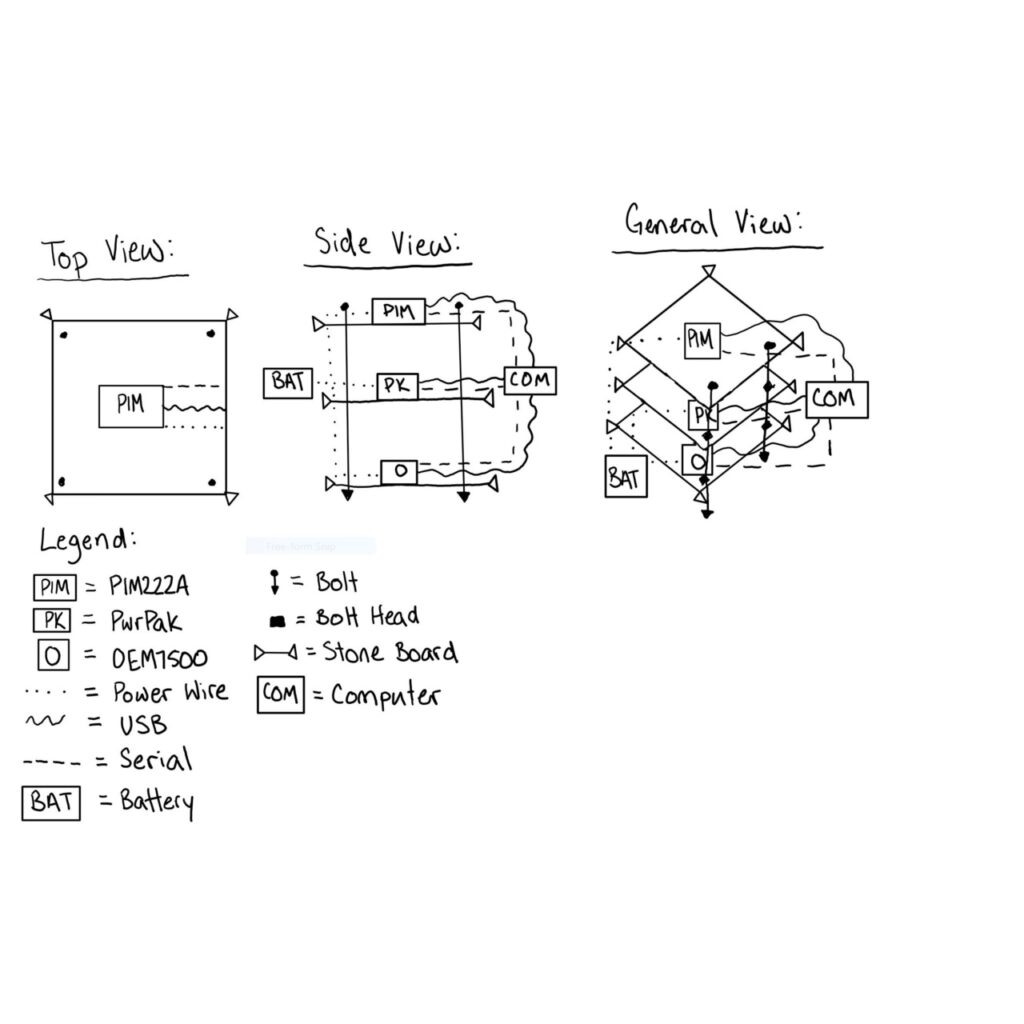
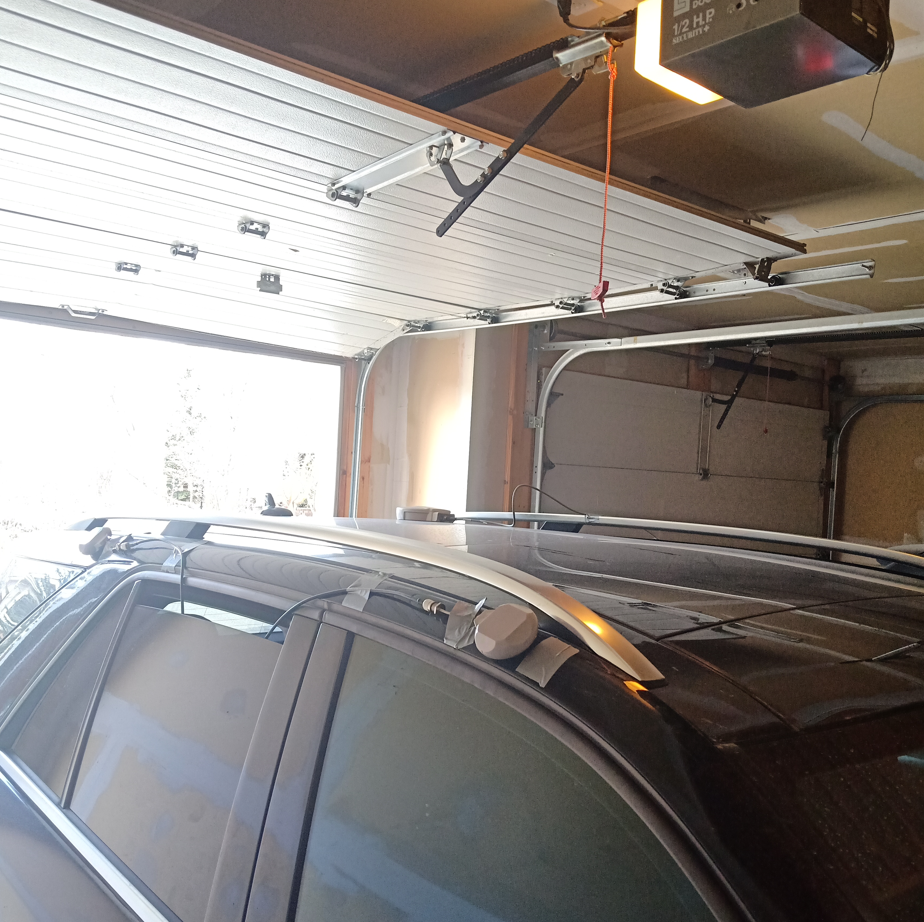
The rigidity of the structure was essential as early prototypes saw the structures created out of wood with the modules adhered to their respective platforms. This resulted in the IMU modules each shifting independently of the body (car). The final design sees the GNSS modules being bolted to their respective panels ensuring the modules move inline with the car, limiting all independent movement. The rigidity of the final panels allowed the team to have confidence in the module spacing, this confidence was not echoed in previous designs which saw the relative distance between modules shifting.


Finally, the design was arranged vertically as previous horizontally arranged prototypes saw tangling with all the wires. This final design allows for all cables to be neatly connected on one side and the vertical difference allows space for the wires to hang or to be taped down. During most tests, the structure was set up between the large external battery and the backseat of the vehicle.
SOFTWARE DESIGN
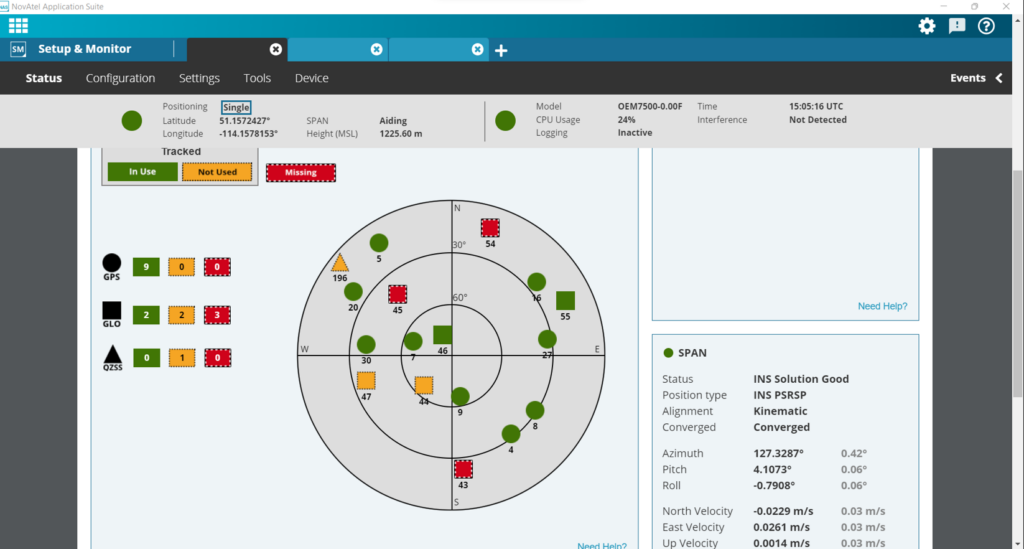
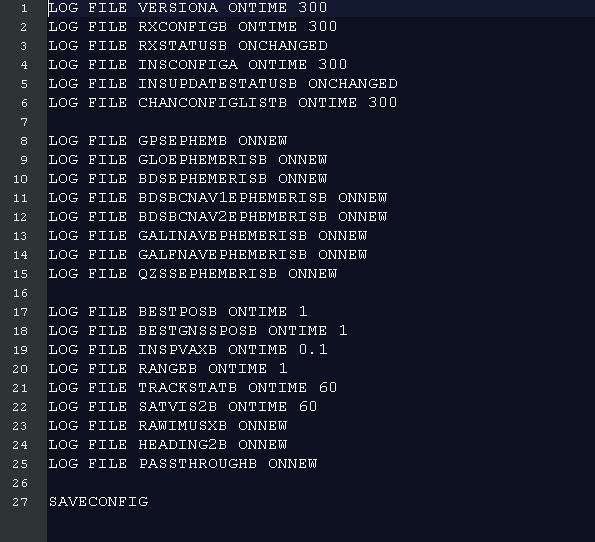
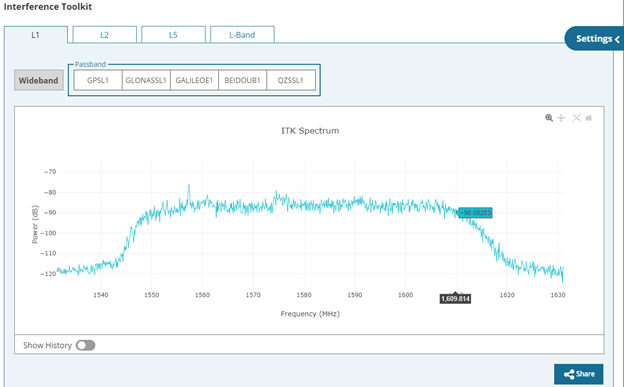
The NovAtel Application Suite (NAS) handled the configuration of the GNSS and INS modules and the data collection. The logs of interest were inputted into NAS as a file of commands. Once a data collection session was completed NAS would return large files containing the GNSS and SPAN (INS) logs.
These files would then be converted from .gps logs to ASCII files (.asc) using the NovAtel Convert application.
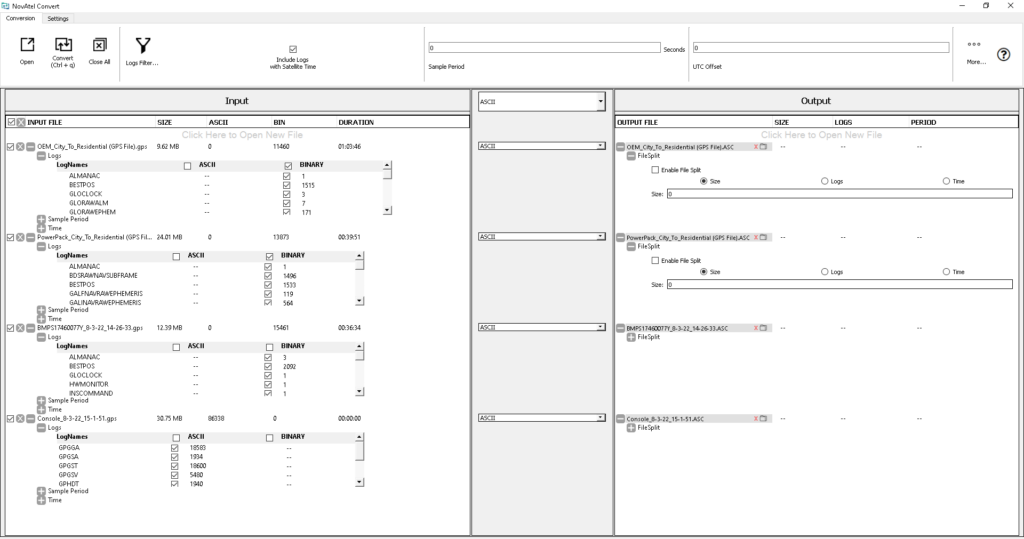
The ASCII files were chosen as they are more computer readable than .gps logs.


Each log had a different formatting structure, with most of the data being encoded as either an integer, float, short string, or hexadecimal value.
The team decided to build an application which would effectively parse these logs into csv files with the data types displayed in the column headers. The .csv file format was chosen as it was not only machine readable but incredibly human readable which aided with debugging and data contextualization.
Each line of the ASCII file represents a GNSS or SPAN log at a given GPS time, the first twelve fields are known as the header which indicates the structure of the rest of the file or body. The end of the header is denoted by a “;”.

Of these twelve fields the second field gives the name of the log, each log name has documentation which details the meaning of each data field in the body and how it is encoded.
The methods which comprise the “parse data” function work by reading the file line by line, for each line a “GNSSLine” object is created which is composed of a Header object and a Body object. The program separates the header from the body and parses the header text line into their respective Header object variables. The program then analyzes the header for the log name (known as “command”), this command dictates the “Body Type” object which is attributed the Body object for the given line.
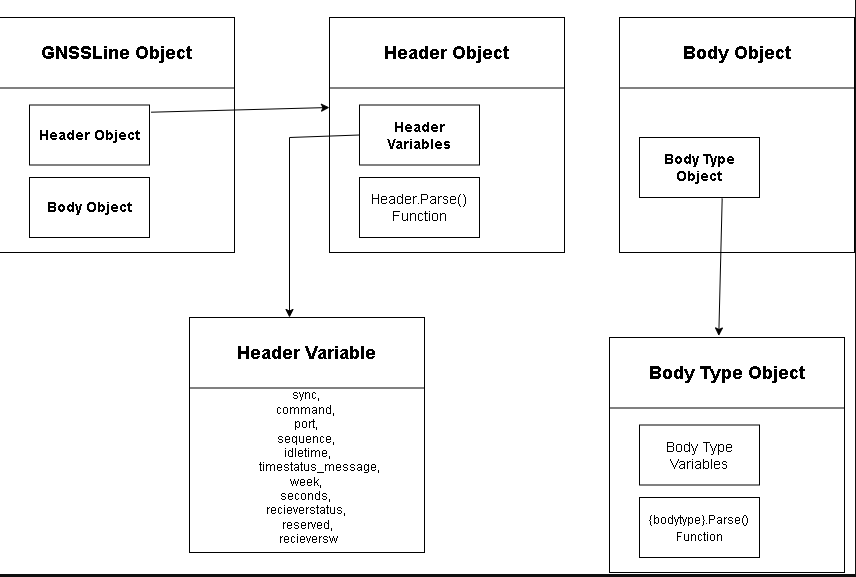
The variables encoded as integers, floats, and strings are checked against a python dictionary with the key being the value which appears in the ASCII file and the value being the full that the code represents.
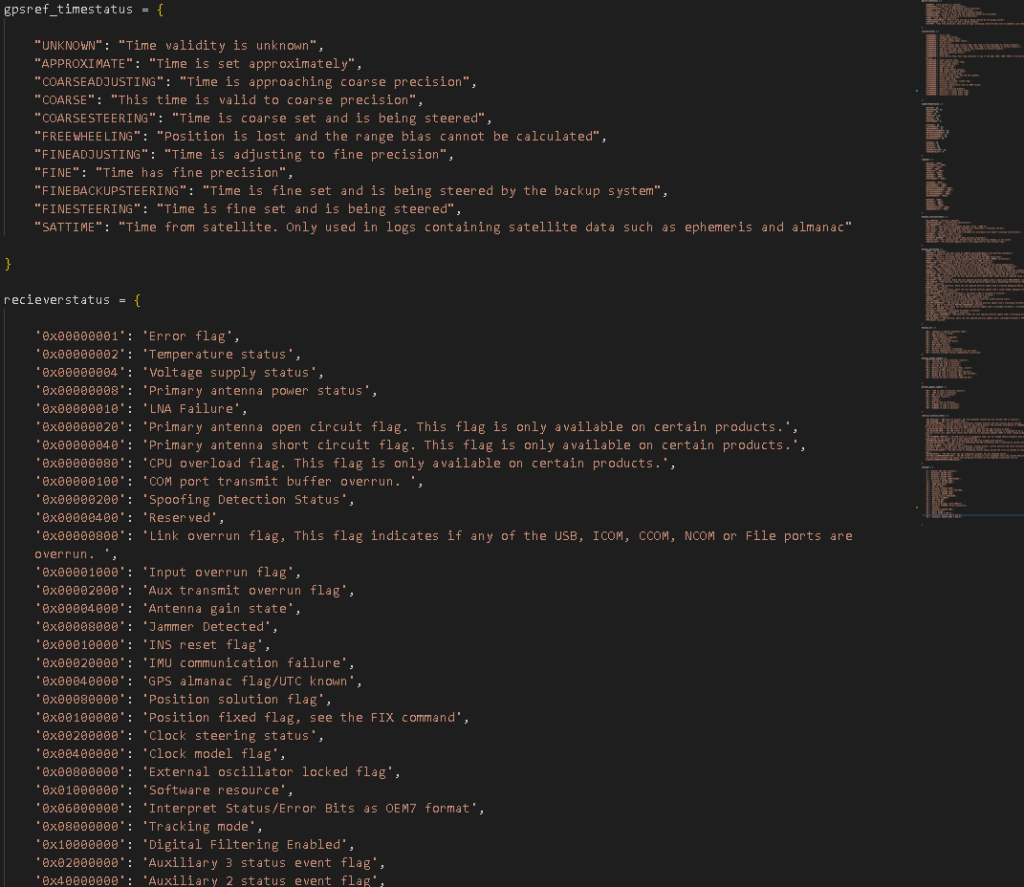
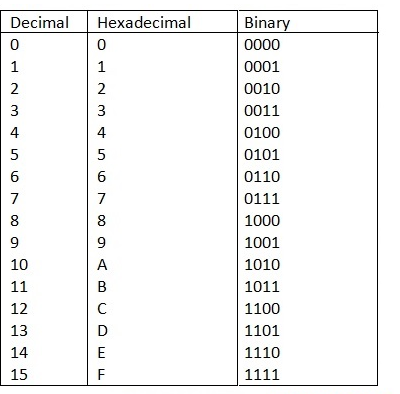
Hexadecimal code masks are handled a similar way but with an additional hex to binary conversion step performed first by the program.
Once the Header and Body Objects are fully constructed, the GNSSLine object for the current line is added to an array which represents the whole file. The organization of the program allows for easy search. For example, the ith index of the array provides the GNSSLine object for the i + 1 line meaning users and additional functions can easily search for variables of interest.
The “Get” functions simply find the variables of interests and groups them together in .csv format with their column header information.

The program is contained in the GNSS Log Parser application for ease of use. Though, currently the success and error messages still display to the terminal. The team intends to have the messages appear within the application if time permits.
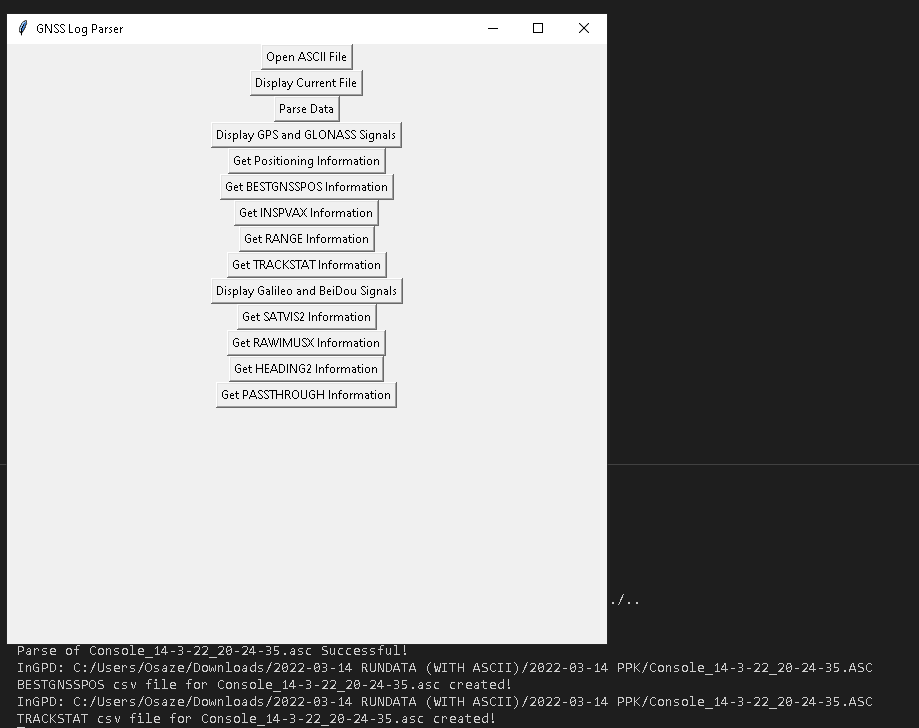
Click Here to view the GitHub repository containing the parsing script.
DATA ANALYSIS AND VISUALIZATION
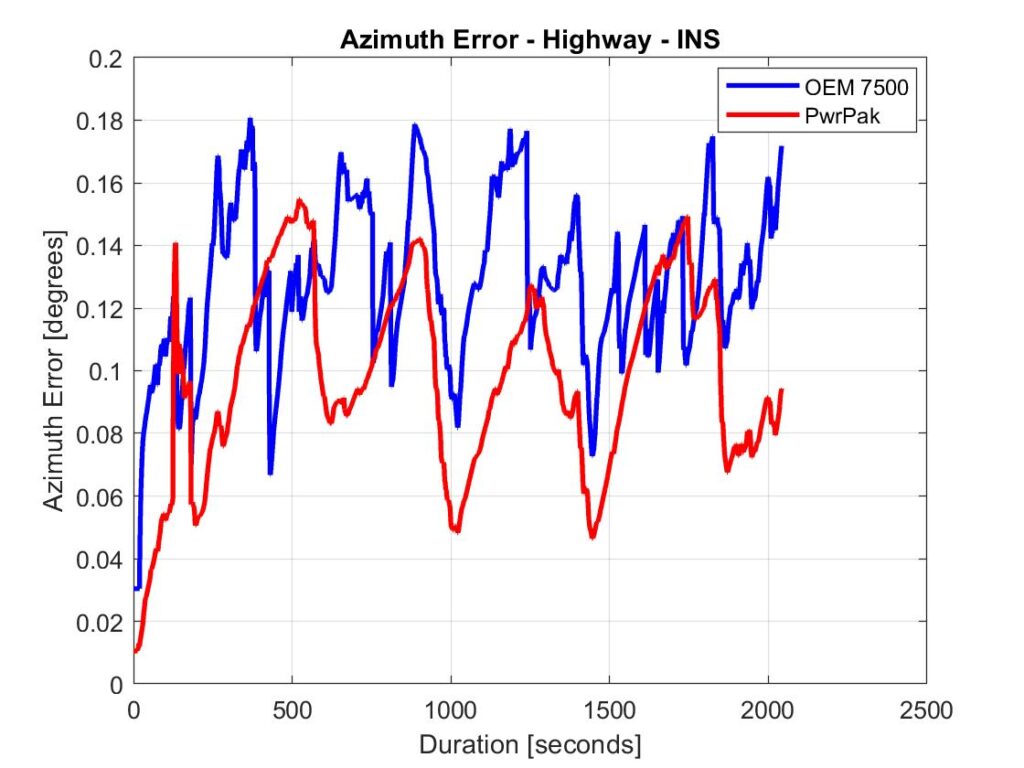
Currently, various functions are being designed in MATLAB to quickly take the outputted CSV files and develop contextual plots. The goal is to produce another application which would allow users to select a GNSS Log CSV file and select parameters to be plotted. Below are a few of the plots generated using the analytical tool, created in MATLAB.
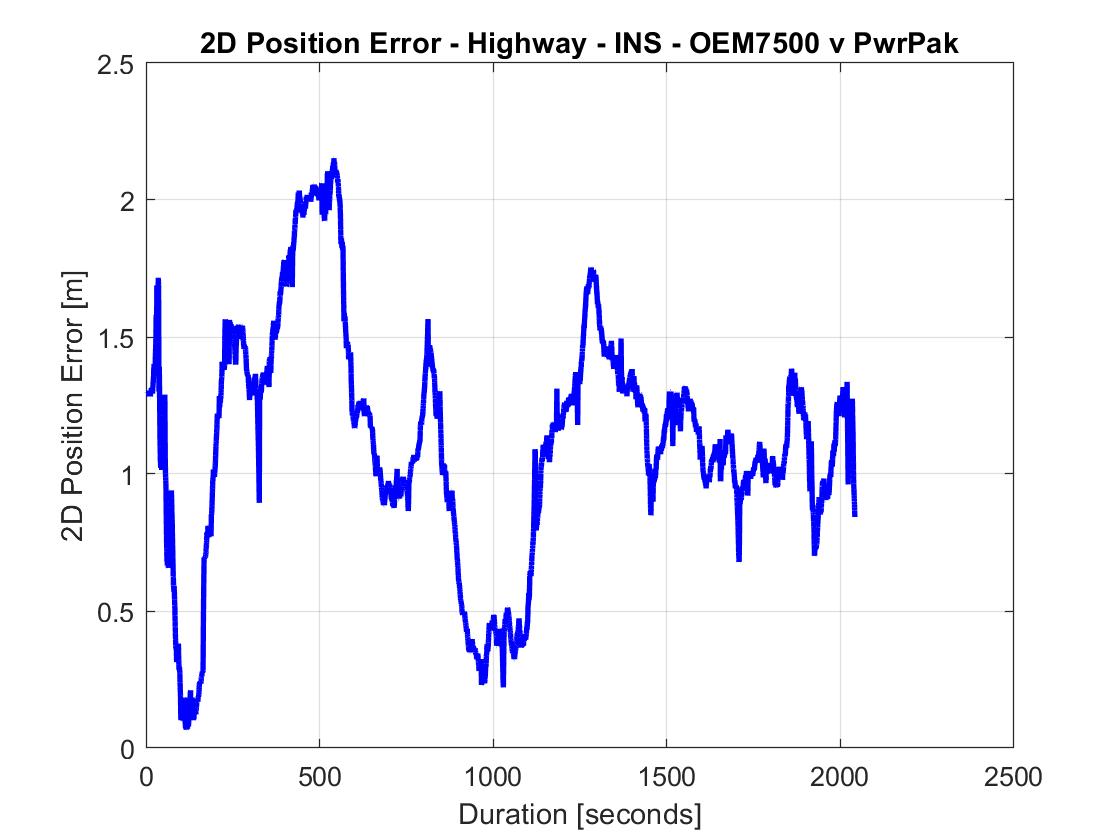
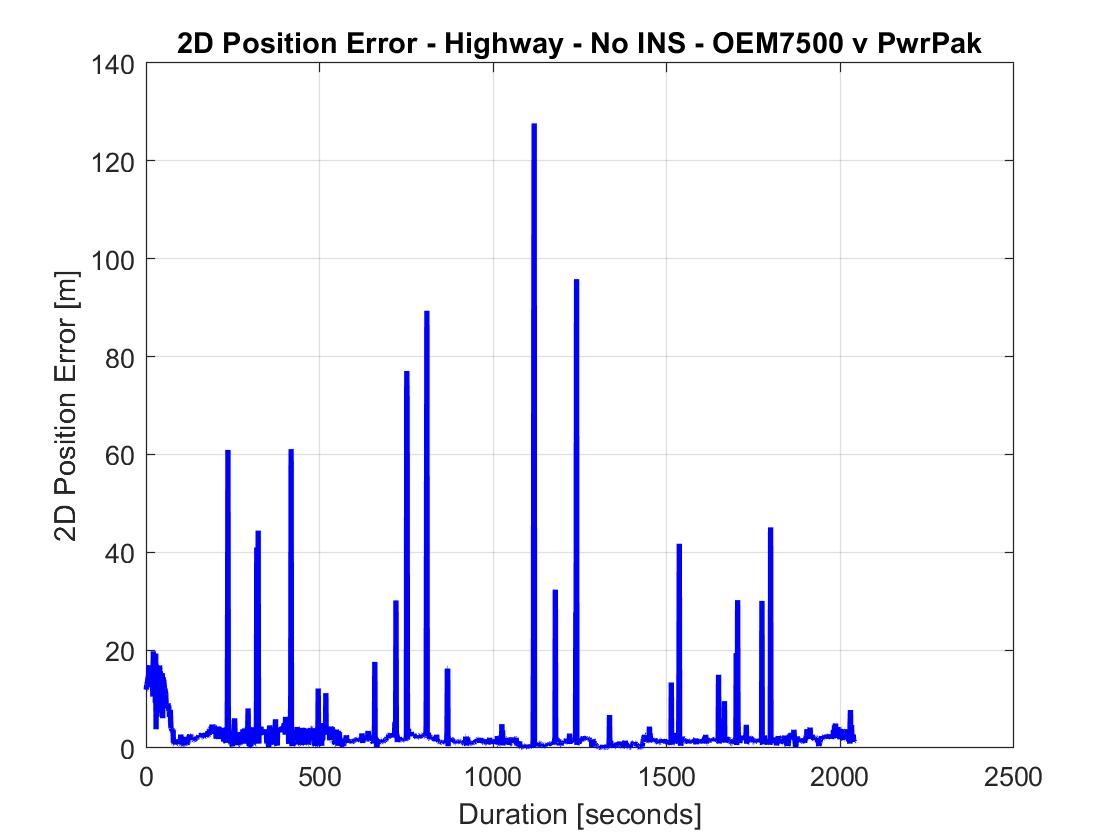

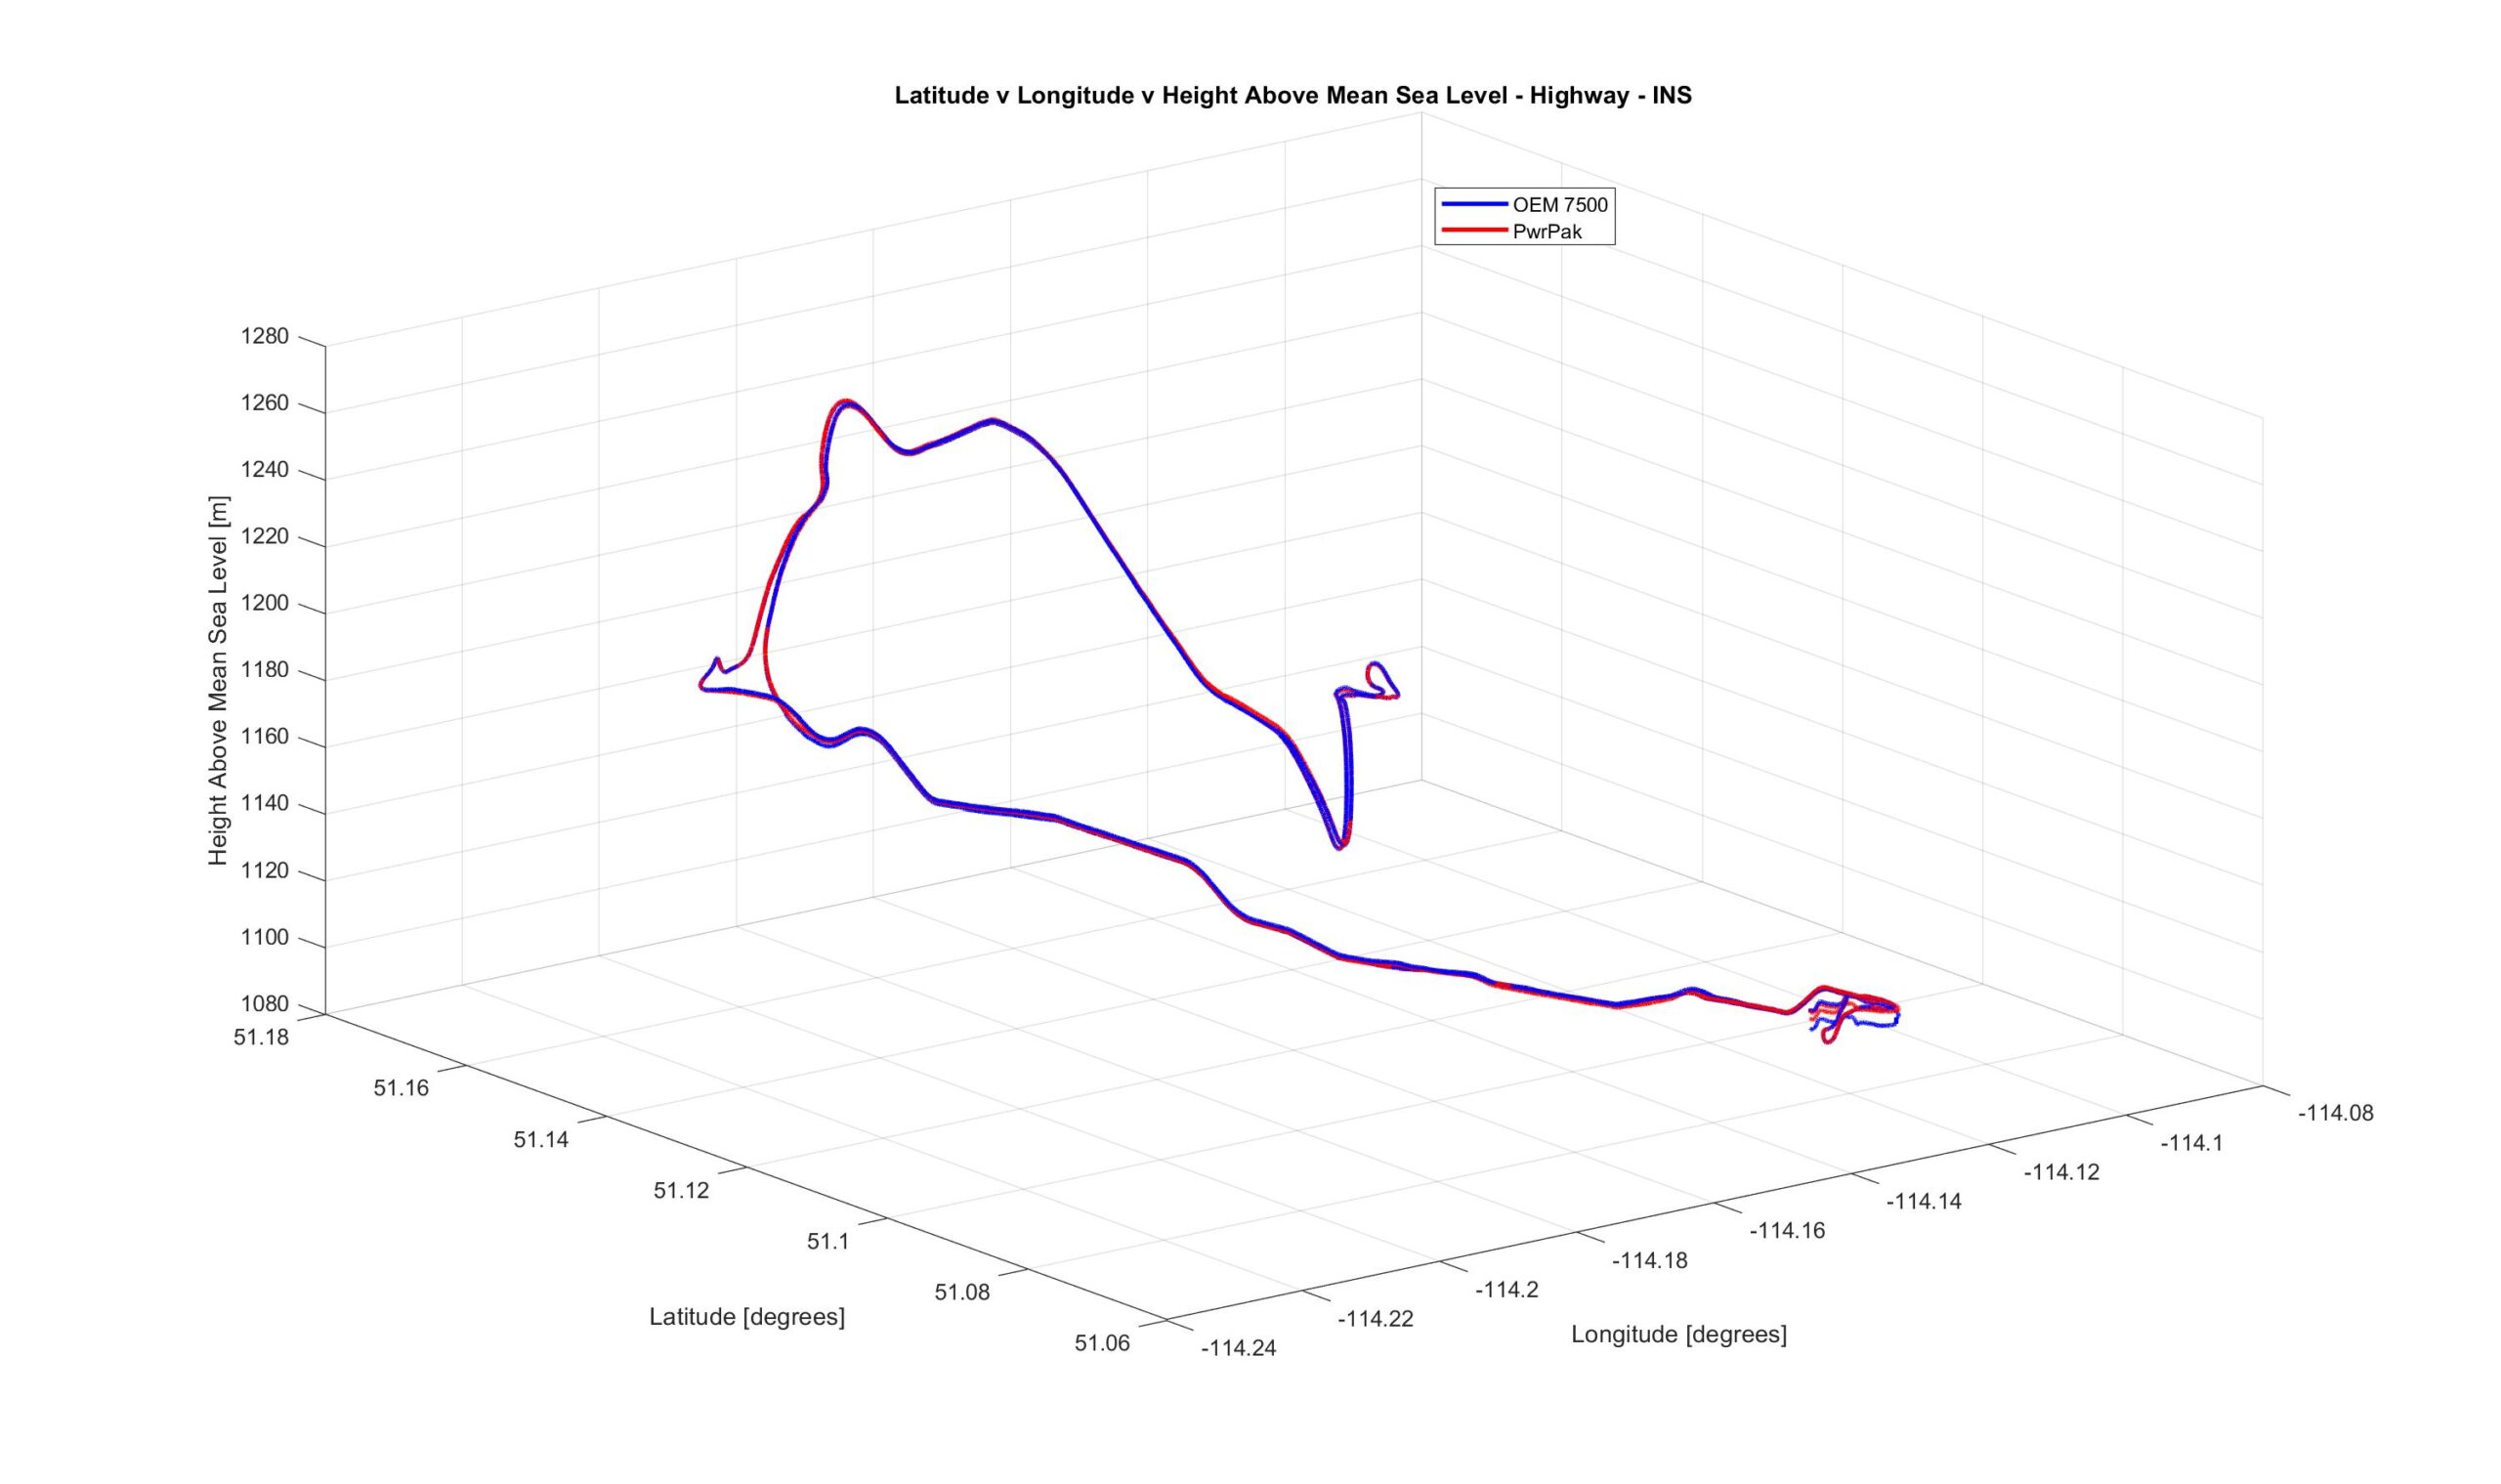
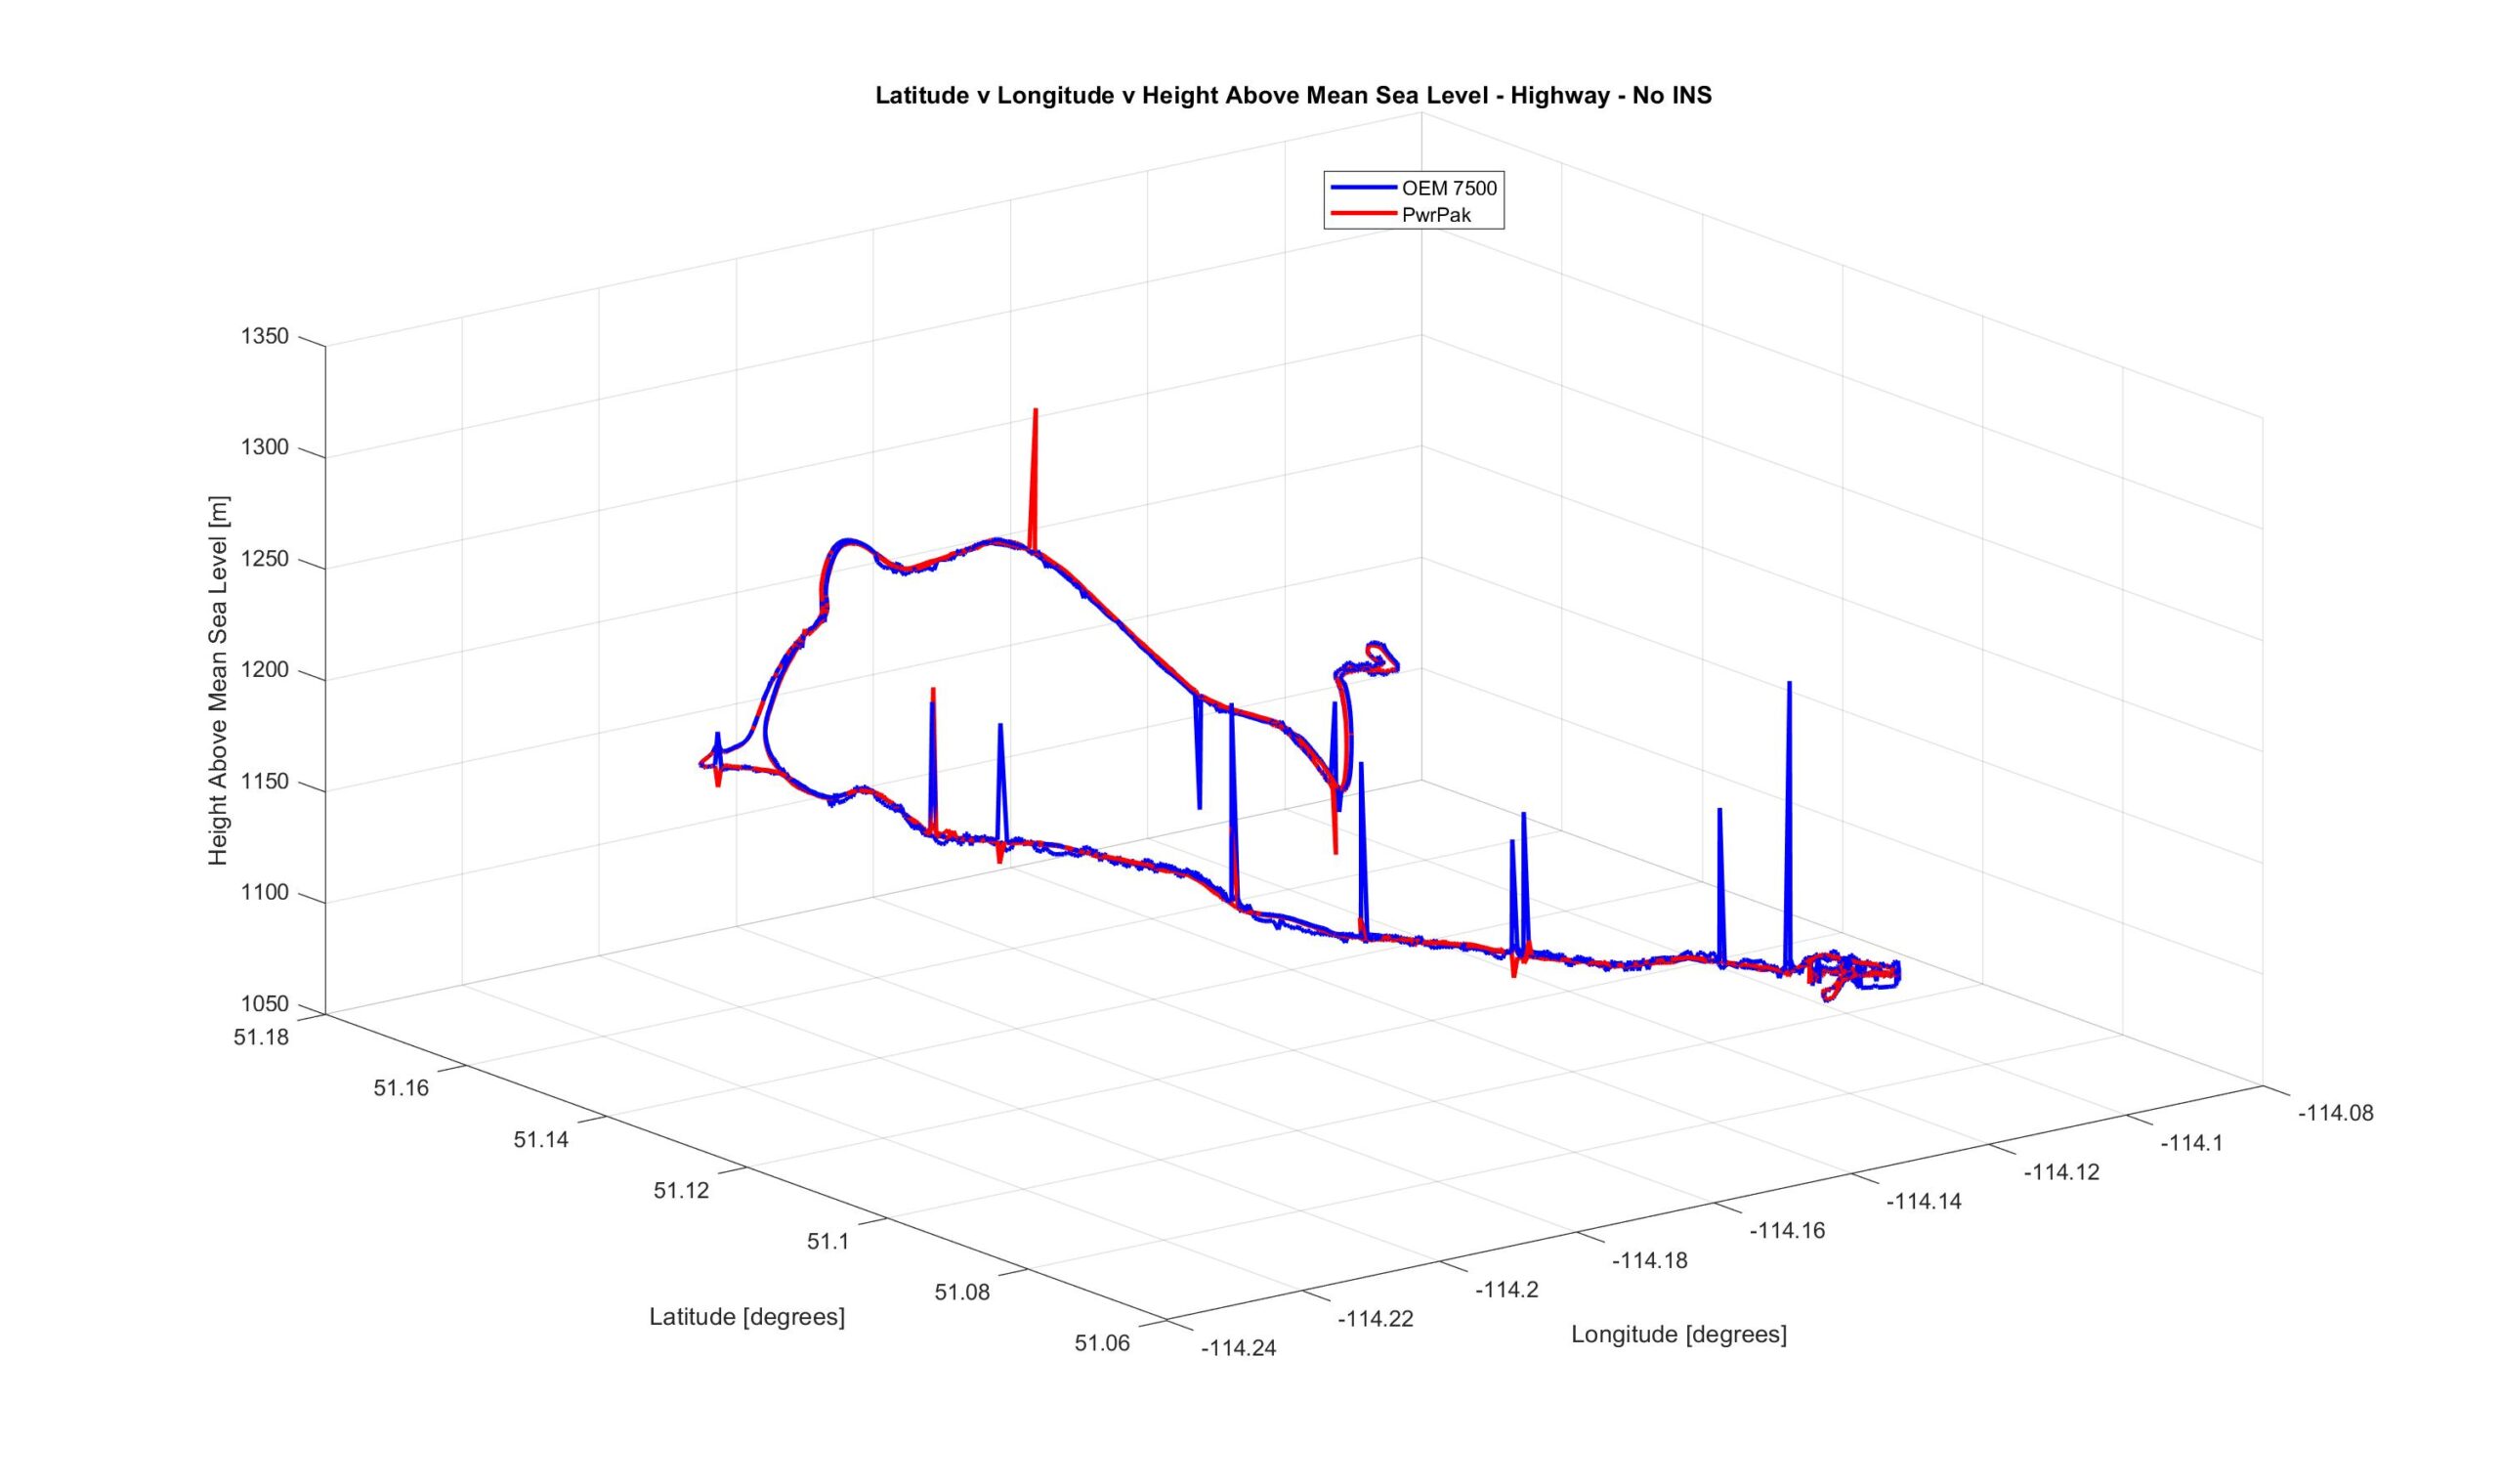
Click Here to view the GitHub repository containing the MATLAB analytical script.
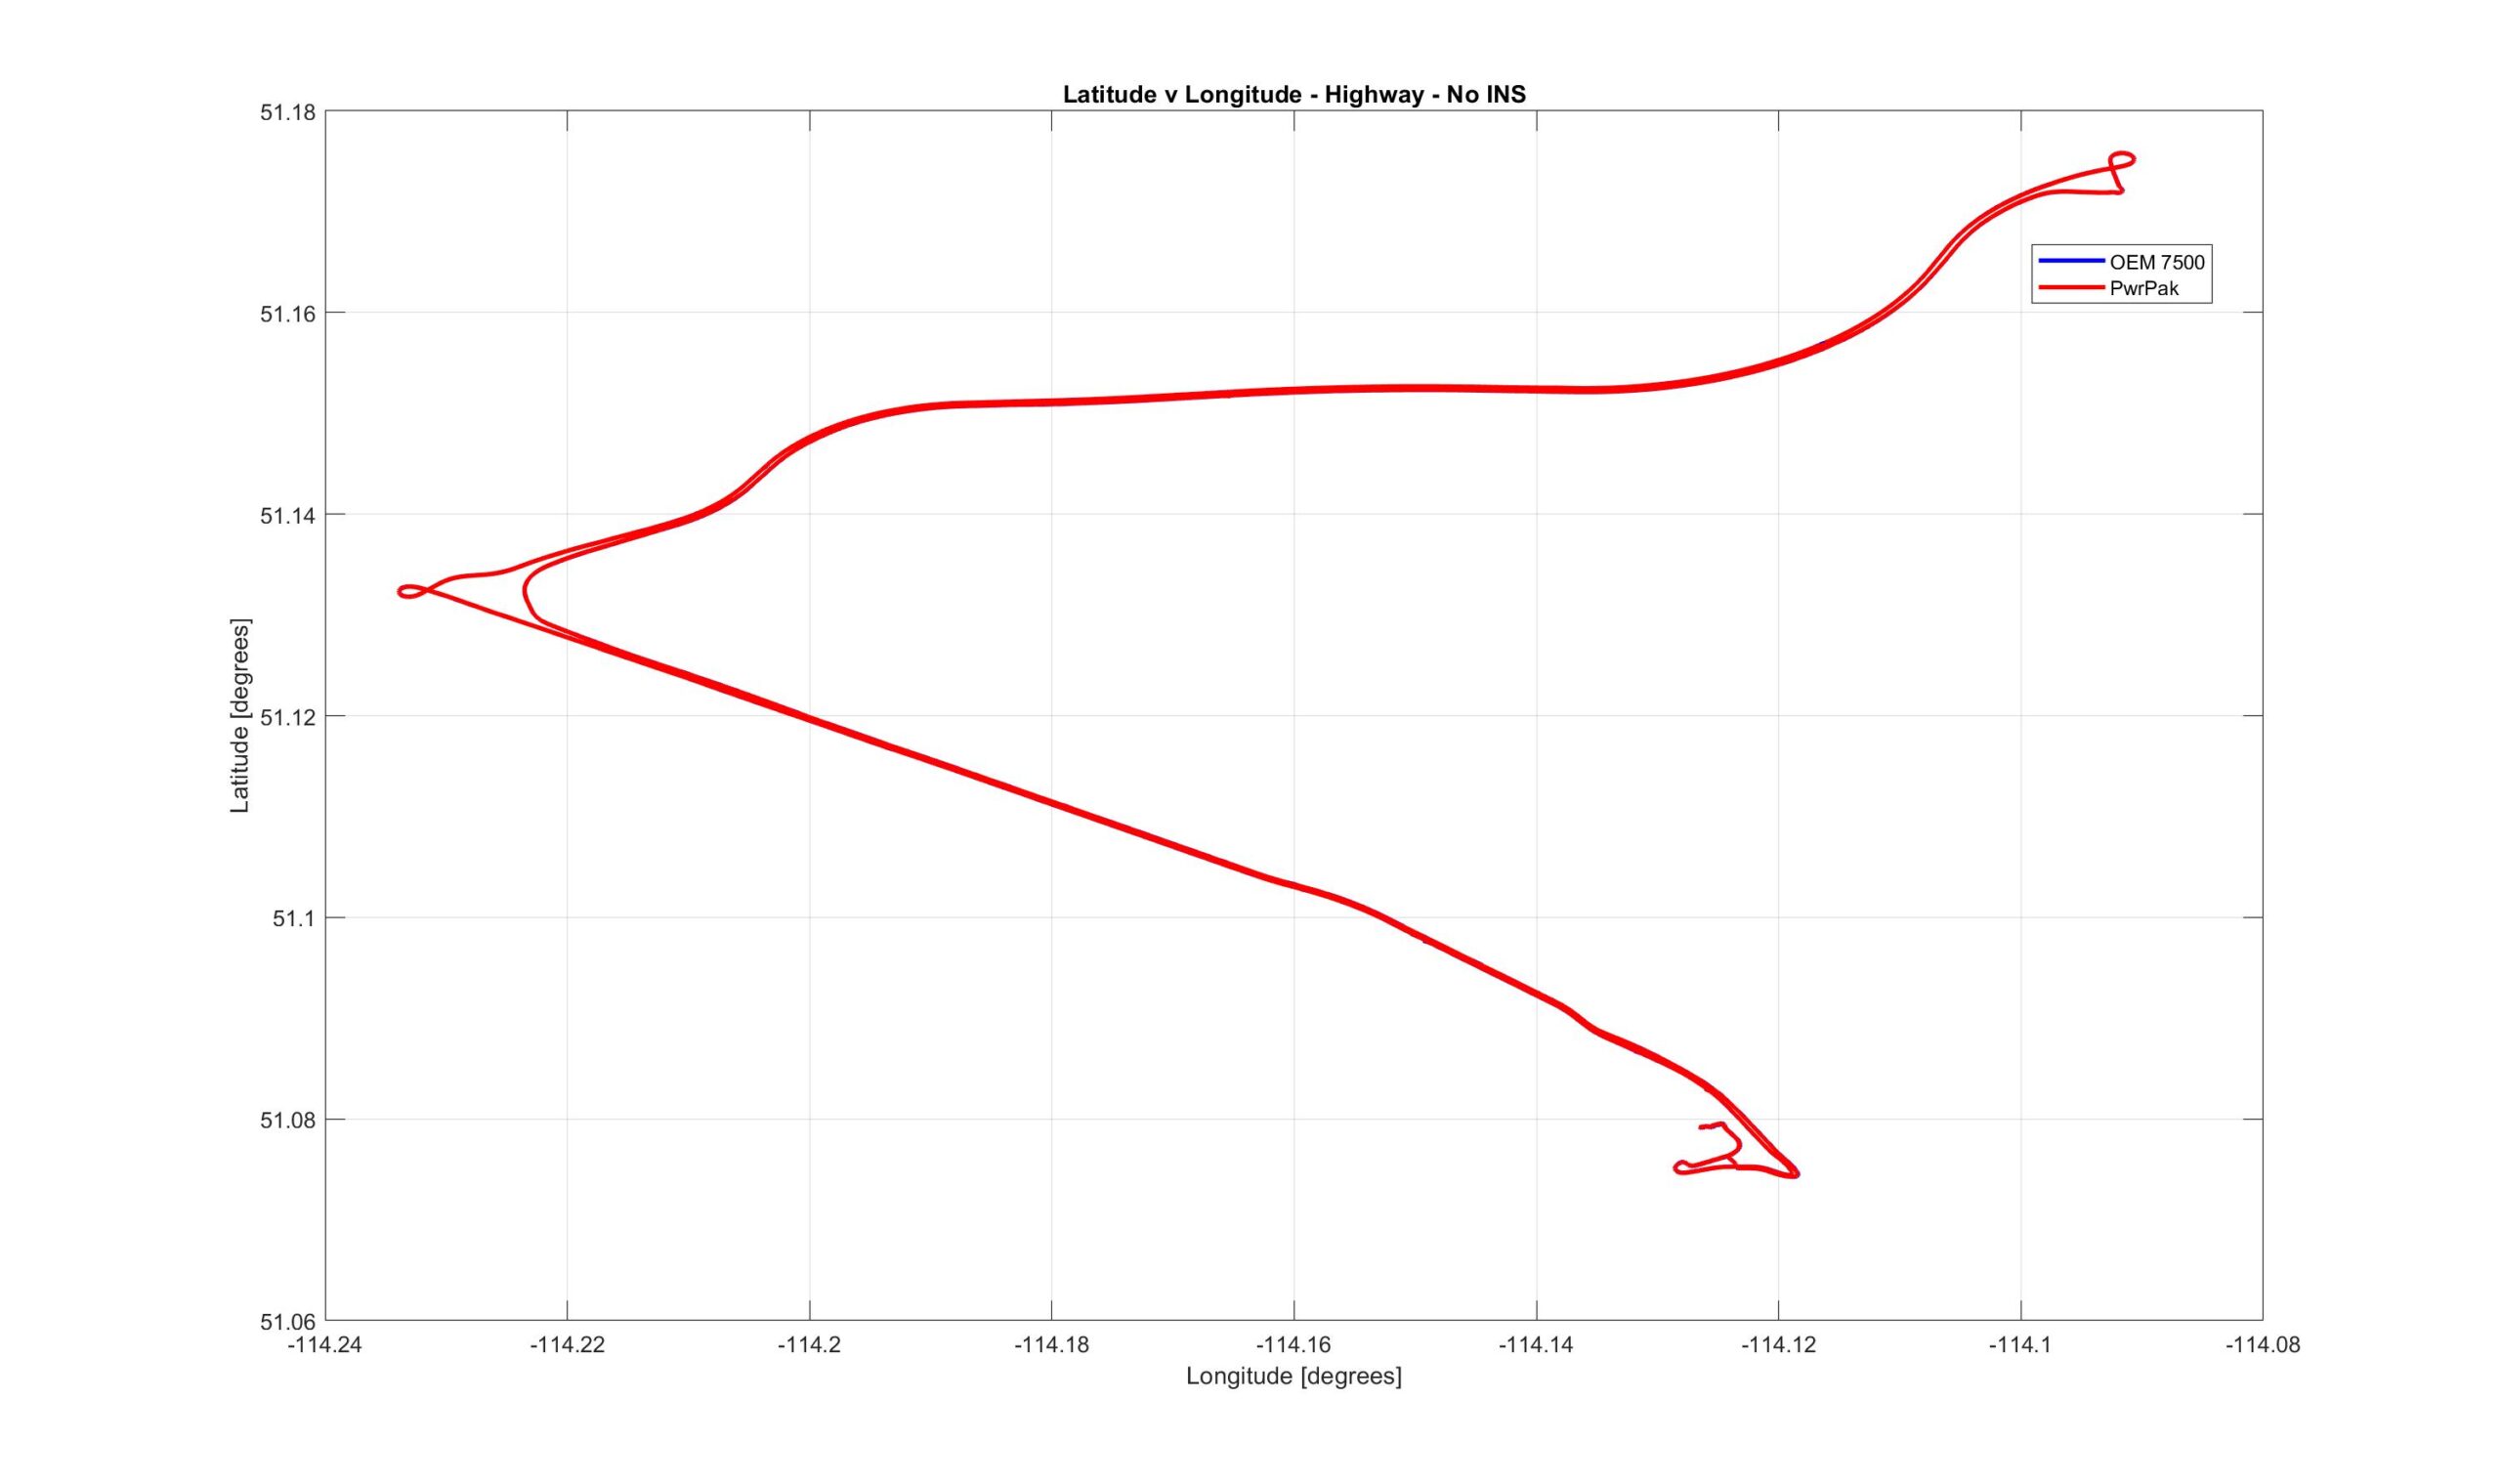
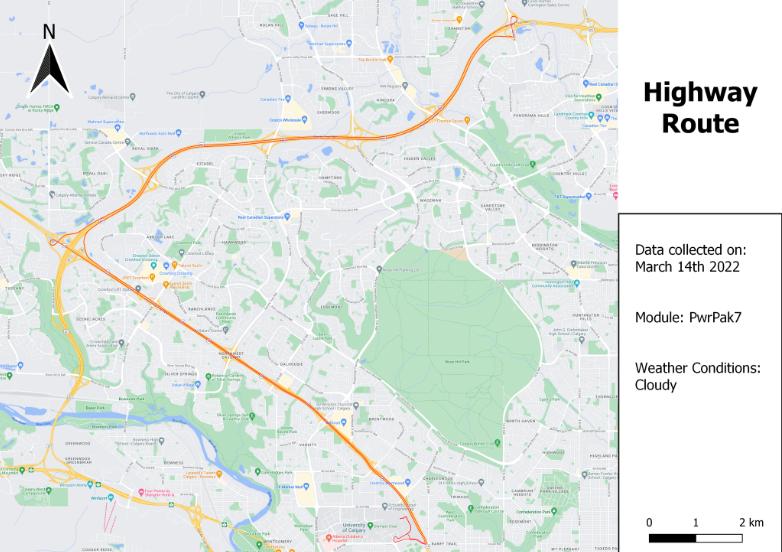
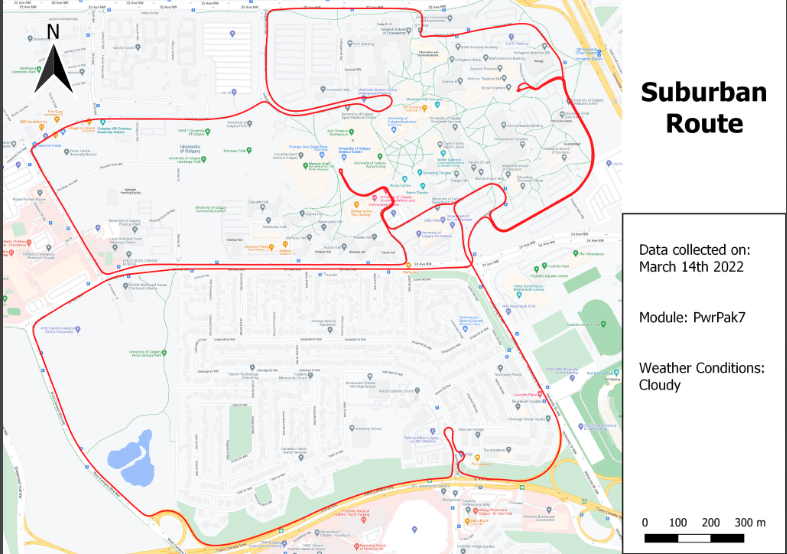
The positions provided from the modules were also plotted on a map to better contextualize the data.
Partners and Mentors
We want to thank the many people who helped us with this project. Our advisor from NovAtel, Bryan Leedham, went above and beyond while guiding us through every step of our project. Bryan’s coworker, Joe Chen, went out of his way to assist our team with understanding and using the PIM222A unit for our data collection.


Our Photo Gallery

References
- Developments in Modern GNSS and Its Impact on Autonomous Vehicle Architectures. Authors: Niels Joubert, Tyler G. R. Reid, and Fergus Noble. Published 2020 April 19: https://arxiv.org/pdf/2002.00339.pdf
- ENGO 500: Geomatics Engineering Capstone Team Design Project, 2021-2022 List of Projects, Project 8, Author’s name: Bryan Leedham PEng, NovAtel/Hexagon
- Automotive – Driving towards autonomy, Novatel/Hexagon 2021 Autonomous Vehicles
- What is AEB? Thatcham research, 2021 https://www.thatcham.org/what-we-do/car-safety/autonomous-emergency-braking/
- Lane Departure Warning, Nissan, 2021 https://www.nissan-global.com/EN/TECHNOLOGY/OVERVIEW/ldw.html
- Wi-Fi-Based Effortless Indoor Positioning System Using IoT Sensors, authors: Muhammad Usman Ali, Soojung Hur, and Yongwan Park, Published online 2019 Mar 27. doi: 10.3390/s19071496 Wi-Fi-Based Effortless Indoor Positioning System Using IoT Sensors
- SURFACE VEHICLE RECOMMENDED PRACTICE (R) Taxonomy and Definitions for Terms Related to Driving Automation Systems for On-Road Motor Vehicles, Issued 2014-01 Revised 2021-04, Downloaded from SAE International, Thursday, October 21, 2021 https://www.sae.org/standards/content/j3016_20210
- Product description, NovAtel, 2021-2022_ENGO500_Team6_LoanAgreement.pdf
