NAVIGATION
Project Category: Mechanical
Connect with us live
April 13th 2021
10:00 am – 12:30 pm
Problem Statement
To design a rotating machinery rig and use empirical data to predict bearing failure and prevent system downtime.
Why should we care about predicting failure?
Downtime has a big impact on profitability: in 2016, the total losses among ~80 US manufacturing companies due to preventable maintenance issues was 119.1 billion USD [1]. As such, being able to predict failure and prevent it through maintenance is important.
Our project has two main goals:
- The design and specification of a modular rotating machinery test rig
- The use of empirical data to predict and prevent bearing failure in a data-driven manner
Inside the rig, a bearing with a known fault will be inserted, and the resulting vibration profiles will be recorded and analyzed. A modular rig design allows for any future use cases to be tested such as measuring torque or torsional vibration.
[1] https://nvlpubs.nist.gov/nistpubs/ams/NIST.AMS.100-34.pdf
Click below to view our video detailing our design.
Meet the team

Overall project manager and leader, accelerometer selection, scheduling, data processing and analysis, visualization.
Previous VP Mechanical Engineering of Schulich UAV. Enjoys coding, investing, and soccer in his free time.

Management of mechanical design team, resource, budget, cost-savings options research, video creation. Helps out all around.
Previous Project Manager at Project90 Plastics Project. Enjoys hiking climbing, and camping.

Mechanical system design and component selection, computer-assisted structural and failure analysis, mechanical team meeting notes.
Enjoys coding, video games, and basketball.

Creation of CAD models and assembly, 3D modelling of custom apparatus, manufacturing and assembly procedures.
Previous Schulich UAV team lead. Enjoys plane spotting and aviation.

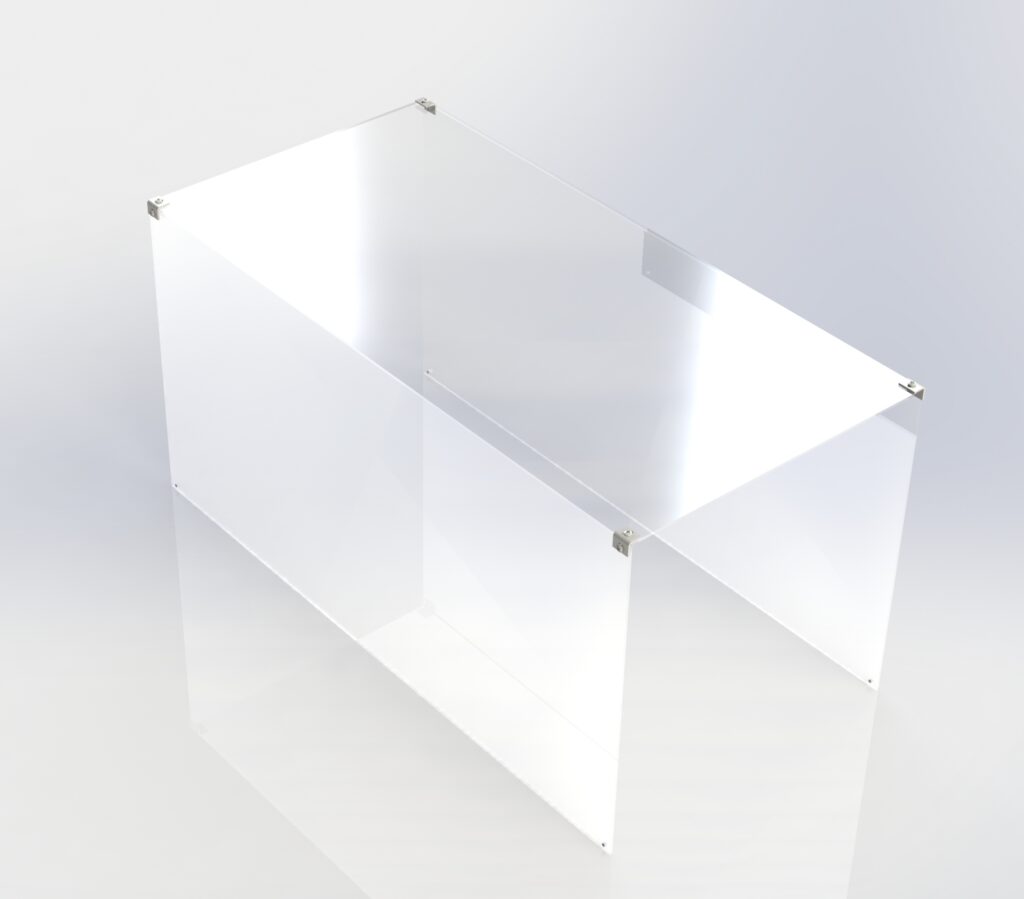
Encoder research and selection, DAQ system configuration, meeting minutes, safety shield, and website design. Supporting data analysis.
Co-President of Origami-Aid and loves to play tetris and solve Rubik’s cubes.

Torque sensor research and selection, DAQ selection, analytical structural and failure analysis, data analysis support, external meetings coordination.
Previous team lead at Schulich AeroDesign and loves to hike, shoot hoops, and fix cars.
Design Process and Deliverables
Click through the menus to see how we tackled this project, step-by-step.
1. Motivation
If we can predict when a bearing will fail and replace it before that happens, we can reduce costs by avoiding a catastrophic failure of the entire assembly. This is known as preventive maintenance (PM). Companies who rely on preventive maintenance instead of reactive maintenance can save three times more money on downtime [1].
In order to develop PM methods, we need empirical data. For this purpose, we designed a rotating machinery test rig with which the vibration profiles of bearings with embedded faults can be obtained.
[1] https://nvlpubs.nist.gov/nistpubs/ams/NIST.AMS.100-34.pdf
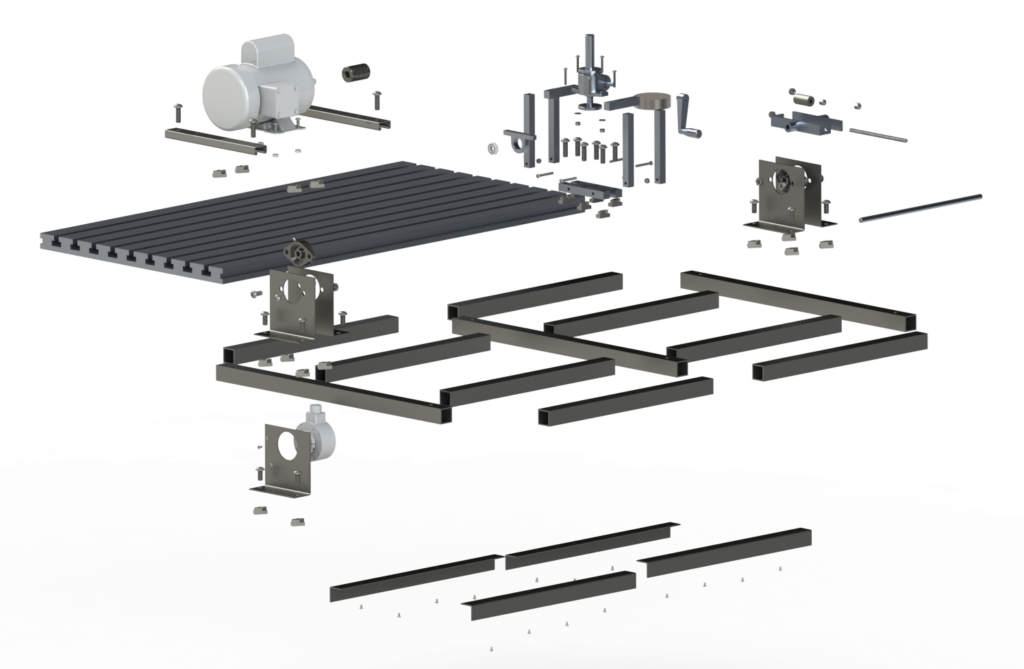
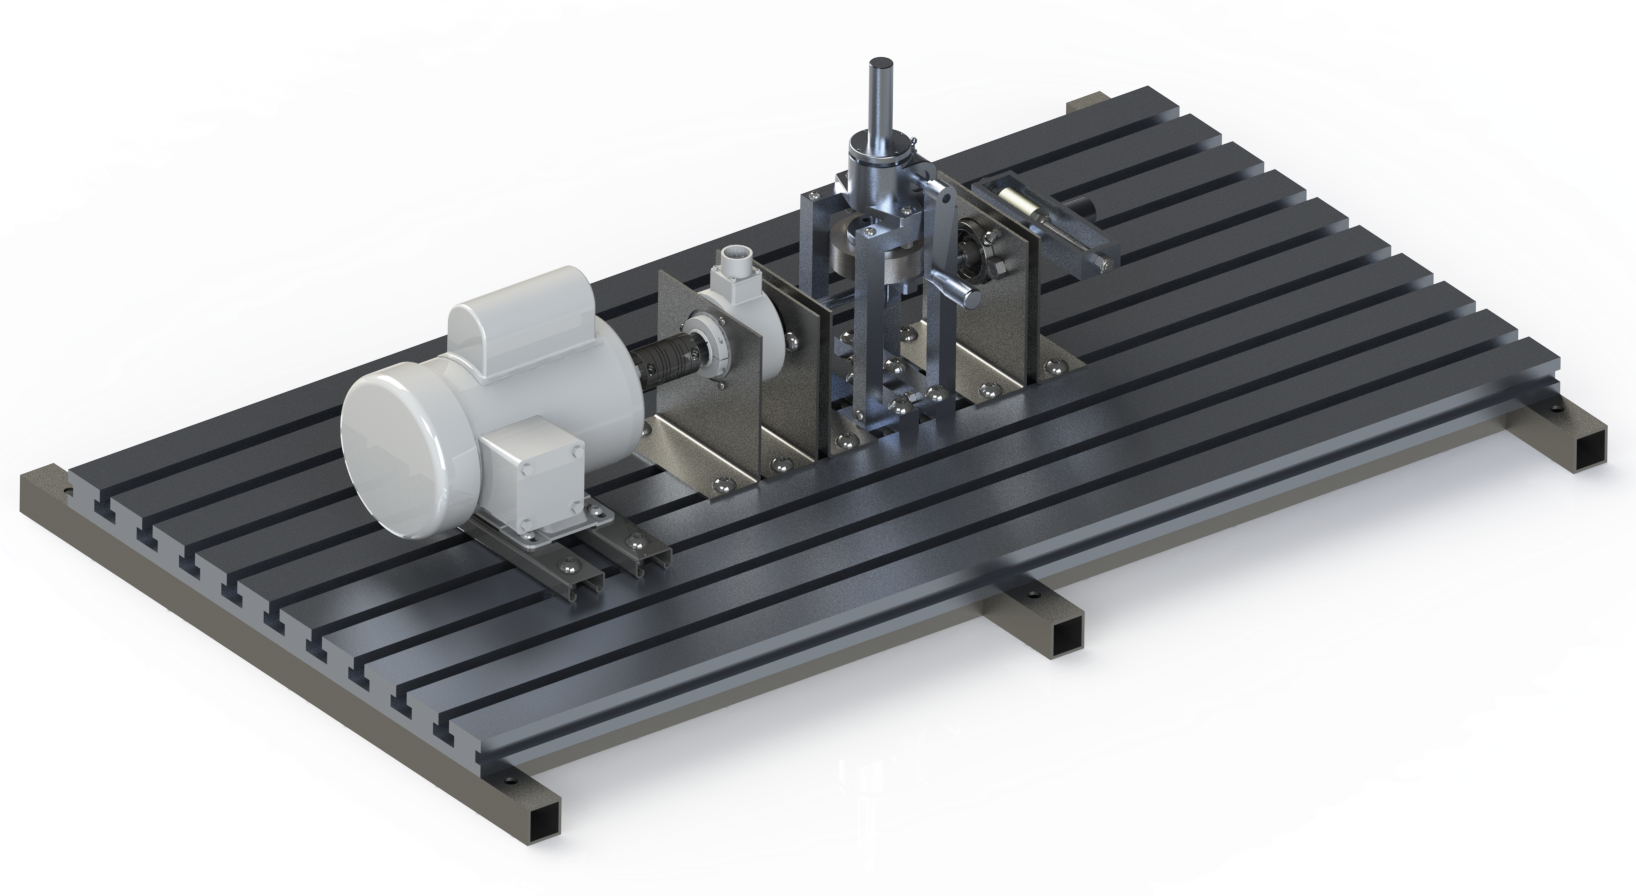
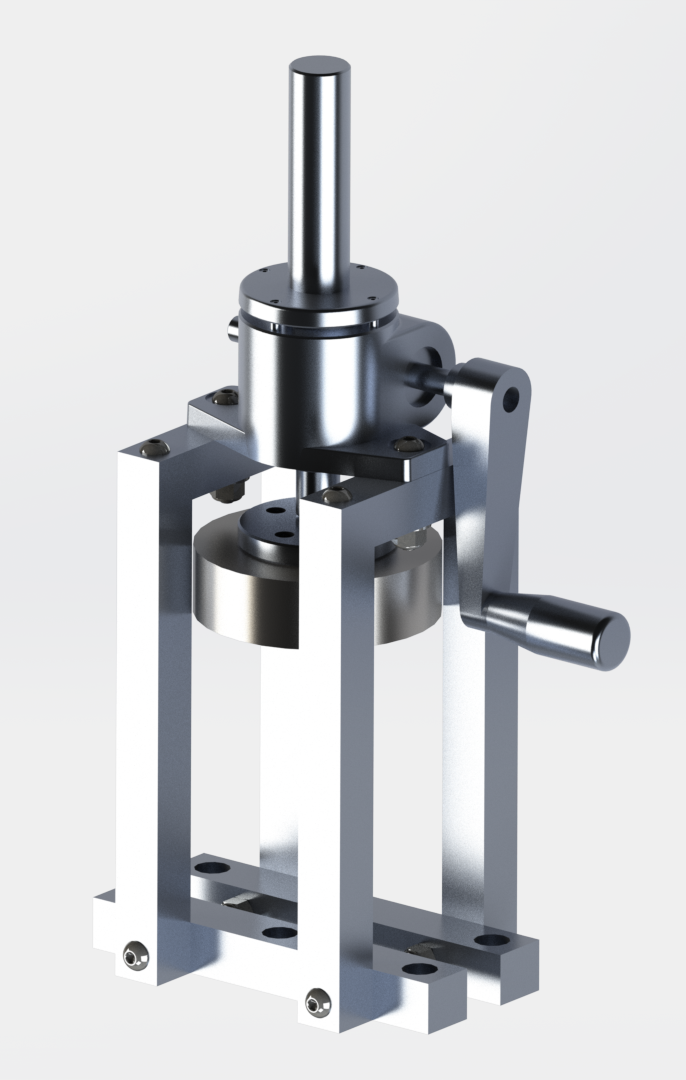
2: Design
To gather realistic data, our rig is designed to mimic the speeds and rotary operation of a wind turbine, at a maximum of 3000 RPM.
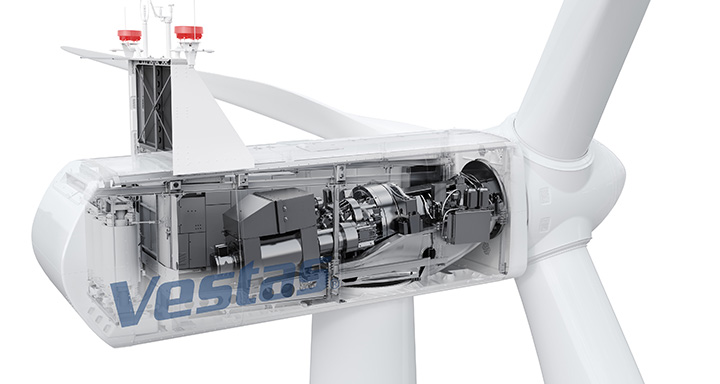
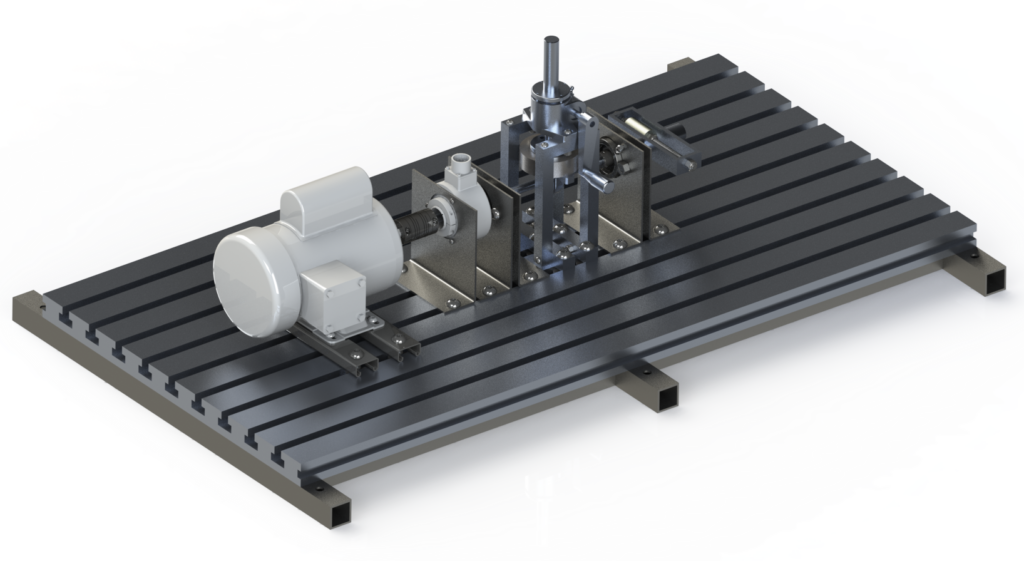
The components slide into the T-slot which sits on the ground to minimize vibrations. The T-slot allows for a modular design which enables future test cases, such as adding torque sensors.
[2] https://www.vestas.com/da/investor/financial_reports/2019/i_shareholderinfo
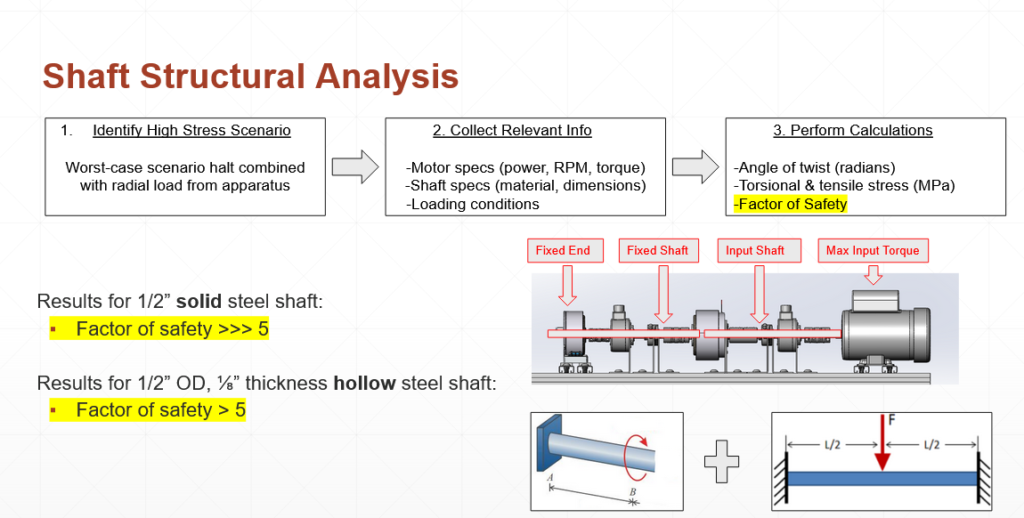
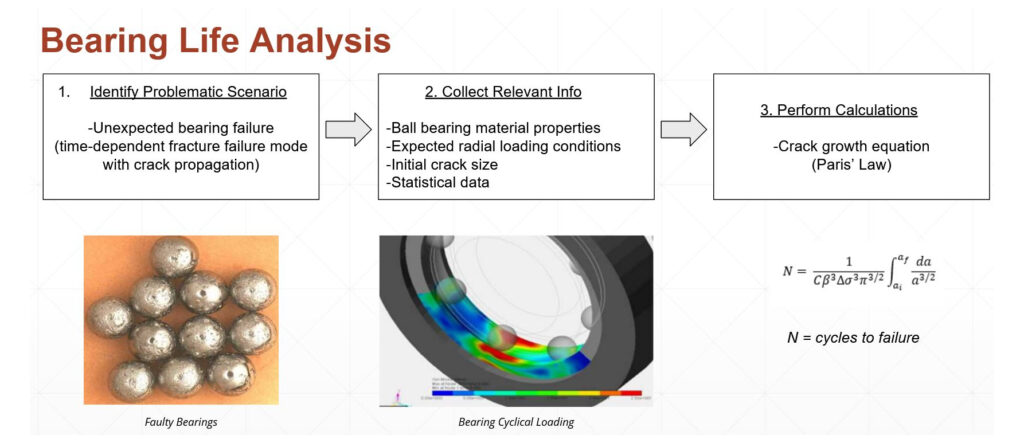
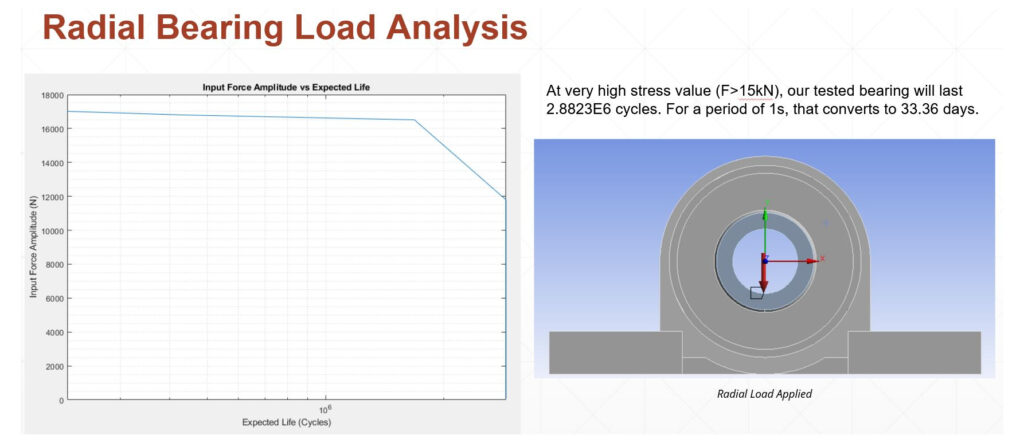
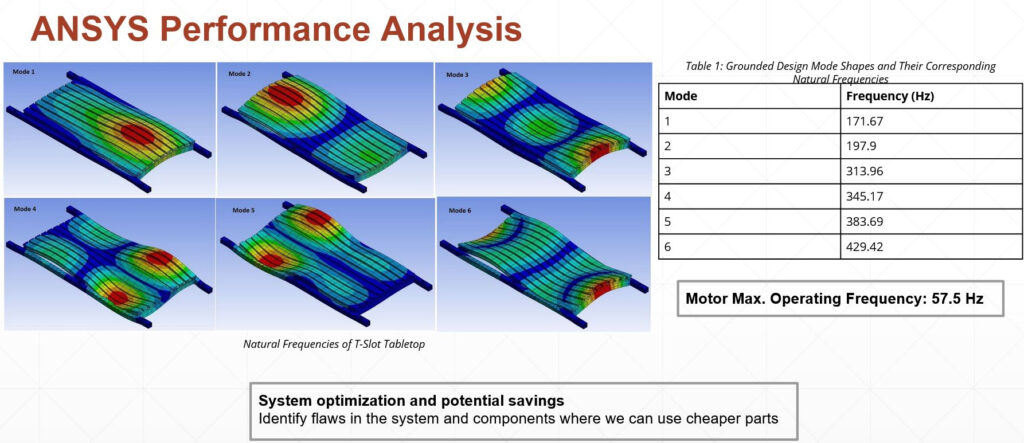
3: Safety Analysis
Due to the high RPM of the rig, safety becomes an important concern. We ensured the rig was safe from a structural perspective, and had sufficient safeguards in place.
For further information on the above calculations, feel free to visit our zoom chat or browse the gallery at the end of the page.
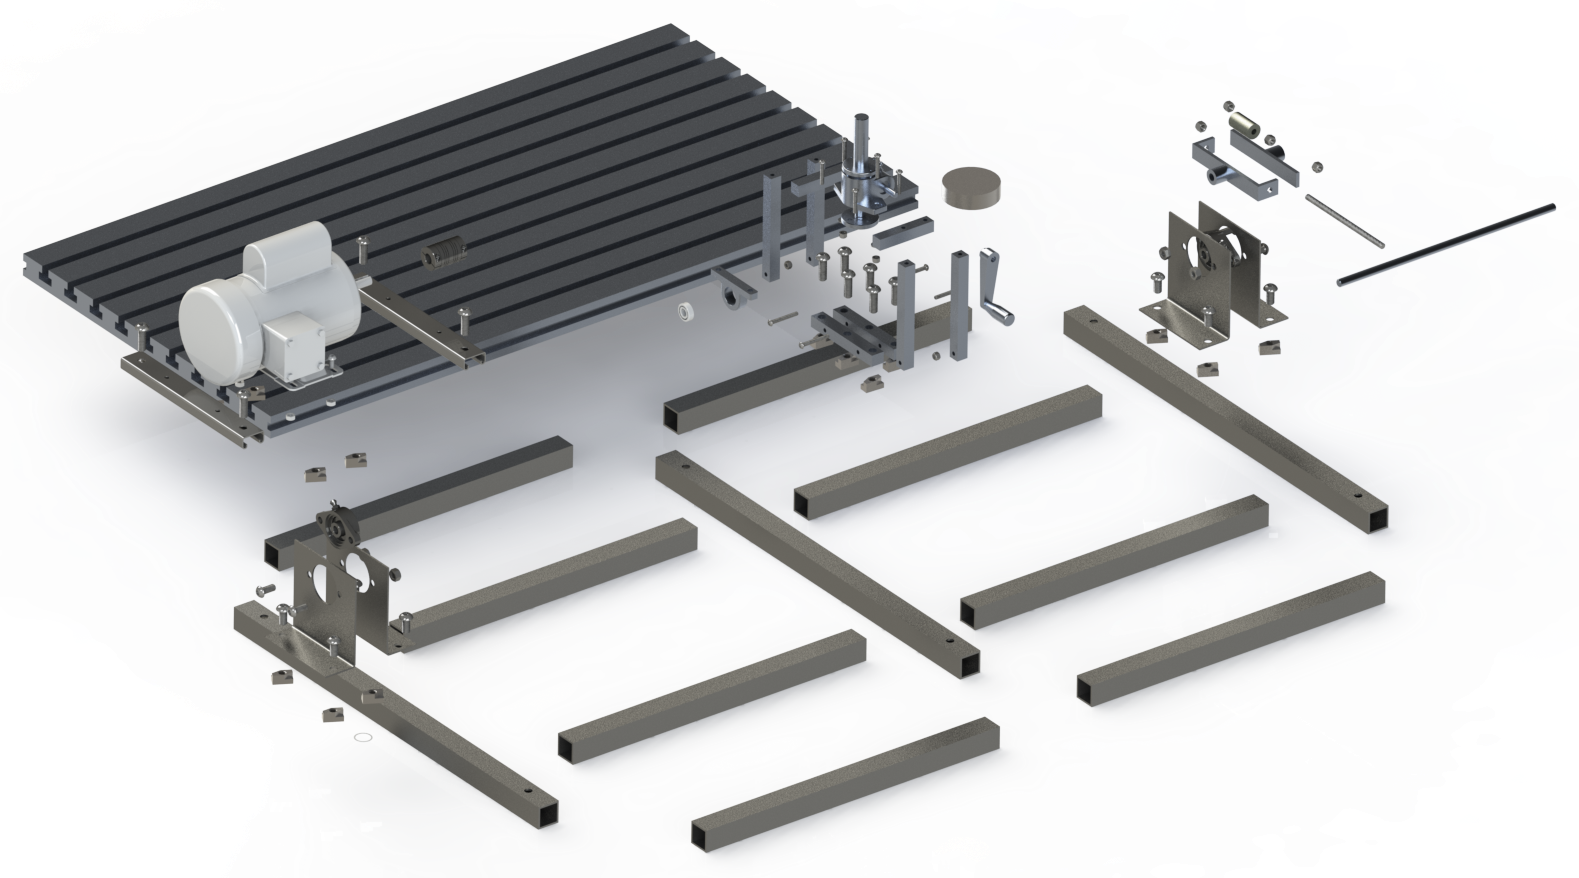
4: Manufacturing and Assembly
To increase usability and reduce labour and costs, the rig was designed to:
The chosen design is a T-slot tabletop in which individual components can be added via T-slot legs on right angle supports.
Parts that are to be machined include:
5: Data Acquisition (DAQ)
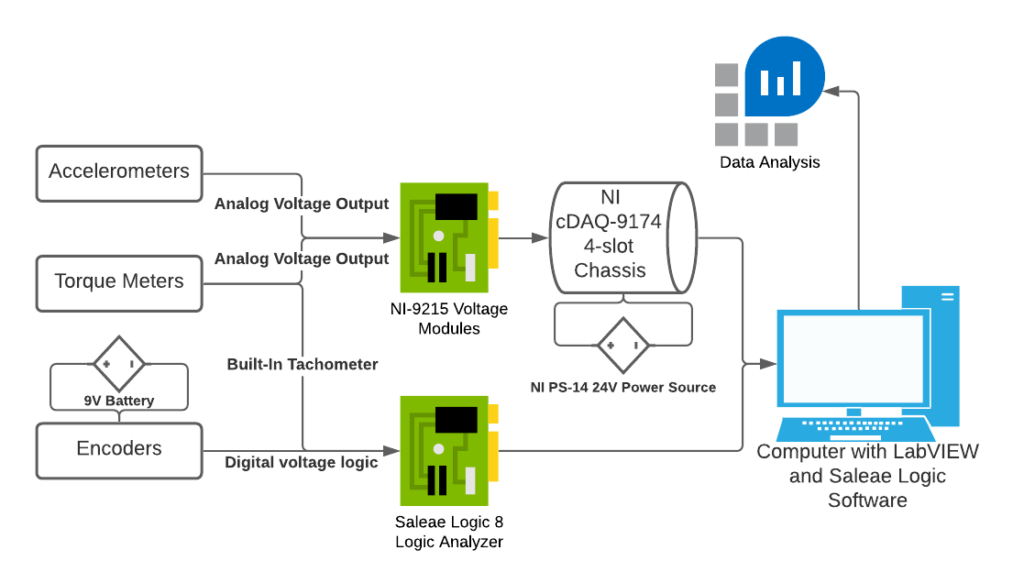
To record the response of the failed bearing, a selection of a Data Acquisition (DAQ) system is required. The analog signals of sensors such as accelerometers, torque meters, and the digital signals of encoders are recorded with the chosen DAQ system and stored on the computer for further data analysis. We had to configure the wiring diagrams for the individual sensor – DAQ connections.
The diagrams shown here are for the full use case of accelerometers, torque meters, and encoders. Sensors can be added and subtracted as budget allows, with one encoder and the accelerometers as the base case.
Accelerometers: Record vibration data of bearings or any mount points. This is the main diagnostic used for the effect of an embedded fault.
Torque meters: Monitor power transfer from the motor to the test sample, which can give insight on if a failure will happen.
Encoders: Measure angular displacement and speed, to detect torsional vibrations (twisting of the shaft).

This is the DAQ diagram for the full test case, using accelerometers, torque meters, and encoders. The analog signals go into the National Instruments (NI) modules, and the digital signals go into the Saleae Logic Analyzer.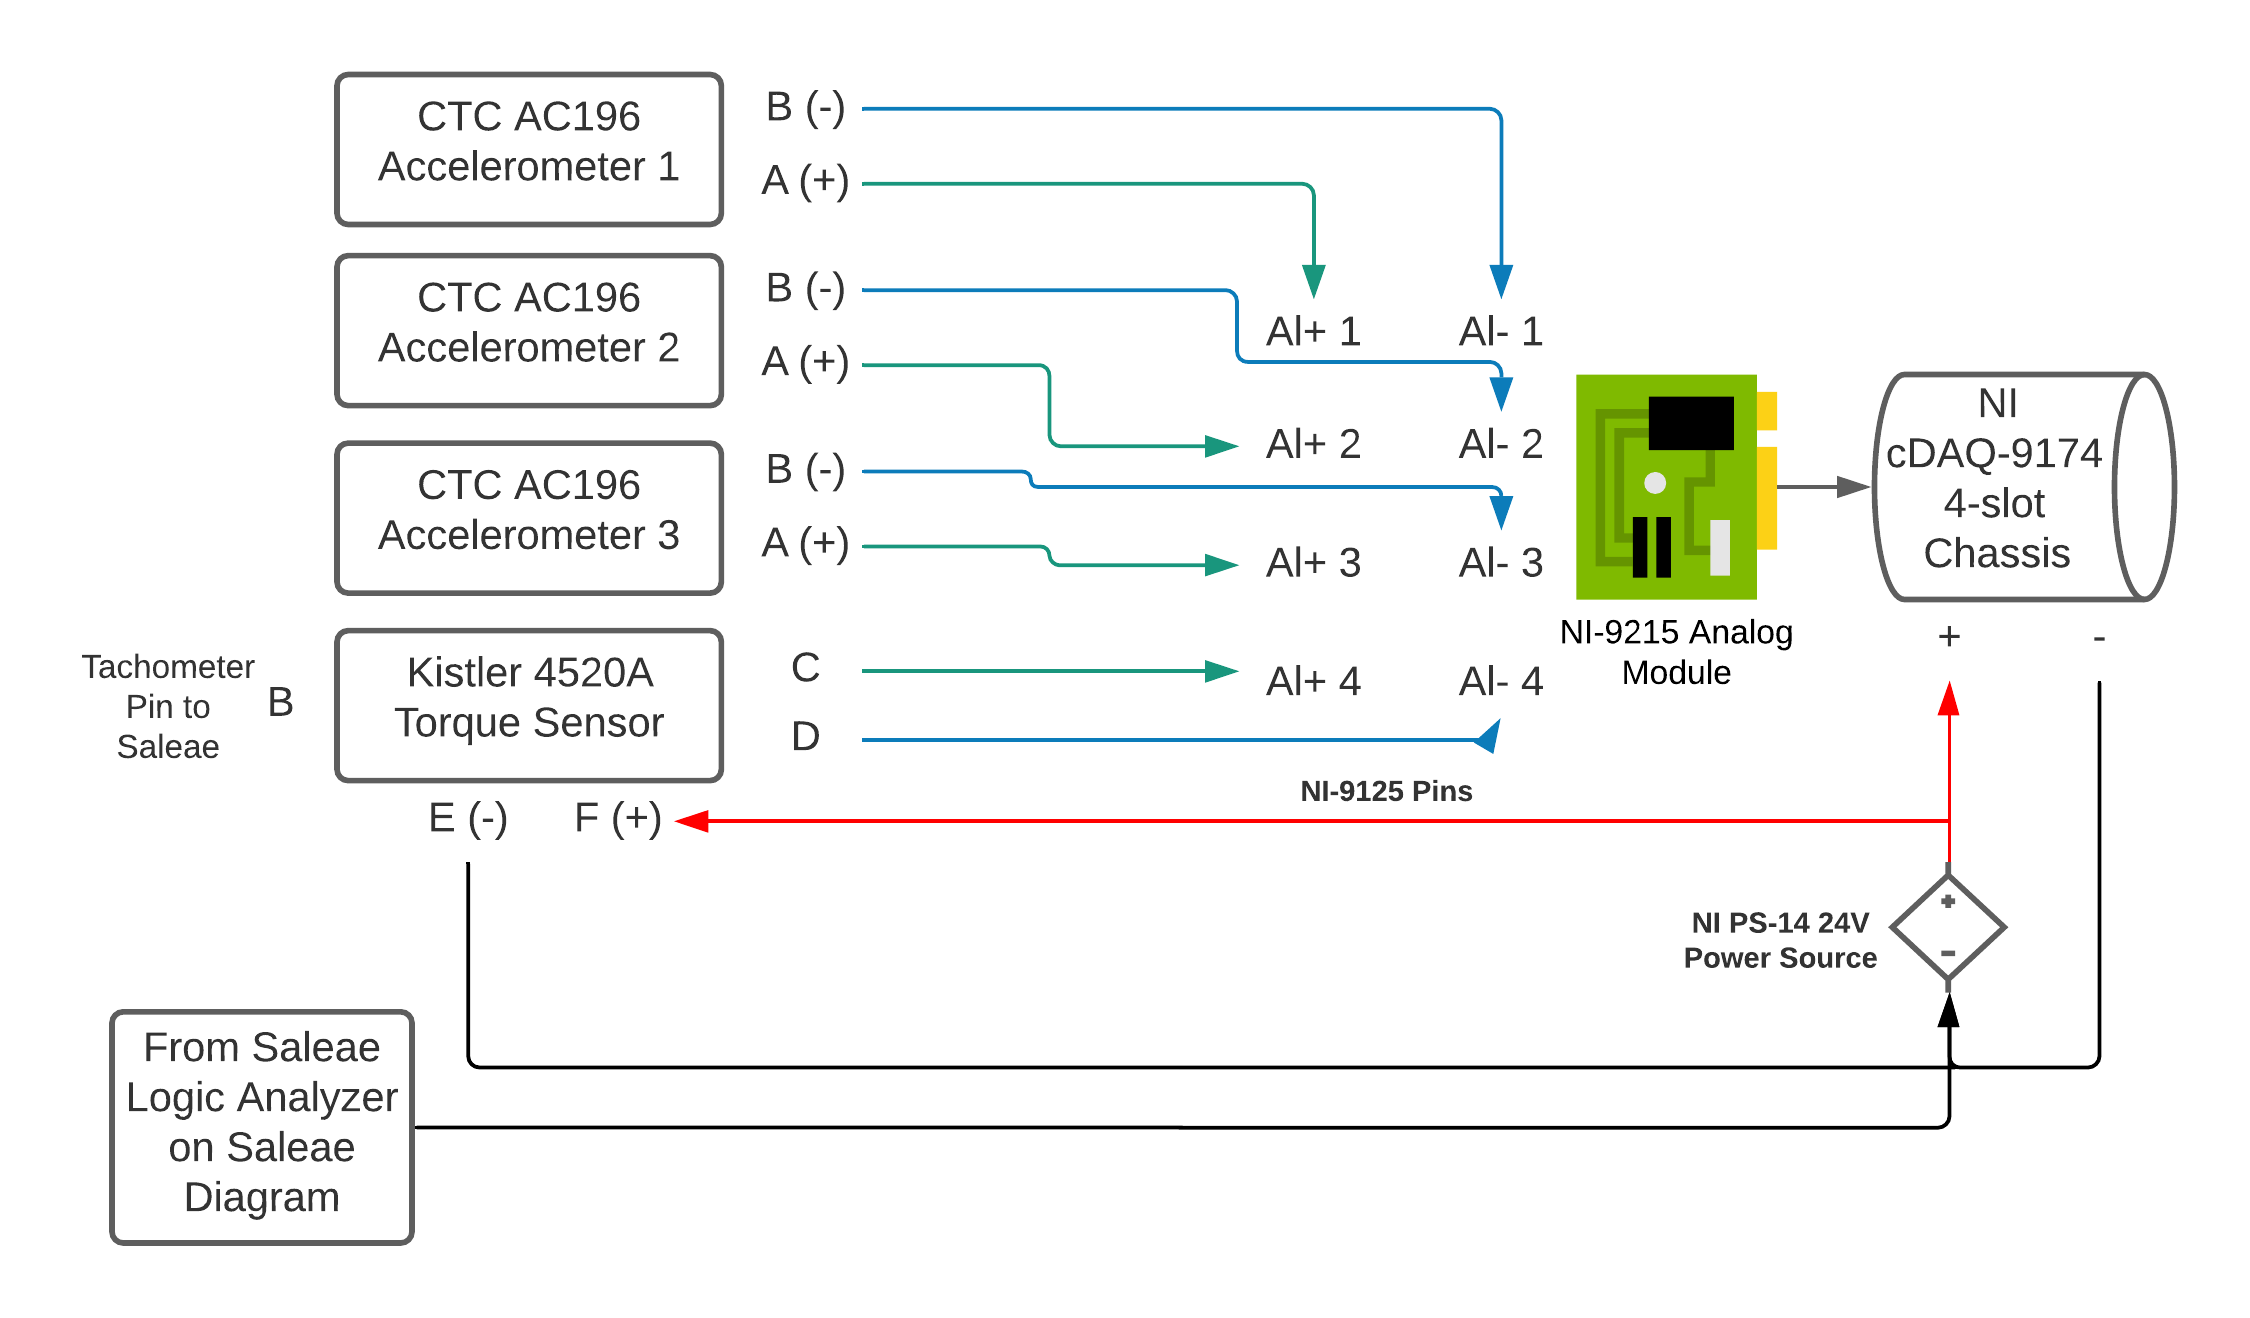
This is the wiring diagram for the analog signals from the accelerometers and torque sensor going into the National Instruments (NI) DAQ system.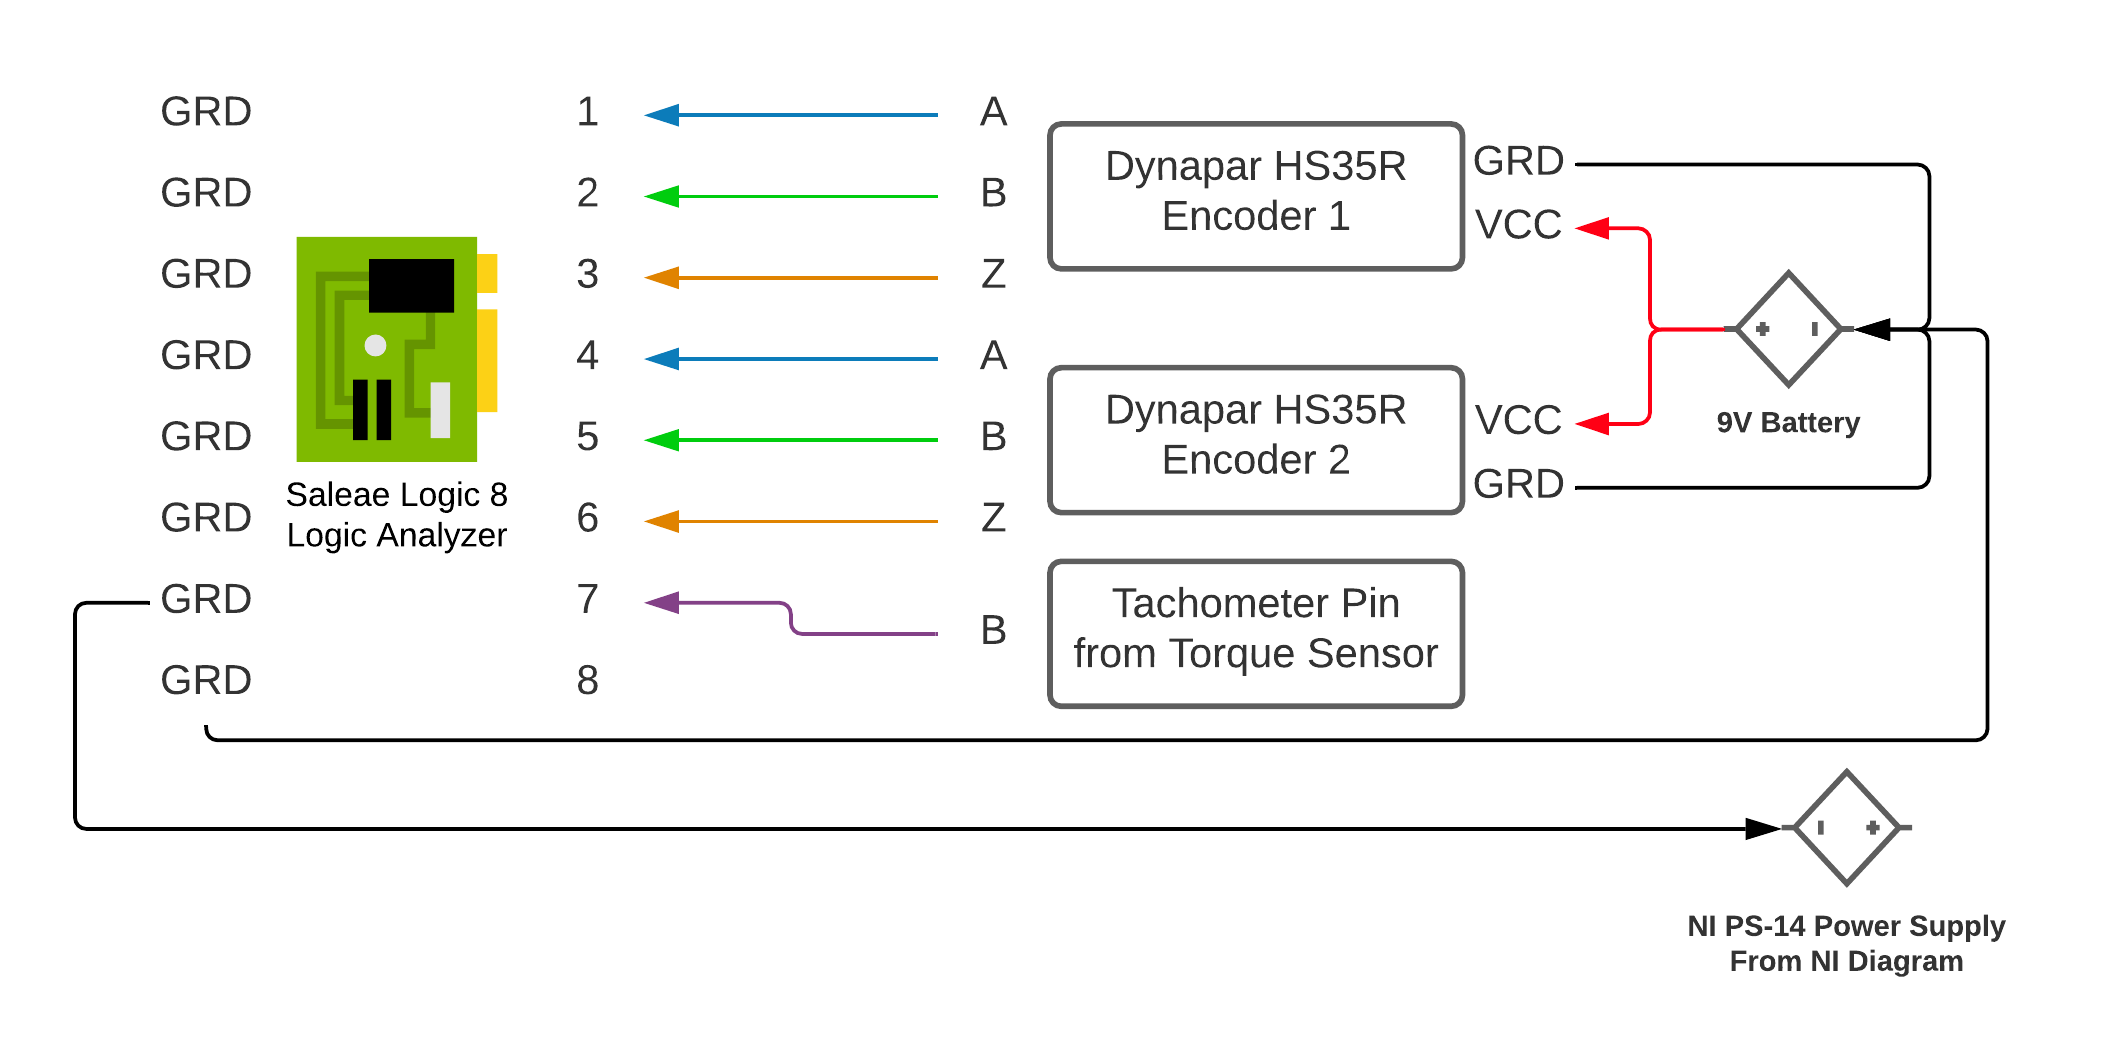
This is the wiring diagram for the digital signals from the encoder and any additional tachometers going into the Saleae Logic Analyzer.
6: Data Analysis – Condition Monitoring and Statistical Correlation
We initially wanted to physically construct the test rig, but due to COVID-19 we had to adapt our strategy. Outside of the design and specification, we looked into different ways we can use the failed bearing data to give insights on when it might fail. We initially began with two approaches:
- Condition monitoring in MATLAB to forecast vibration values, comparison with a threshold value
- Statistical correlation in Python to find correlation between a random data set and known failure data
These two statistical methods were adequate in monitoring the current state of the system, but lacked the ability to consistently predict failure. Therefore, a more engineered approach to predict failure using Machine Learning was examined.
 Acceleration vs Time in Python, Day 1 (healthy) vs Day 7 (failure). Part of statistical approach to compare healthy to failed data.
 Acceleration Correlation Plot between bearings in Python, Day 1 (healthy) vs Day 7 (failure). Part of statistical approach to compare healthy to failed data.
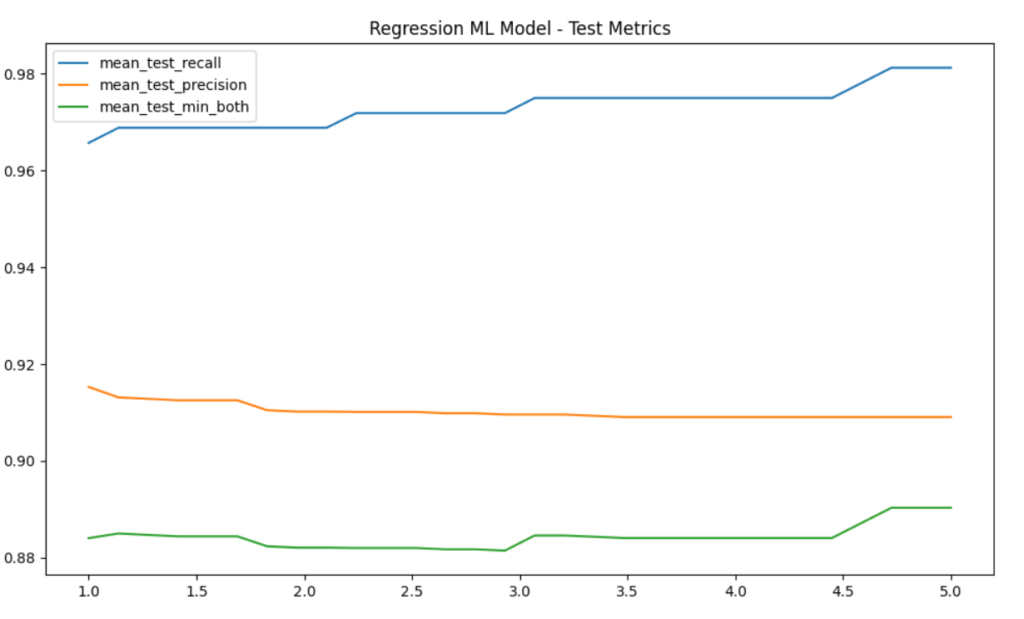
7: Data Analysis – Machine Learning with Logistic Regression, CNN Image Processing
With machine learning, the basic idea is to train a model with data so it can predict what the result will be.
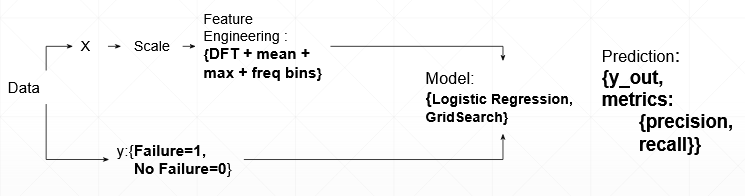
In our case, we wanted to predict if a bearing would experience failure or not based on the acceleration data. The normal versus failed data for training was fed into the model and the prediction results had good accuracy (precision and recall).
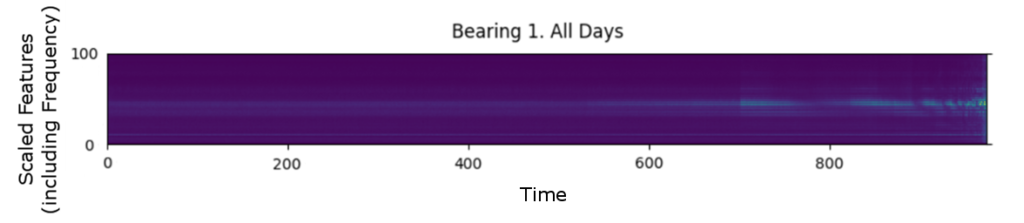
However, the success of this model is still limited as it lacks sufficient features (as we only acceleration) and labelled training data for the model to better differentiate between failed and healthy bearings. This is partly due to run-to-failure tests being lengthy and expensive. To compensate for the limited training data, Convolutional Neural Network (CNN) image processing was explored.
CNN can be effective when there is not enough data or features. A tabular data set is converted into an image made up of pixels, and the image itself is on a colour scale from 0 to 255. The resulting image can be used in machine learning to recognize the pattern of a failed bearing. Below, the horizontal line grows in intensity as the time – and frequency – of the failed bearing increases. This is a proof-of-concept and further fine-tuning and testing of this method is needed.
Details
Practicality
When a rotating component such as a bearing undergoes sudden failure, it can be catastrophic and dangerous for the people around the machinery. The best safety measure is preventive maintenance, or replacing a component before it fails. Our design provides a safe environment for the testing of bearings with known faults in which the acceleration data can be safely recorded.
This data can then be used for analysis and detection of patterns that could indicate or predict failure.
What makes our design innovative and effective
By designing our rig to be modular, we’ve created a flexible system that is not restricted to a single test case. Its current main function is for obtaining acceleration data of a failed bearing. However, extra sensors and components such as additional encoders and torque meters can easily be added via the t-slot tabletop system for future use cases and deeper insights of the effects of failed components, should additional interest and budget be available.
The base case of using accelerometers to record the vibration response of bearings is an effective, commonly used monitoring tool. Combining industry-standard measurement techniques with a modular setup allows for the effective measurement and analysis of the base use case.
Design Validation
As discussed in the “Design Process and Deliverables” section, the design was validated in several ways:
1. The geometry and visuals were created in SolidWorks
2. The structural integrity of the shaft and bearings were verified using analytical solutions and FEA software such as ANSYS
3. The proof-of-concept data handling was demonstrated in Python and MATLAB, to explore relations between acceleration and failure, and possible predictive and condition monitoring measures.
Feasibility
Our design is feasible as it makes use of ready-made off-the-shelf parts wherever possible to reduce on manufacturing costs. Parts that are to be manufactured use simple manufacturing processes. The sensor components were selected to ensure compatibility with the chosen DAQ systems, and once the data is stored on a computer, any data analysis or visuals can be built from it.
Advisors and Sponsors
We would like to thank our project sponsors Dr. Qiao Sun, Joseph Fernando, and Dr. Ali Hajnayeb for guiding and advising us through the project. Their expertise in rotary systems, measurements and sensors, design, and evaluation were invaluable to the success of the final design.
We would also like to thank Dr. Philip Egberts and A.J. Ebufegha for their guidance and support throughout the capstone course.
Photo and Video Gallery