Project Category: Multidisciplinary
Our Project
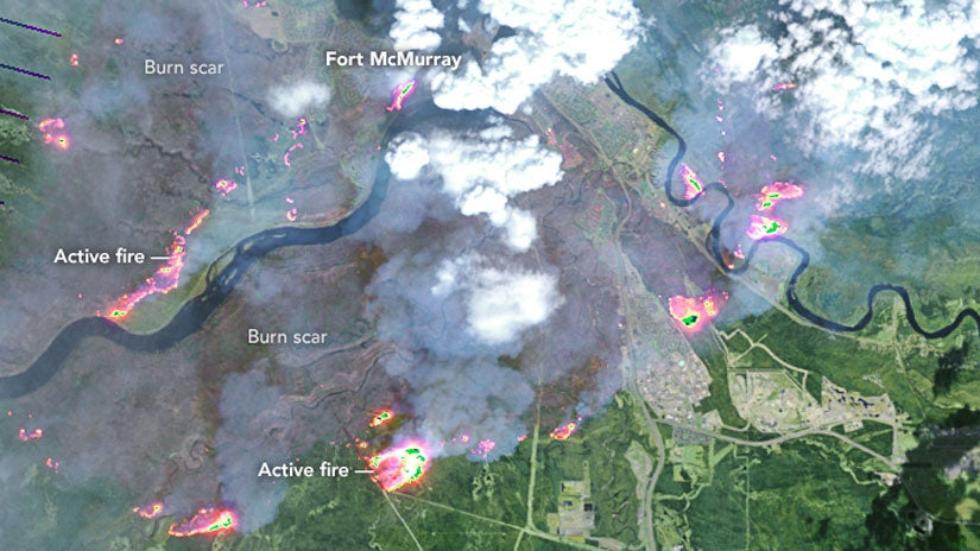
Every year, wildfires cause devastating damage to ecosystems, economies, and human lives. Today, climate change is making wildfires more destructive. The Australian wildfires in early 2020 were estimated to cost $100 billion[ref]. Current wildfire detection techniques depend on human-based observation and this can be very slow. Early detection of wildfires could prevent large-scale disasters by warning fire personnel before a fire has a chance to spread.
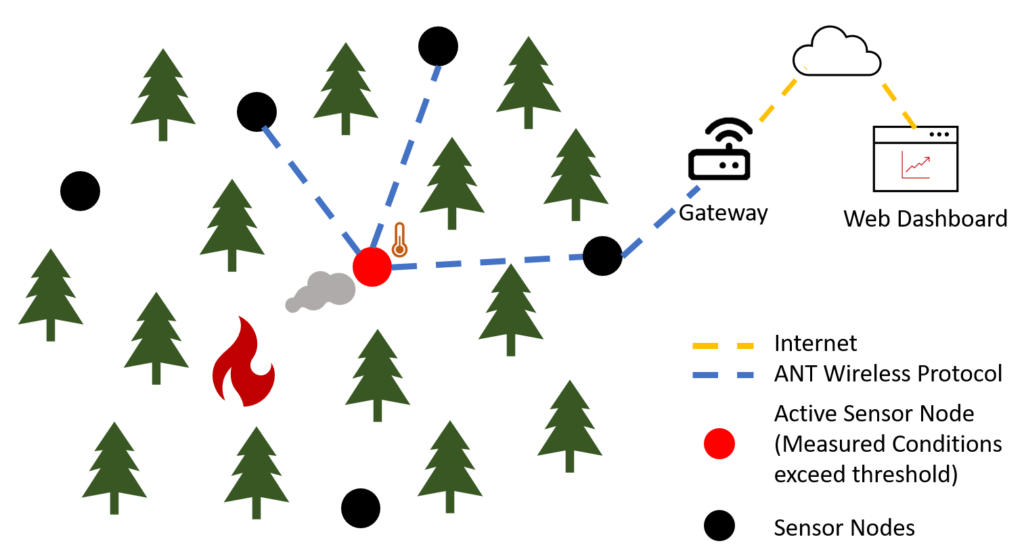
Our solution is an internet-of-things (IoT) mesh network of sensor devices that will collect temperature and smoke measurements in a monitored area. The sensor devices will raise an alarm if they detect a fire. The alarm will be propagated across the mesh and data will be uploaded to a user dashboard to alert fire personnel.
This project uses ANT BLAZE wireless technology and is sponsored by Garmin Canada.
WHY IS THIS NEEDED?
Wildfires are becoming more destructive. We need a method for early detection of fires without the shortcomings of current solutions. As described in our value proposition section, our design is a faster, more accurate, and lower-cost alternative to common wildfire detection methods.
WHAT MAKES OUR DESIGN INNOVATIVE?
IoT wildfire detection networks are a thoroughly researched topic, but there is yet to be a fully realized marketable product. Our project combines the research and analysis to provide a feasible design that can be deployed in the real world to aid in wildfire management.
WHAT MAKES OUR DESIGN SOLUTION EFFECTIVE?
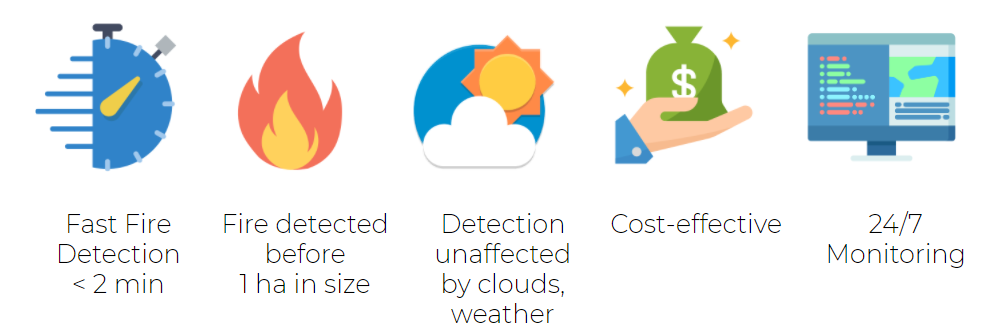
Our solution has unparalleled ability to consistently detect fires early. This can prevent large-scale damage. The system informs officials within 2 minutes of detection and before the fire reaches 1 hectare in size.
HOW DID WE VALIDATE OUR DESIGN SOLUTION?
We showed that ANT Blaze can send messages across duplicate nodes in a network, data uploads seamlessly to our cloud server, the printed circuit boards are fully functional, and that the housing is water resistant. We completed field tests with a small, controlled fire to confirm alarm thresholds and end-to-end functionality.
HOW FEASIBLE IS OUR DESIGN SOLUTION?
As presented by our feasibility analysis, our design presents a low cost solution to a devastating global problem. It is also proven to work in a real-life implementation scenario.
Our Design
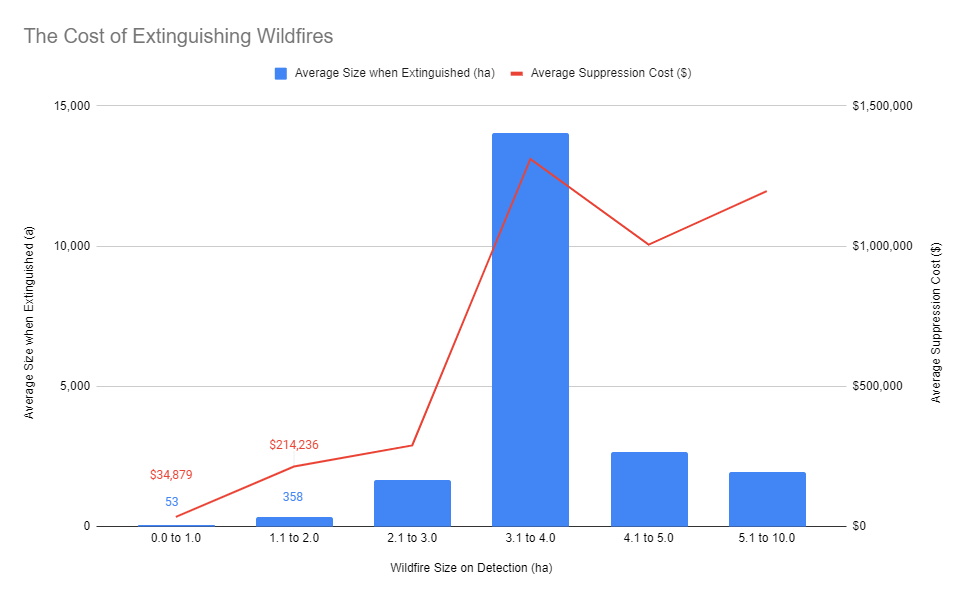
Data from Alberta Wildfire shows that it is crucial to detect a wildfire before it reaches 2 ha in size. A jump from 1 ha to 2 ha increases the average suppression cost by almost 6 times, and suppression cost generally increases with the size of the fire at detection[ref].
However, Alberta Wildfire generally detects fires when they are 5 ha or larger. This shows a need for a new technology which can report fires before they reach a large size.
Our team’s design solution is a wireless sensor network system for early detection of wildfires. Its purpose is to reduce fire suppression costs and warn fire personnel before the fire spreads over a large area. The sensor network is designed to detect wildfires before they reach 1 ha in size and warn fire personnel within 2 minutes of detecting the fire.
Our ANT BLAZE connected mesh network of sensor devices provide an always-on, constant monitoring solution. It ensures that the time-to-detection remains low and consistent.
Our Design Has 3 Main Components:
Sensor Node
Our sensor nodes detect environmental temperature and smoke conditions. They support latitude and longitude input and are wirelessly connected. When a measured environmental condition exceeds a predefined threshold, the sensor node starts broadcasting an alarm.
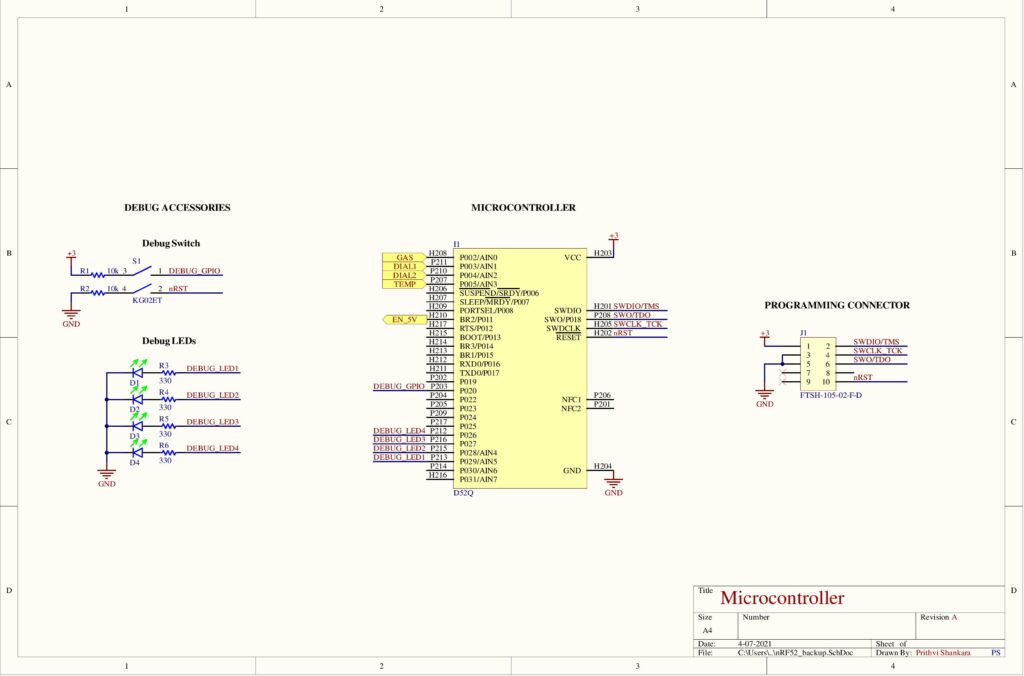
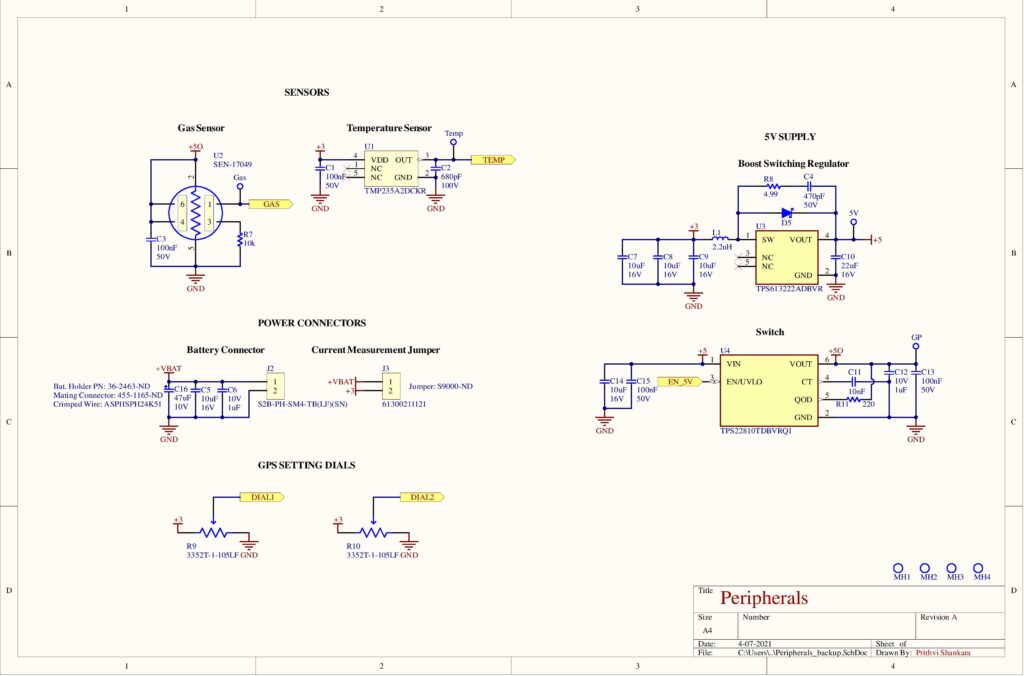
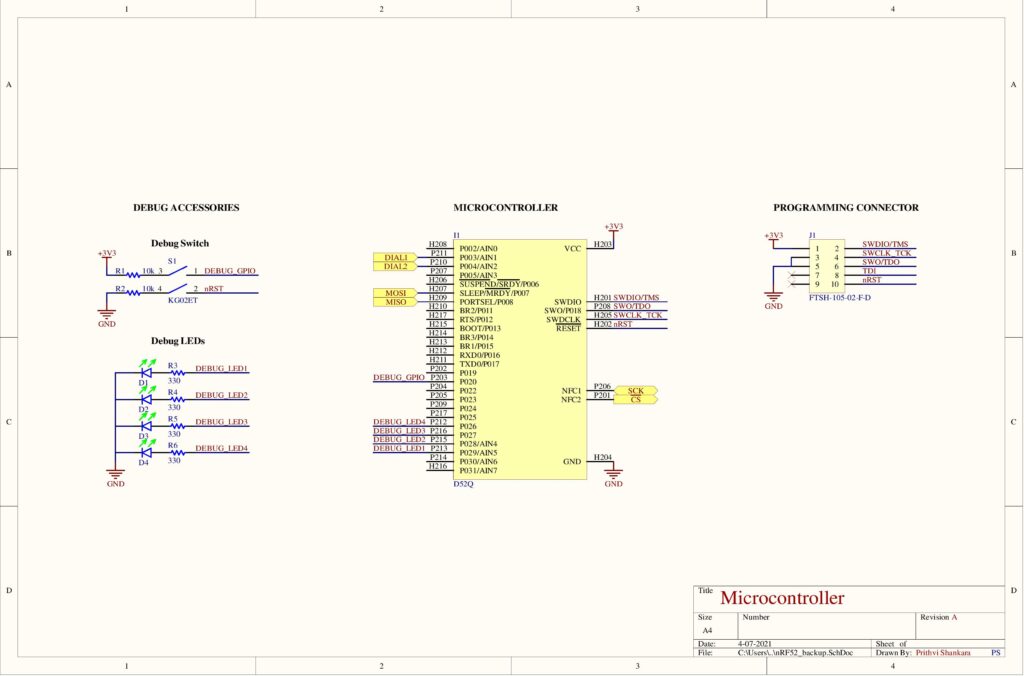
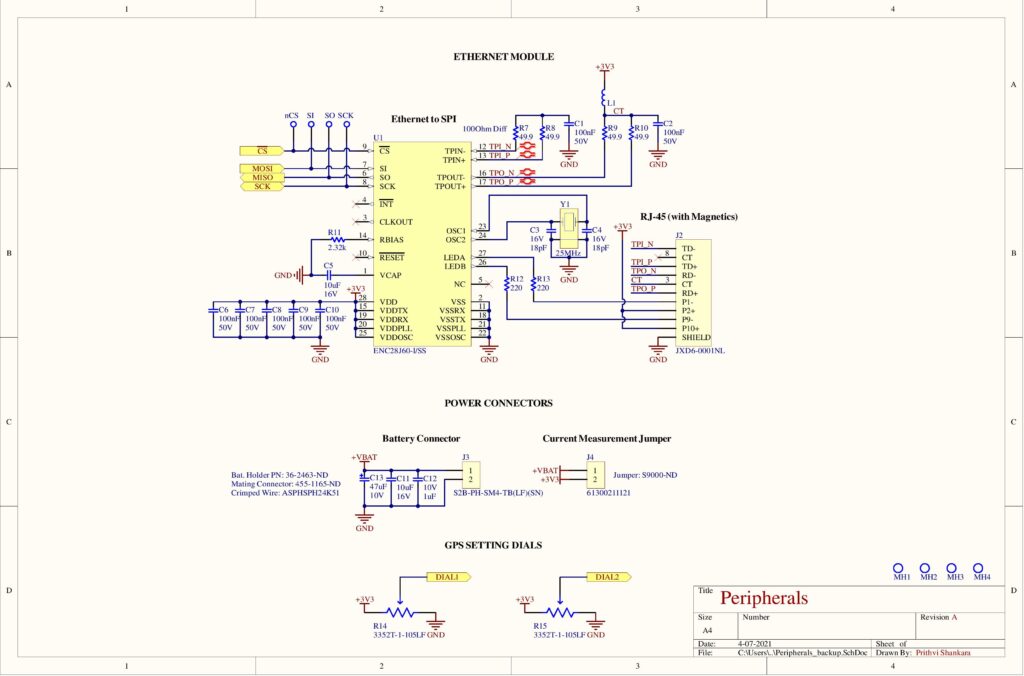
Electrical Design
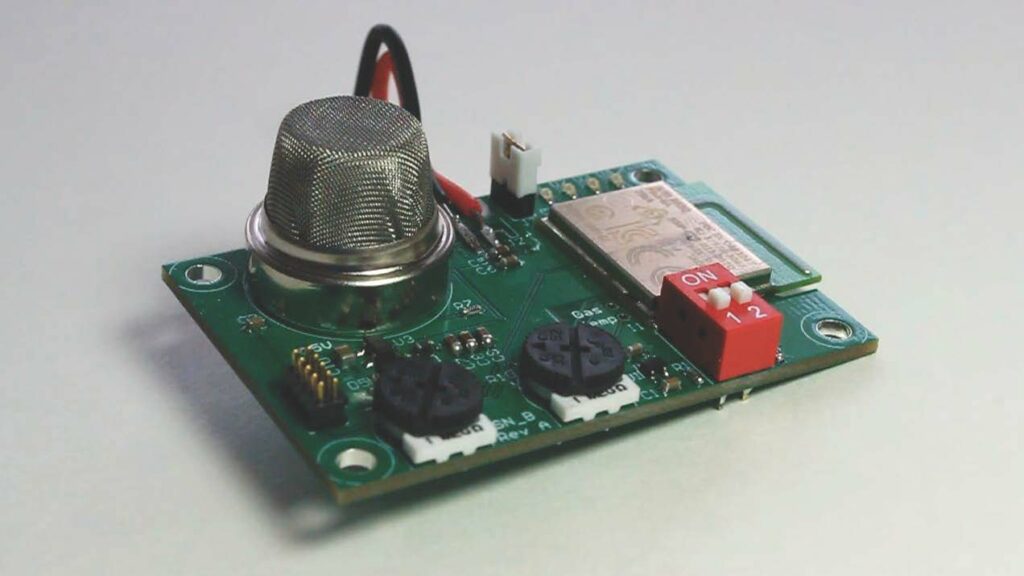
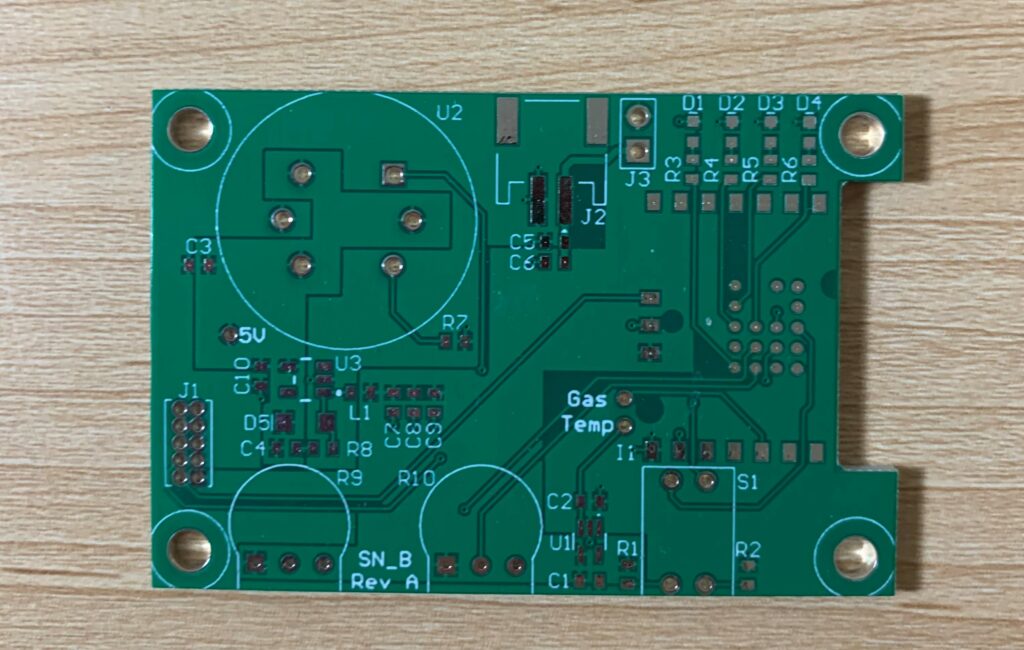
The sensor node contains an nRF52 microcontroller, a gas sensor, a temperature sensor, power management chips, and interface components. The gas sensor detects smoke at concentrations between 30-10,000 ppm and temperatures between -40°C to 120°C. The microcontroller interconnects the nodes via the ANT BLAZE wireless protocol. The sensor nodes are optimized for a battery life of over three years using two AA batteries.
See Our Electrical Design Schematics
Firmware
The sensor node firmware is built onto the nRF52 microcontroller using the ANT BLAZE Node library and nRF52 software development kit (SDK). Nordic’s Soft Device 332 wireless protocol stack drives wireless communication.
To detect fires, the value from the gas sensor is compared to a selected threshold by using a low power comparator (LCOMP) in the microcontroller. When the voltage crosses a given threshold, it wakes the sensor node up to send out a fire alarm message to the ANT BLAZE mesh network. The fire alarm is followed by additional sensor node status messages about temperature and battery life so that end users stay informed.
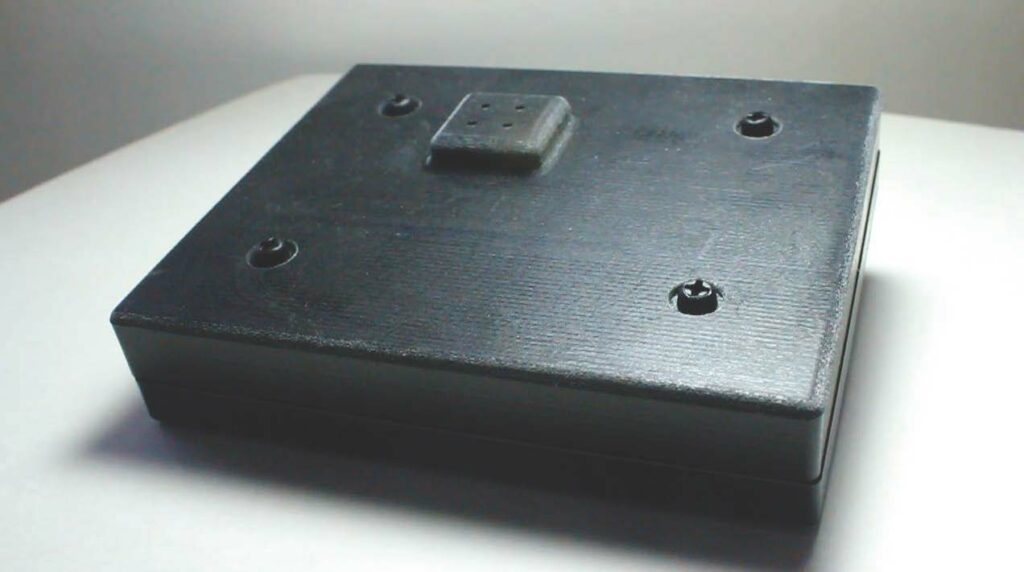
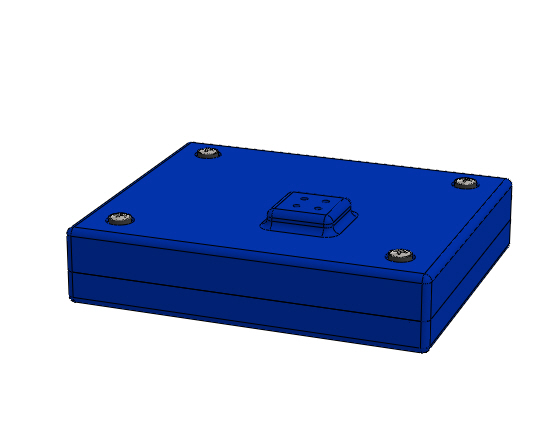
Housing
The housing is low cost, water and dust resistant while being gas permeable. Cost is addressed by custom-designing the housing to optimize material use, and by choosing a low-cost material that still meets thermal requirements. Weather resistant sealant backed up by an o-ring forms a waterproof seal. A PTFE filter allows fire-indicating gasses to reach the sensor inside while keeping dust and water out.
See Our Mechanical Design Schematics
Gateway
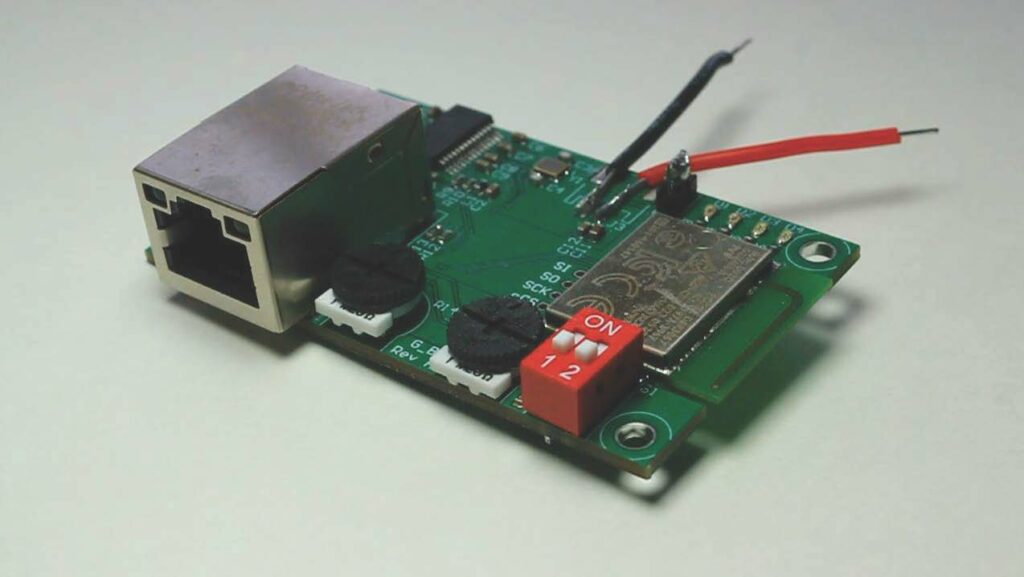
Our prototype gateway consists of an ANT BLAZE enabled node and a bluetooth enabled router. Once a gateway receives an alarm from a sensor node it will send the data to the router via bluetooth. The data is then uploaded to our database.
We also investigated the design of an ethernet enabled gateway that would interface with our sensor nodes via ANT BLAZE and directly upload to our database.
See Our Gateway Design Schematics
Dashboard
Backend Design
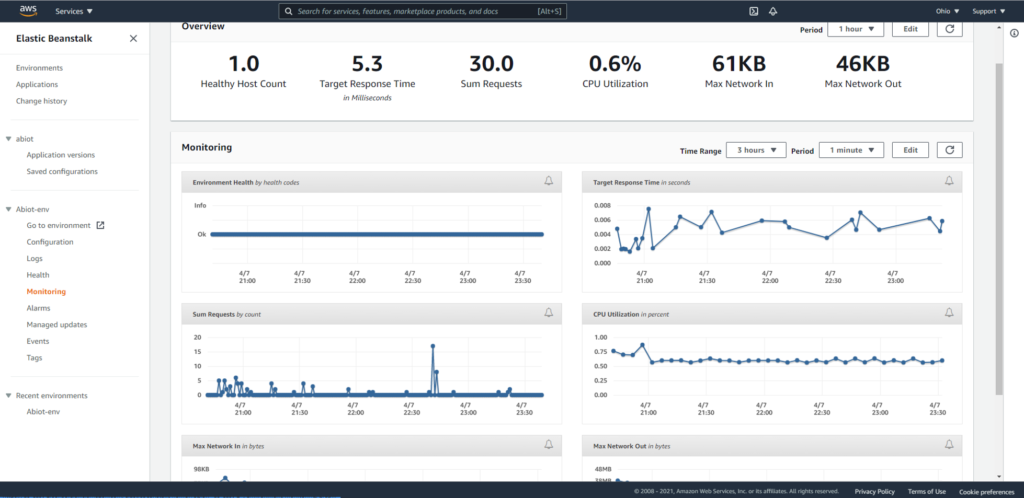
Data sent from the gateway is uploaded to a MongoDB database. Amazon beanstalk manages large, bursty data uploads from the network of thousands of nodes. The backend software uses Node.js, a simple and lightweight framework, to improve data management efficiency. Data is then transferred to dashboard clients through use of websockets. This ensures quick and reliable data transportation.
Frontend Dashboards
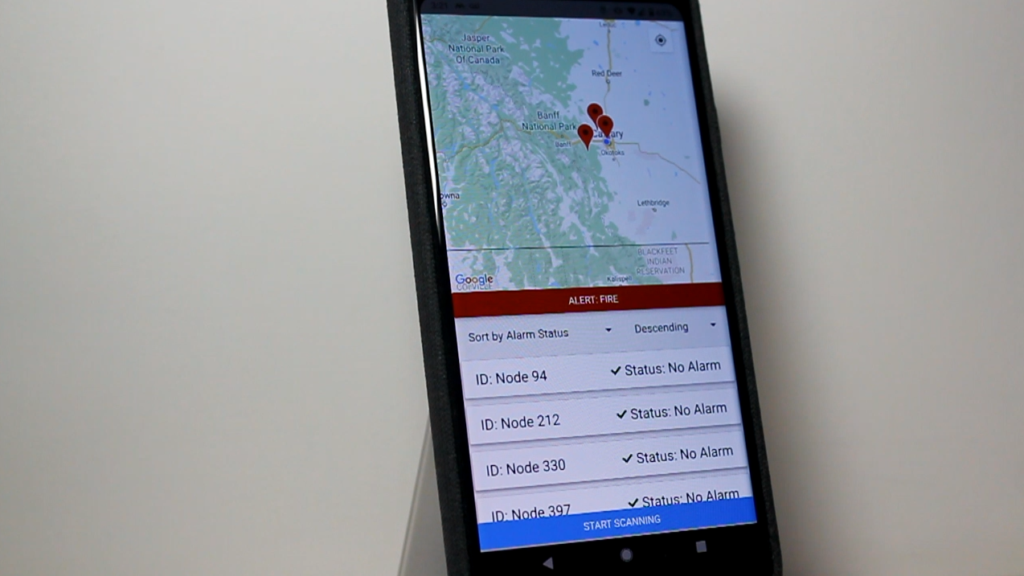
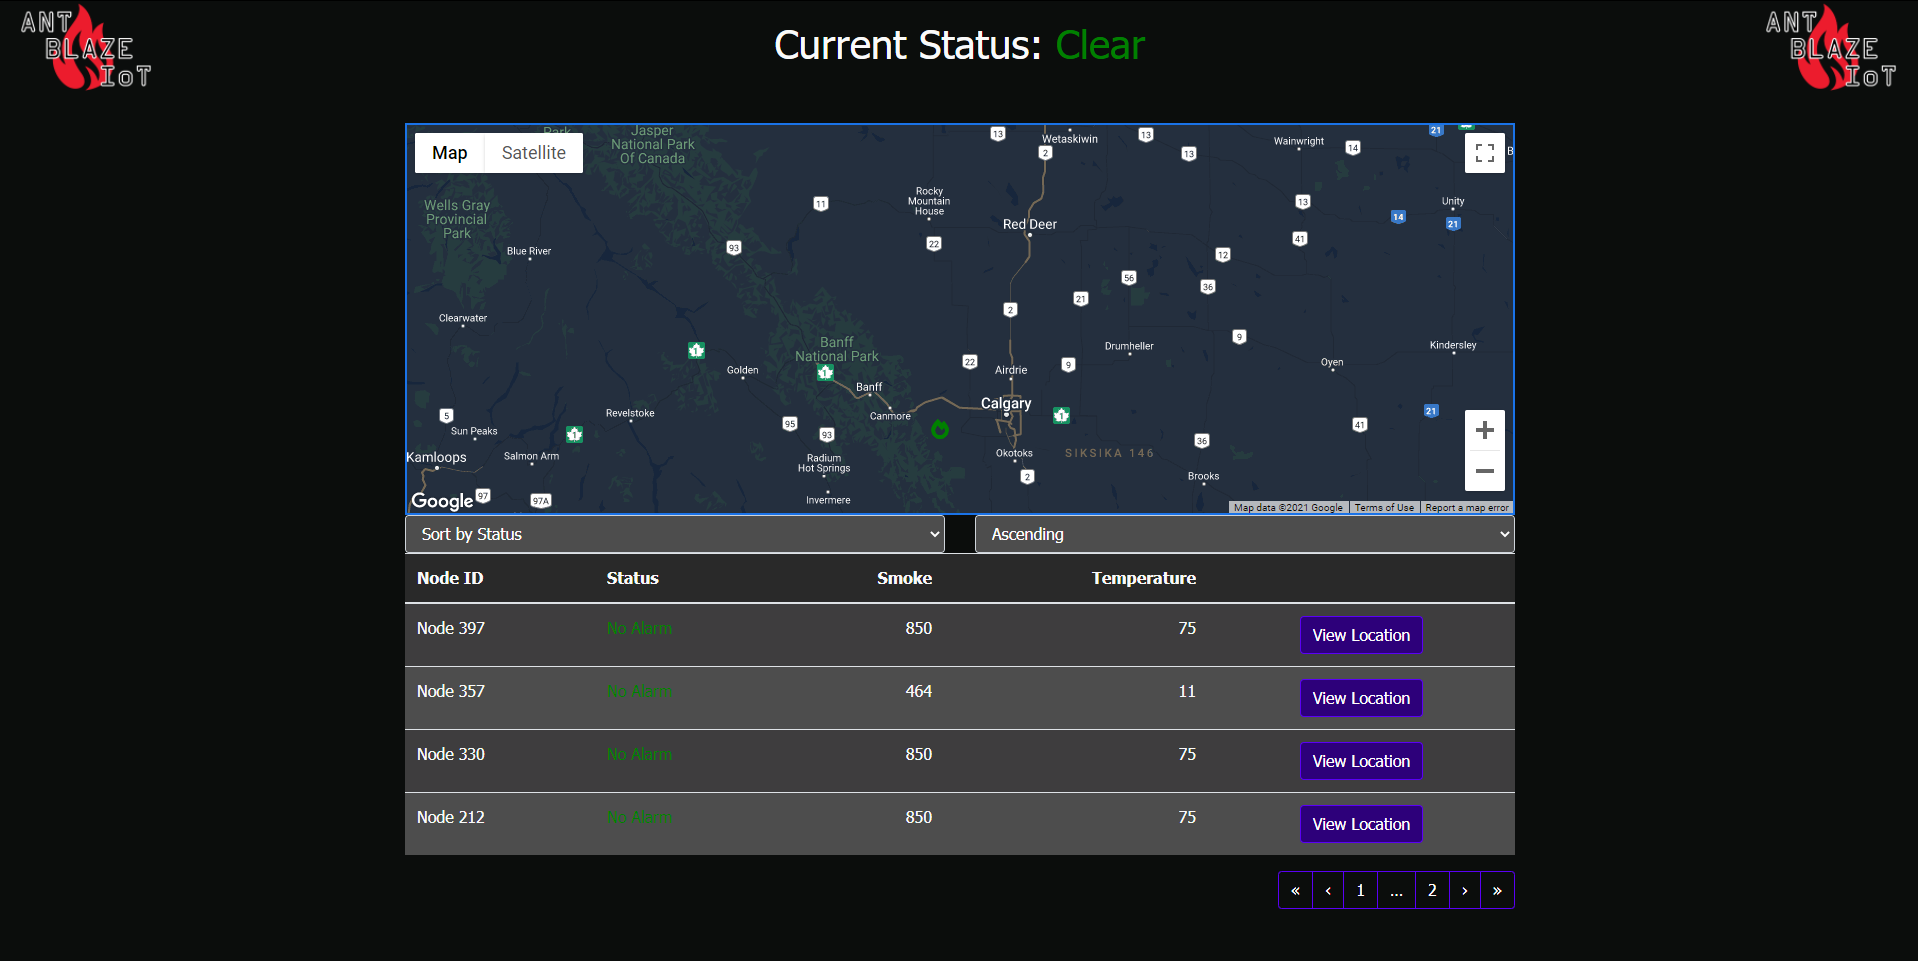
Node data is displayed in an easy-to-read format. Users access the node data from their workstation though our web dashboard client. Data can also be accessed through our mobile Android application. We use React, React Native and the Google Maps API to help the user visualize and comprehend the node data.
Our Web Dashboard
Testing and Validation
Our design was rigorously tested through each step of the development process
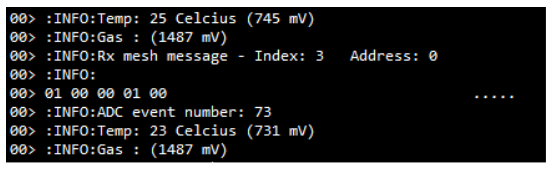
Preliminary Tests
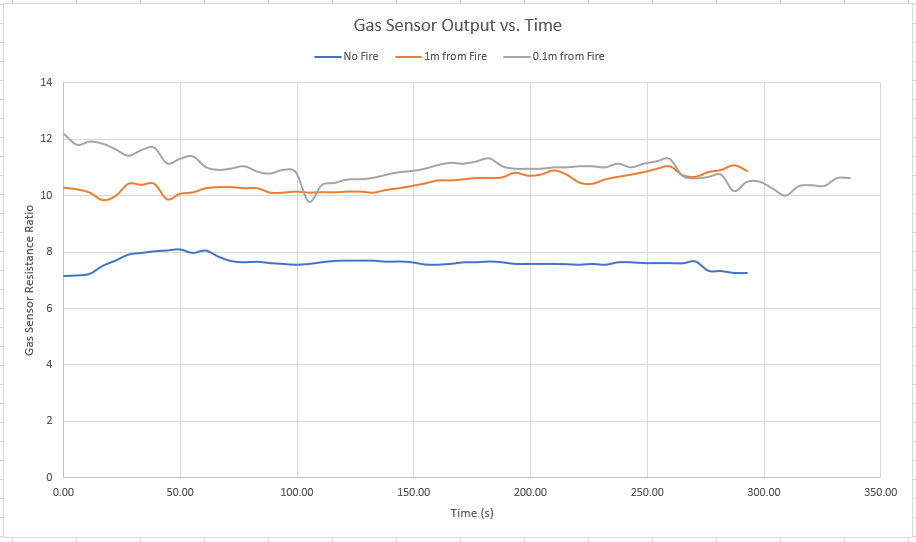
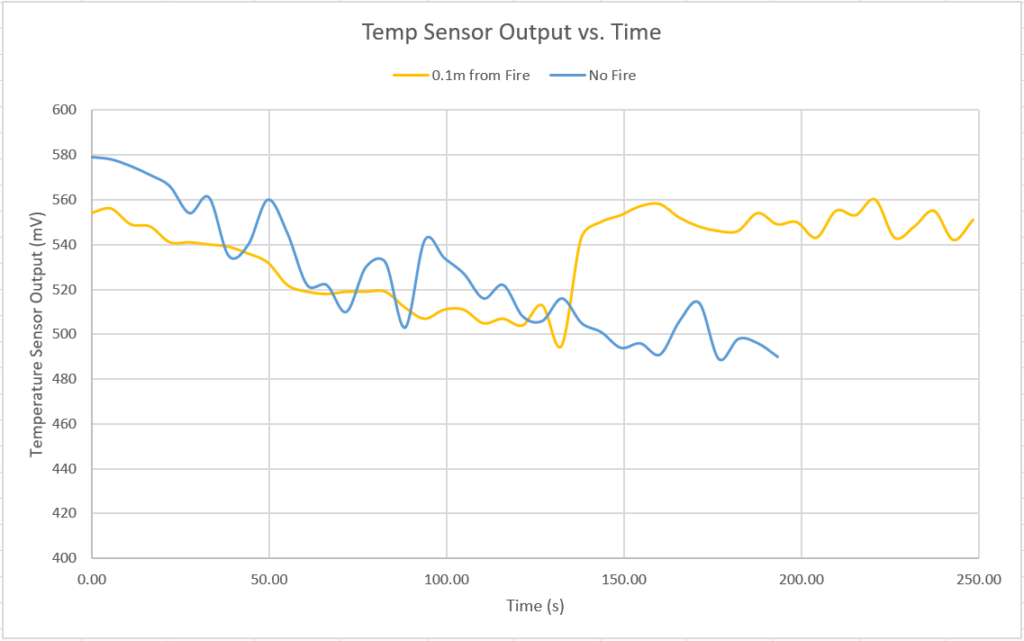
Before we finalized the designs for our printed circuit boards, we verified that our gas and temperature sensors behaved as expected. We achieved baseline values for both the gas and temperature sensors which we further refined during field testing.
Firmware Unit Tests
Prior to system integration we tested the major components of the firmware:
- ANT Blaze mesh networking protocol
- Bluetooth Low Energy (BLE) functionality
- Hardware drivers
We also tested edge cases such as:
- ANT Blaze mesh networking against duplicate node IDs in the same network
- Node failures in a mesh during message transmission
- Obstructing obstacles hindering radio transmission
- Relaying messages from nodes only visible to part of the network
Backend And Frontend Tests
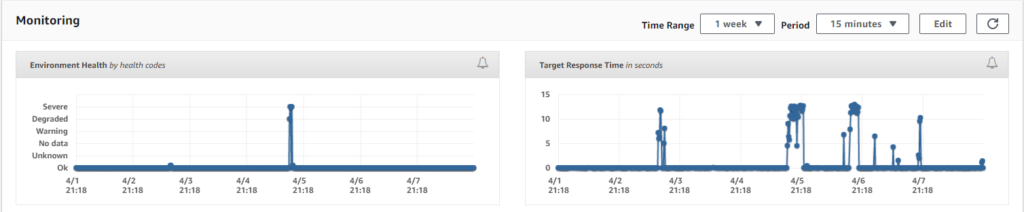
The backend and frontend software were tested for connectivity in the system integration tests. When data was uploaded to the cloud, the correctness and performance was measured. The time taken to update the dashboard was observed as well. The backend server was also tested for performance under large bursts of data uploads. Mock node information was created and used to flood the server and measure the performance. The server was able to handle the surge of incoming requests easily.
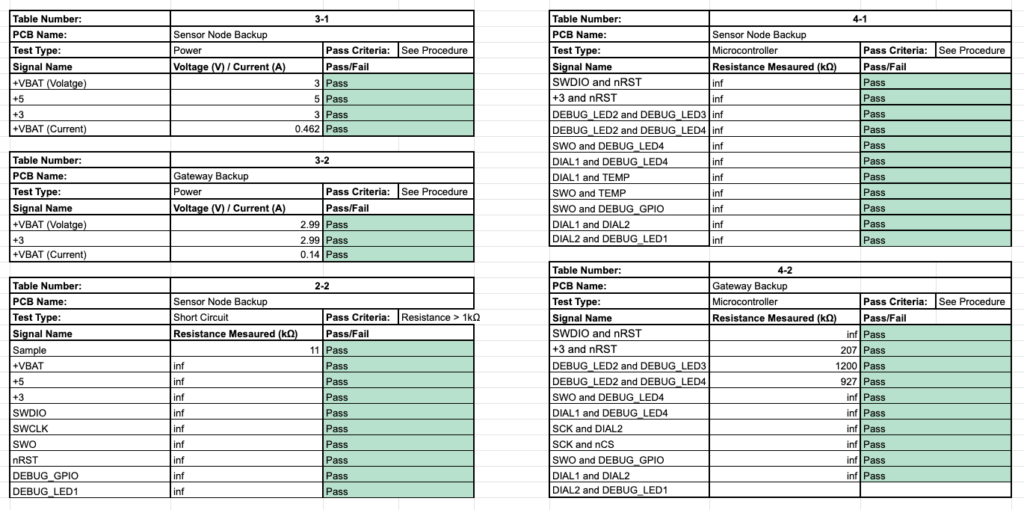
Printed Circuit Board Verification Tests
We conducted basic signal continuity and short circuit tests on bare and populated PCBs. Then we conducted power, microcontroller, and signal isolation tests to verify our PCBs. Finally, we measured the power consumption of the board under different situations (e.g., sleeping, sampling data, etc.) to verify the battery life.
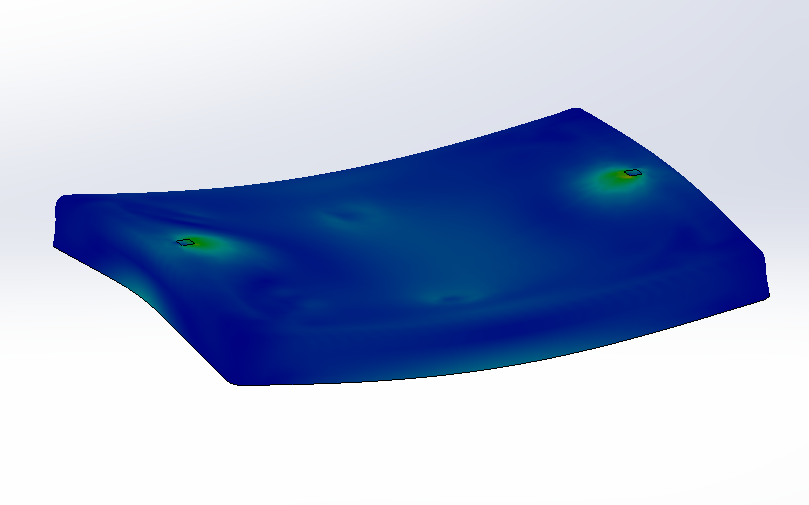
Mechanical Tests
The housing is made up of a carefully selected blend of ABS and PC to maximize weather and thermal resistance properties and minimize cost. Design evaluation in SolidWorks determined that the design is manufacturable, low-cost, and mechanically sound. In physical testing, the housing remained sealed even when inundated with water and dust-like particulates.
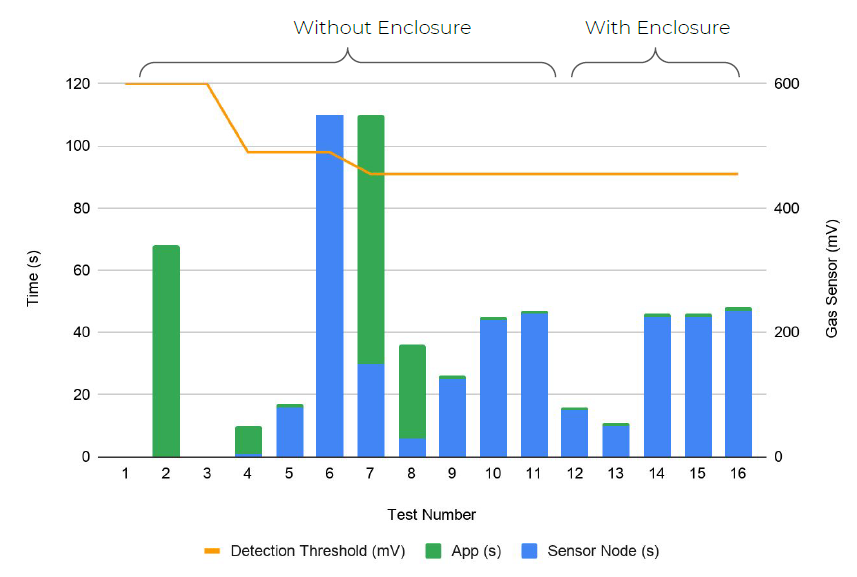
Threshold Investigation Tests
Over a series of tests, we refined the threshold for fire detection on our sensor nodes. We tuned the thresholds to achieve maximum accuracy.
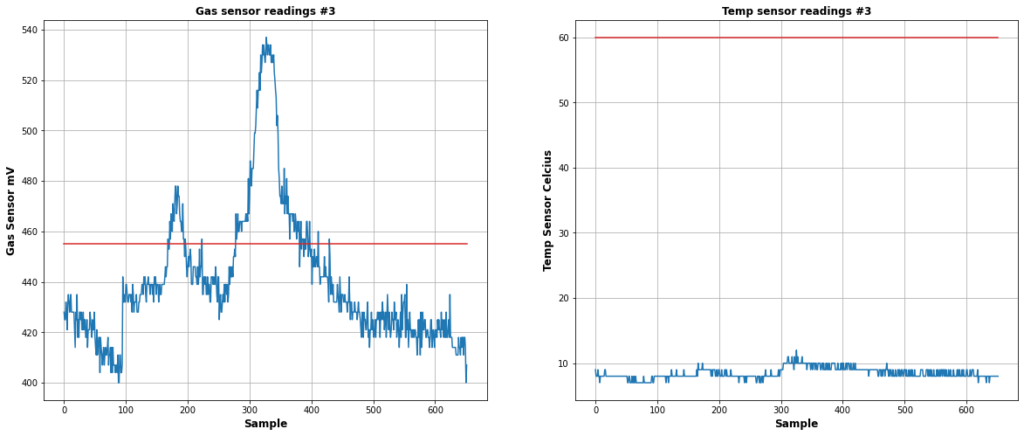
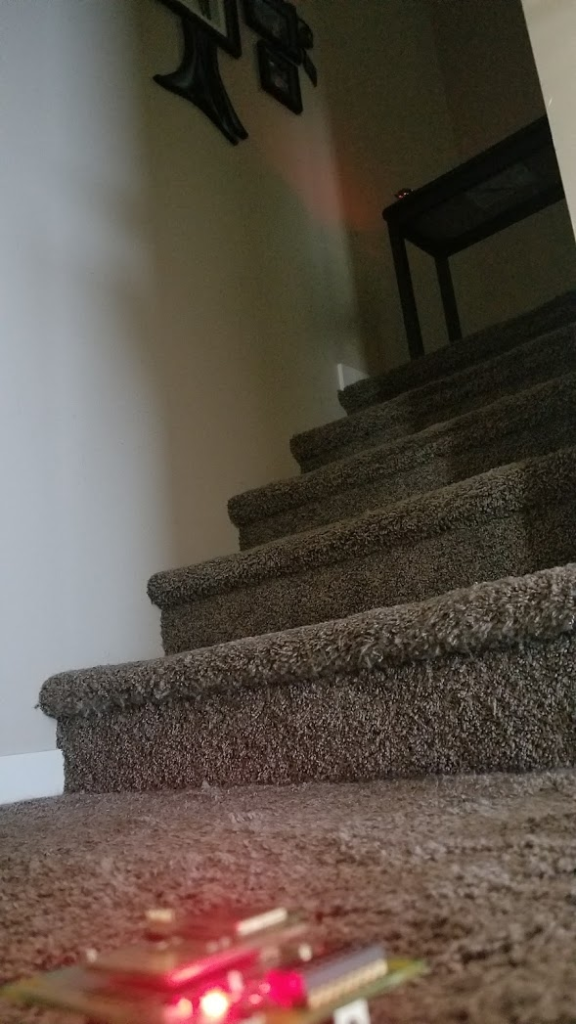
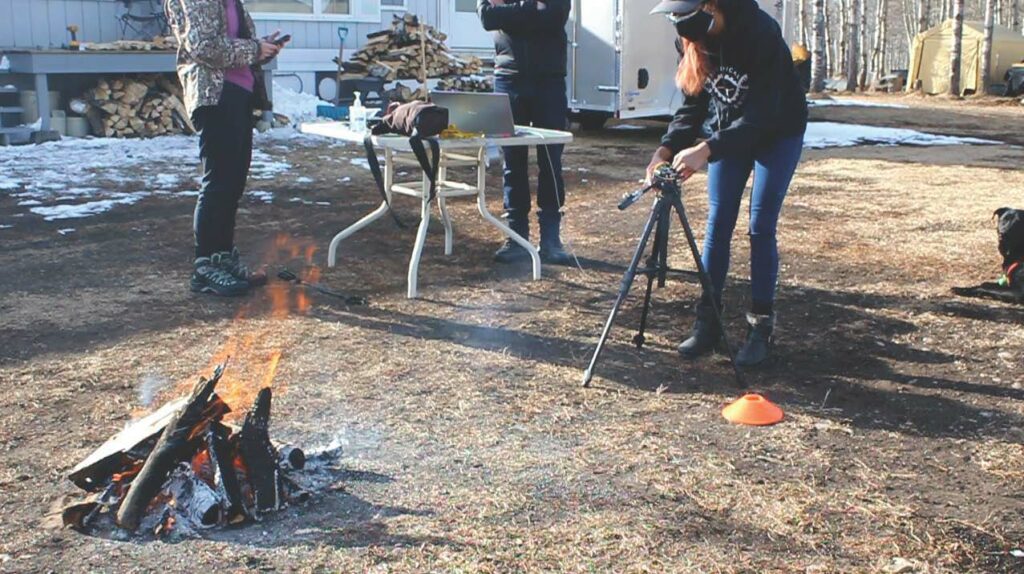
Field Performance Tests
We validated the end-to-end functionality of our system using small, controlled wood fires. The node was placed at varying distances from the fire, and wirelessly connected to the gateway. We found that once placed in smoke, the time between node activation, detection, and dashboard update was consistently less than two minutes.
Value Proposition
Other wildfire detection methods can be slow, expensive, or inaccurate. In Canada, the most common detection method is human observation[ref]. This has a long delay between detection and alerting authorities. The United States uses satellites to detect wildfires around the world. However, these images can be obscured by weather, and have a slow refresh rate[ref]. Optical sensing uses camera towers throughout wooded areas. This method is much more expensive and less effective than human observers[ref].
Our design aims to be a faster, more accurate, and lower-cost alternative to common wildfire detection methods.
Feasibility
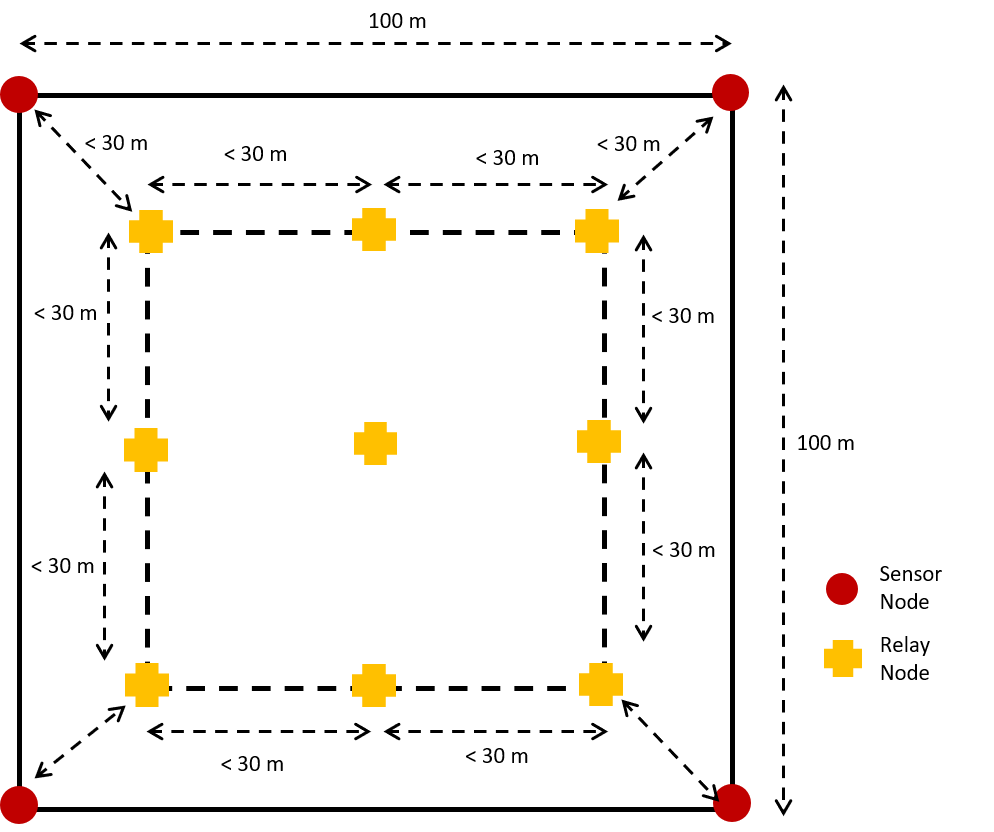
We conducted preliminary feasibility analysis for our design by determining a low-cost mesh topology. We propose deploying 4 sensor nodes and 9 relay nodes in a square grid. Our sensor nodes have a detection range of 1m, so by placing the sensor nodes 100 m apart we can detect fires before they reach 1 ha in size.
Relay nodes are designed to allow communication between all the nodes in the grid and will be placed less than 30 m apart, which is the range of ANT BLAZE. Relay nodes will simply contain the microcontroller used in the sensor node and therefore will be cheaper to manufacture compared to the nodes.
The cost of implementing the network will be $117.74 with 4 sensor nodes costing $10.96 each, and 9 relay nodes costing $8.21 each. Considering deployment costs, the total cost of implementing the sensor network will be $151.08/ha. However, with the potential for saving $182,357 [ref] (which is the increase in suppression cost from a 1 ha to 2 ha fire) , our cost is significantly low.
Meet The Team

Amanda Brown
Mechanical Specialist
Amanda is a graduating Mechanical Engineering student with a minor in Manufacturing Engineering. She enjoys finding practical solutions for design and production challenges. Amanda’s role on the team included developing the node enclosures and manufacturing considerations

Jesse Fowler
Firmware Specialist
Before going back to school as a mature student studying Software Engineering, Jesse studied nanotechnology systems and worked in Alberta’s tech startup industry. As a member of the software component for this project, his primary responsibility was firmware.

Alexander Mah
Frontend Specialist
Alex is a graduating Software Engineering Student. He enjoys finding modern solutions to practical problems. He is primarily responsible for developing the User Experience and User Interface aspect of the project.
Minh Nguyen
Backend Specialist
Minh is a young and diligent software engineering student who loves trying out new things. Equipped with the experience in working with web and phone applications from his internship, he is responsible for implementing the phone app, the cloud server and the website together with Alex.
Maliyat Noor
Sensor Integration and Test Validation Specialist
Maliyat is a final-year Electrical Engineering student who is passionate about engineering challenges that push the envelope. She was primarily responsible for background research, feasibility analysis, sensor integration and testing for this project.

Prithvi Shankara
Electrical Design, Fabrication and Testing Specialist
Prithvi is a final-year Electrical Engineering student who enjoys low-level creative problem solving for intricate design challenges. She was responsible for the design, fabrication, and testing of the electronics.
Partners and Mentors
Our team would like the express our gratitude to the following:

Garmin Canada
Industry Sponsor

Dr. Norm Bartley
Academic advisor

Dr. Roes (Arief) Budiman
Instructor

Ivan Chow
Industry Sponsor and advisor

Jaehyun Yang
Teaching assitance support
