Project Category: Multidisciplinary
CARL
Computerized Automated Recognition of Leakage
Welcome to CARL
WARNING: Wear Headphones
Join Our Presentation
LIVE: April 13 2021 (10:00 am – 12:30 pm)
Use Our Virtual Background
About CARL
15 million people suffer from stroke globally every year. There are two general types of stroke: ischemic strokes, which result from a blood clot or general lack of blood flow to certain areas of the brain, and hemorrhagic strokes, which occur when the cell lining of the arterial or venous structures becomes too weak and internal bleeding occurs within the brain. Ischemic strokes are more common, making up roughly 85% of all strokes, while hemorrhagic strokes take up the remaining 15%. Every minute that passes after a hemorrhagic stroke results in the death of nearly two million brain cells. Furthermore, 50% of hemorrhagic stroke patients die, with more suffering a serious injury that could have been avoided if physicians had more accurate data.
CARL is an implementation of a novel method of analyzing multi-phase brain scans to determine if and where there is a hemorrhage. CARL also allows you to view the hemorrhage in 3D, identifies the state of the hemorrhage (bleeding or non-bleeding), and the rate of leakage of the SPOT (location of failure). Originally, we received CARL in the form of a research prototype (Click HERE to see what CARL used to look like). From that prototype w have developed an intuitive platform to allow for further research and development, clinical testing as well as a product to validate CARL as a commercial product. Welcome to CARL.
Product Breakdown
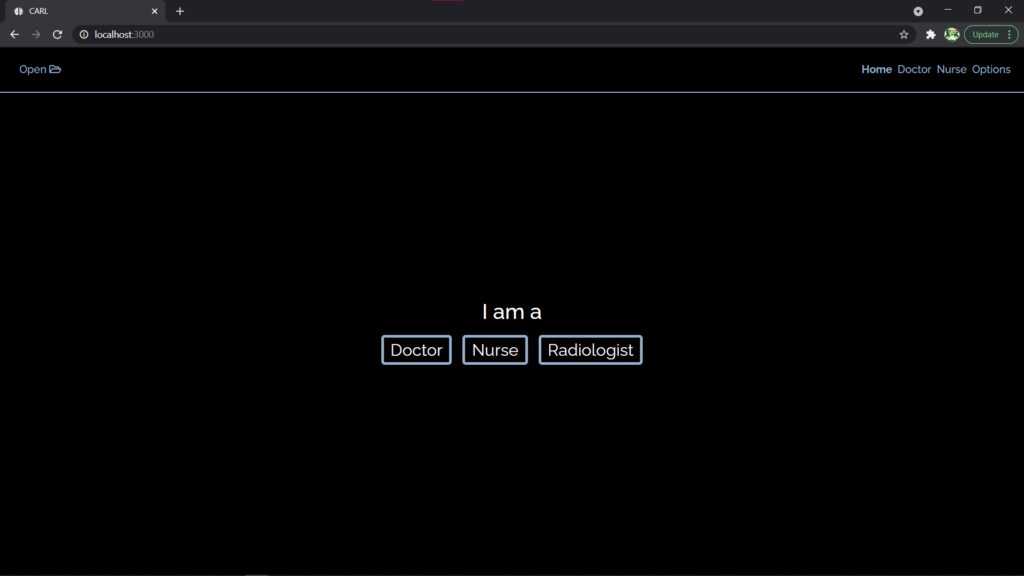
User Selection
Select your access based on the information you require.

Doctor View
If you are a stroke surgeon, neurologist, or emergency doctor that would like to see patient details, biomarkers, and SPOT growth.
Features Included:
Default Axial, Coronal Views
Patient Data
Vasculature Opacity Shift
Phase/Time View Bar
Biomarkers
Auto Rotate
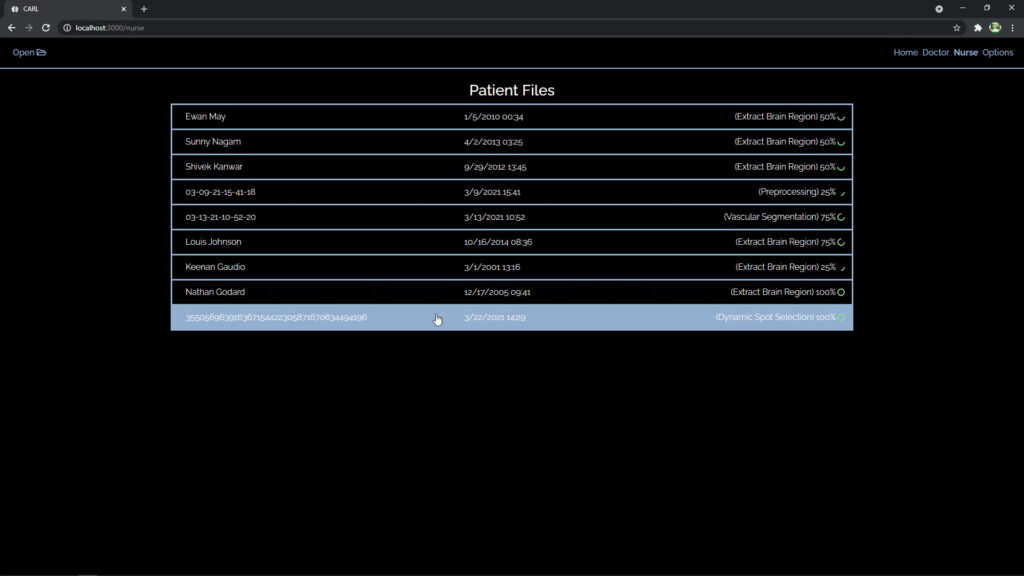
Nurse View – Patient List
If you are an intermediary physician or nurse and all you require is the status of the patient data that is being processed or a quick view of the brain.
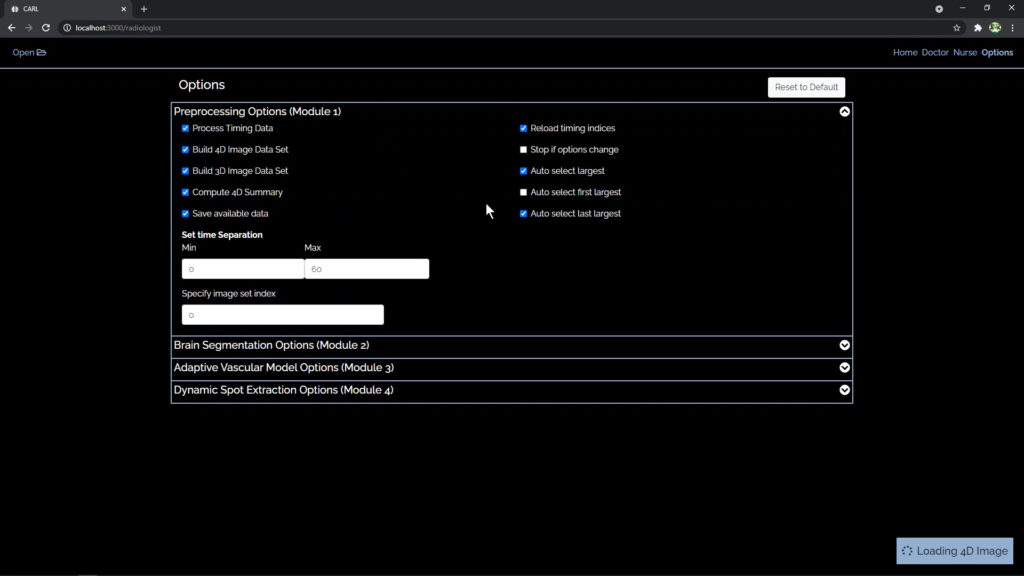
Radiologist View
If you are a technician, researcher, or radiologist you can set up imaging settings, a number of phases, and contrast/signal thresholds and run detailed analysis and experimentation.

SPOT Isolation
View the SPOT in 3D and over time, the location where the leakage of blood is occurring in the brain along with the vascular structure of the brain.
Details of CARL’s Design
HOW OUR DESIGN ADDRESSES PRACTICAL ISSUES
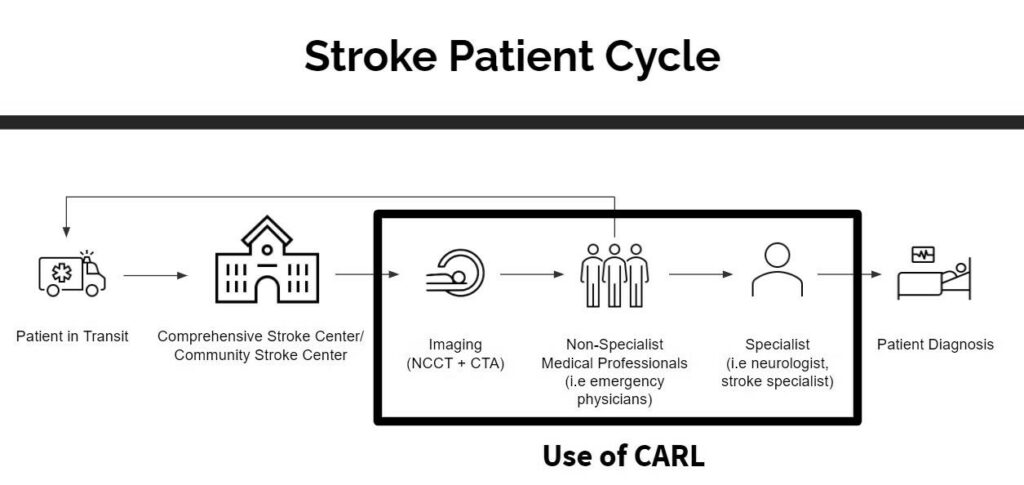
When the patient arrives in a stroke center, the physicians do not immediately know the type or severity of the stroke. Doctors need accurate data to aid in the diagnosis, so a series of CT brain scans of the patient is taken. While standard CT scans can quickly reveal the type of stroke that is occurring, the severity is unclear using existing professional image analysis. If there is an active hemorrhage, new scans may be required even if there is a specialized neurologist at the hospital to diagnose the patient. In these cases, the data a physician can access, and the quality of that data can mean the difference between life and death. Further scans are time-consuming and expensive, which means physicians must determine the severity of damage with the information they have.
CARL is a virtual tool to isolate, visualize and measure the growth of a hemorrhagic stroke in the brain. As a result, the cerebral leakage rate, and time of stroke can be statistically known metrics. It analyzes CT images to determine key biomarkers that aid physicians in deciding the correct prognosis in patients that are suffering from ongoing internal hemorrhaging. The prototype MATLAB code is currently designed for 19 phase dynamic contrast-enhanced CT (DCECT) from a Toshiba CT Scanner. CARL answers one of the most immediate questions when a patient is suffering from a hemorrhagic stroke – are they currently bleeding internally?
OUR CONTRIBUTION TO CARL
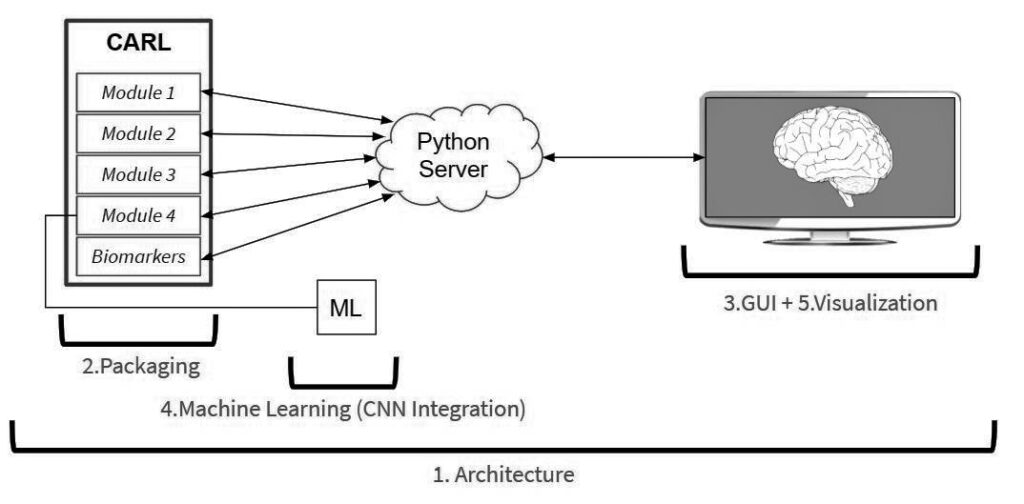
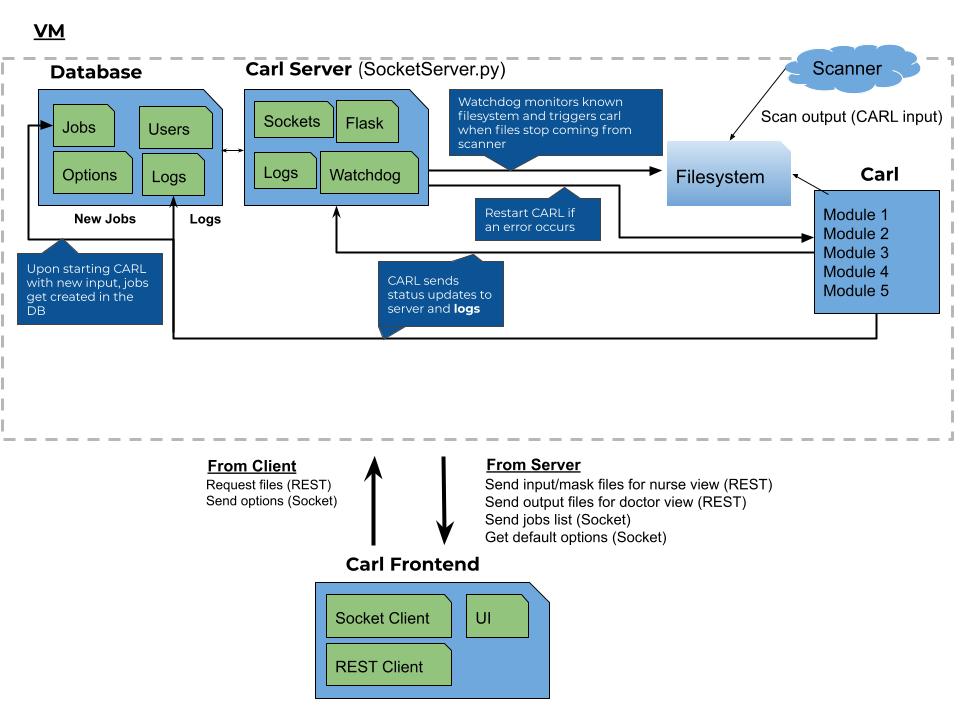
Given the extensive size of prototype code we were given, we decided to design a robust architecture surrounding it and focus on delivering valuable data to our users. While we still added Matlab code to improve the reusability of the given software, significantly more effort was put into distributed components that are designed to complement the existing Matlab code. In our new design, the MATLAB modules are executed through a Python Flask server, which controls communication to and from the original research code through the use of a MATLAB library for Python. This Flask server will also be used to direct relevant data to the front end for visualization by the user.
Design Solution
In addition, we used Postgres databases to store relevant persistent data and logs so any IT could review the tables and understand the current state of the system. Both Matlab and the Python server communicate directly with the database. We developed a RESTful API to allow the website to communicate with the server and fetch data on an as-needed basis, allowing for flexible communication. We also used web-workers on the frontend since the volume rendering is computationally expensive, which allows the frontend to remain responsive.
See the detailed design workflow diagram here.
WHAT MAKES CARL INNOVATIVE AND EFFECTIVE
SPOT Indication + Phases
The location of where the SPOT of the leakage of blood into the brain is highlighted where its growth can be seen clearly over time (phases) in 3D. They allow medical professionals to better understand the severity of the bleed to inform their prognosis. For example, if the leakage rate is relatively high (1.3 ml/min) and the bleed has not stopped it would be considered an emergency as opposed to a no-bleeding status or a relatively low leakage rate (i.e 0.1 ml/min)
Modularity
The separation between the MatLab SPOT identification algorithm, Python hosting server, and React frontend makes it easy to modify individual components of CARL and iterate quickly. Within each of these three programs, we use modular components and separation of concerns so that features can be added, modified, and tested with minimal effort.
Intuitive Design
We relied on usability reports from similar industry products and user testing to ensure CARL is easy to use and so it can be easily understood what’s happening on the screen. Features include contrasting colors, industry-standard fonts, loading/progress bars.
Web-Based
Our front-end is written in React and communicates with the Python server through web sockets. This makes CARL compatible with all major device categories, from servers and desktops to mobile devices. In an ideal case, a technician would start CARL on the hospital server, and doctors can see results on their iPad as the patient is moved to a new room.
Well Documented
Although we didn’t build CARL from scratch, and we won’t be the ones taking it to market. CARL has been built from the ground up to ease its transition to industry. All code we added to CARL is commented in a JavaDoc style, and CARL comes with extensive documentation including user manuals, details of major design decisions, design summary documents, and recordings of user testing.
HOW WE VALIDATED OUR DESIGN SOLUTION
The leakage rate inside the brain can only be validated or set to comparison by looking at annotated data, or data that has been marked by medical professionals for a particular study. Annotated data would need to be provided from several studies. These same studies would then need to be processed by CARL and the data would have to be compared. This type of data was not available to us and therefore we could not validate the methods used to locate the SPOT. However, it is important to note that only the location of the SPOT could be validated. The rate of leakage is a metric that cannot be validated because there are not any reliable methods to measure the rate of leakage inside the brain. Therefore the key component that can be validated is the use of CARL as a tool to inform research and software development; its value. Hence, we ran user testing with 5 industry experts including neurologists, interventional radiologists, and medical research chairs.
User Testing Results
From our user testing, we found that CARL would be extremely beneficial in the industry as a tool that would open up a world of research.
“There will finally be a way to co-relate the growth of leak, rate of leakage [of blood], hematoma [pool of blood], and develop informed treatments. This can be extremely useful”
Dr. Robert Fahed
Neurologist, Interventional Neuroradiologic – Dept. of Medicine at University of OttawaWe also were excited to hear that CARL would even likely be used by surgeons as a planning tool. But don’t take our word for it, hear this from one of the users Dr. Dowlatshahi himself.
The users also found CARL to be intuitive, preferred the minimalistic design, and liked the colour choices.
FEASIBILITY & NEXT STEPS FOR CARL
As our set project scope and as a result of our user testing CARL has proven its market value. CARL is now a tool that can be used to further the development of hemorrhagic stroke investigation software. But, what’s next?
1. Return to Research
CARL can now be returned to Dr. Hogan to continue his work on gathering enough data to justify a suitable range of severities of hemorrhagic stroke. Further studies will be conducted using both CTA and MRI scans as well as annotated data for analytical validation. The hematoma data will also be incorporated to generate its volume on the visualizer.
2. Software Development
The software will now be developed for industry application in parallel to the treatment research. This includes machine integrations with the imaging devices used to ensure that CARL can be set and manipulated directly.
3. More User Testing
Users such as nurses, medical imaging technicians, emergency physicians, etc. would need to test CARL to optimize the user interface and suggest additional features to integrate CARL seamlessly into the patient cycle.
4. Clinical Trials
Once enough research exists to inform treatments and the CARL is at the point of being a market-ready product, clinical trials would need to be conducted. These will ensure that CARL is safe, accurate, and market-ready.
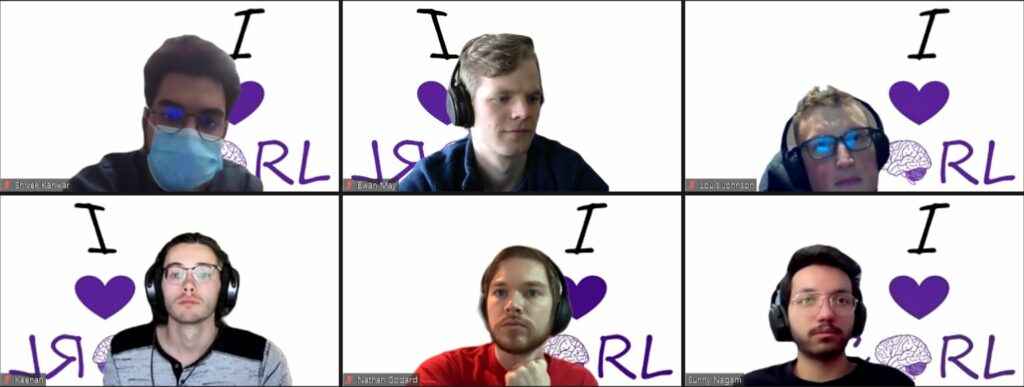
Our Team

Ewan May
| Full Stack Developer

Sunny Nagam
| Full Stack Developer

Keenan Gaudio
| Full Stack Developer
Louis Johnson
| Full Stack Developer

Shivek Kanwar
| Project Manager

Nathan Godard
| Full Stack Developer
Partners & Mentors

Circle Neurovascular Imaging (Circle NVI) is a Calgary-based medical imaging software company founded in 2019. The company was born through collaboration between physicians associated with the Calgary Stroke Program and Circle Cardiovascular Imaging (Circle CVI), a Calgary-based medical imaging software company and market-leader of cardiac MR post-processing software. Circle NVI develops and commercializes software to aid in acute stroke management through advanced visualization, AI-based image interpretation, and stroke team communication. Circle NVI’s mission is to enable the transformation of the acute stroke care pathway through a simple, more pragmatic approach to image interpretation and team collaboration.
We would also like to say a big thank you to our sponsor contacts, co-sponsor and academic advisor.
Dr. Chris Duszynski
Dir. Product Operations and
Ph.D. in Neuroscience
_________________________________
Circle Neurovascular Imaging
Dr. Matthew Hogan MD, PhD
Associate Professor, Neuroscience Program
Ottawa Hospital Research Institute
_________________________________
University of Ottawa
Dr. Elise Fear
Professor, Dept. of Electrical and
Software Engineering
_________________________________
University of Calgary
Gallery
How We Recieved CARL


Stroke Patient Cycle
Machine Learning Investigation
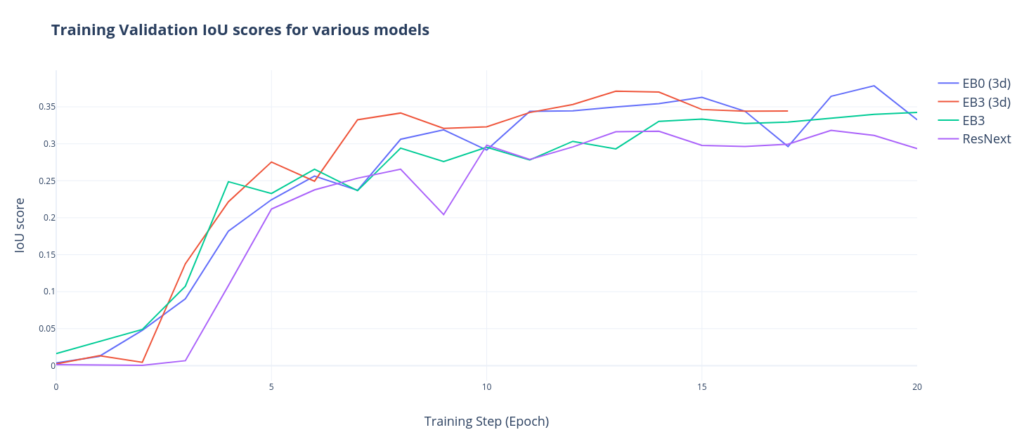
Throughout our research, we experimented with numerous machine learning methods and techniques to develop our own model to segment the hematoma (pool of blood) region of the brain in CARL scans. We found that the accuracy of our model did not transfer over from the training dataset to the CARL dataset as well as we would have liked, likely due to a lack of representative MRI labeled data. We’ve demonstrated that a model trained with the techniques we explored is capable of segmenting hematoma on a compatible dataset. This hematoma segmentation can be used to help the CARL program narrow down potential SPOT locations and also provide additional visual data for frontend users.

Detailed Design Workflow Diagram
Others


