Project Category: Multidisciplinary
Join our presentation
About Our Project
North American Helium (NAH) is a private helium exploration and production company based out of Calgary, Alberta with 3.8 million acres of property in Southwestern Saskatchewan and Utah. NAH is focused on long term growth and development and has initiated construction on the Battle Creek Purification Facility, which is expected to process 20 MMSCFD of raw gas. Through initial construction and design, areas of potential optimization have been realized which may significantly impact the company’s financial bottom line.
This project presents an analysis and design overview of the process optimization of NAH’s Battle Creek Purification Facility. It evaluates the feasibility of lowering plant emissions and subsequent taxes through the employment of a regenerative thermal oxidizer (RTO). This was determined to be the optimal solution through assessing economics, operations compatibility, and technical analysis. With the implementation of this design, a significant cost savings is realized.
Meet Our Team


Jocelyn Boytinck
Energy Engineer Student
Bachelor of Applied Tech. Petroleum Engineering
B.Sc. Geology


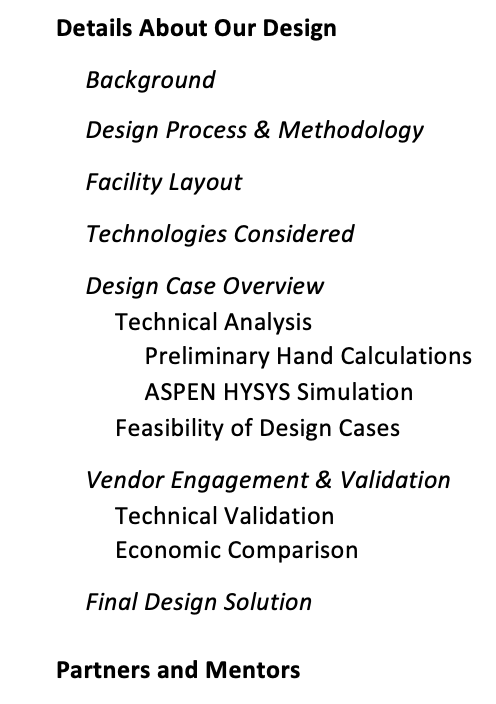
Details About Our Design
Website Layout
Background
North American Helium (NAH) is a private helium exploration and production company based out of Calgary, Alberta with 3.8 million acres of property in Southwestern Saskatchewan and Utah. NAH is focused on long term growth and development and has initiated construction on the Battle Creek Purification Facility, which is expected to process 20 MMSCFD of raw gas. Through initial construction and design, areas of potential optimization have been realized which may significantly impact the company’s financial bottom line.
This project presents an analysis and design overview of the process optimization of NAH’s Battle Creek Purification Facility. It evaluates the feasibility of lowering plant emissions and subsequent taxes through the employment of a regenerative thermal oxidizer (RTO). This was determined to be the optimal solution through assessing economics, operations compatibility, and technical analysis. With the implementation of this design, a significant cost savings is realized.
| Design Case | Description |
| Case 1 | Turboexpander for power generation |
| Case 2 | Regenerative Thermal Oxidizer (RTO) for emissions control |
| Case 3 | Sequestration for emissions control |
| Case 4 | Turboexpander and RTO for both power generation and emissions control |
Design Process & Methodology
Our project was a very dynamic process that involved many steps to come to our final solution. Generally we followed the following three steps to arrive at our final design solution.

Facility Layout
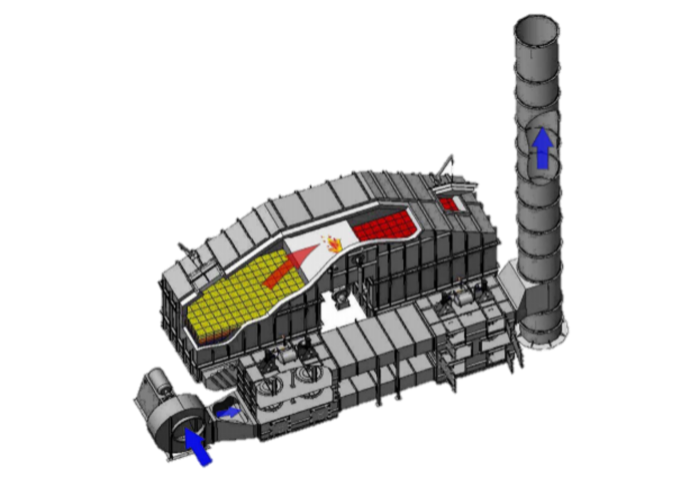
The Battle Creek Facility’s footprint covers a 200 X 200m plot of land which includes the inlet header, main process building and loading area. The red dashed box in the images below shows the boundary of the facility that our project scope was based on.
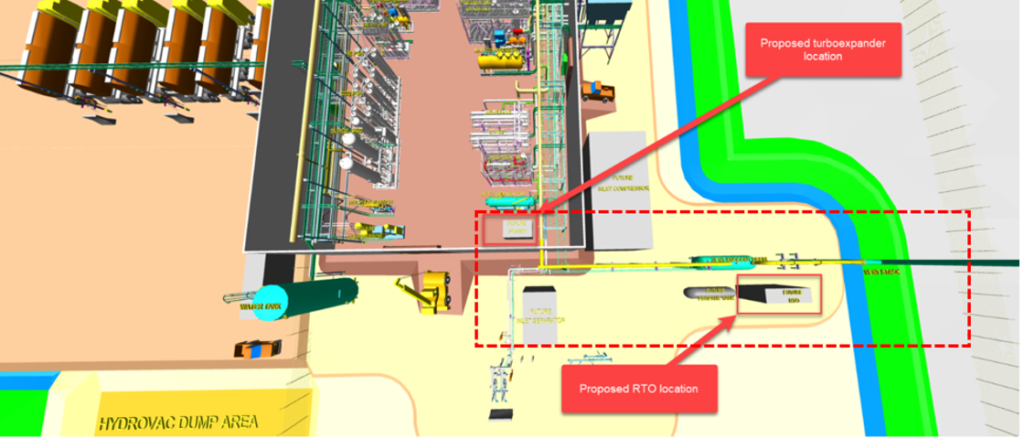
The proposed locations of the Turboexpander and RTO are both located within in the facility vent system which is downstream of the primary helium process. Having the turboexpander and RTO located here is to ensure that the main helium separation process is not impacted.
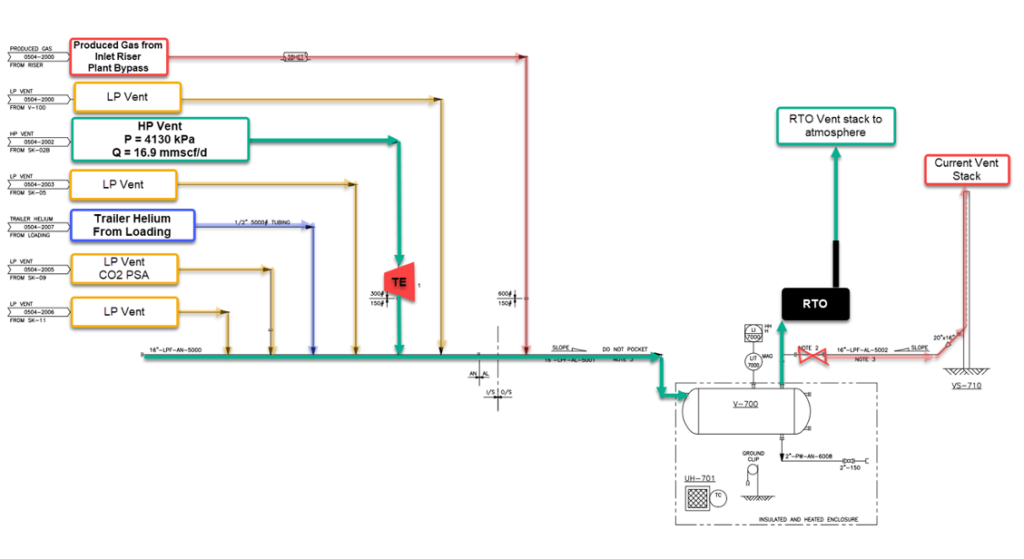
The facility has multiple vent lines that flow into a common vent header. It was decided that the high-pressure vent line had the most favorable operating conditions for the turboexpander application.
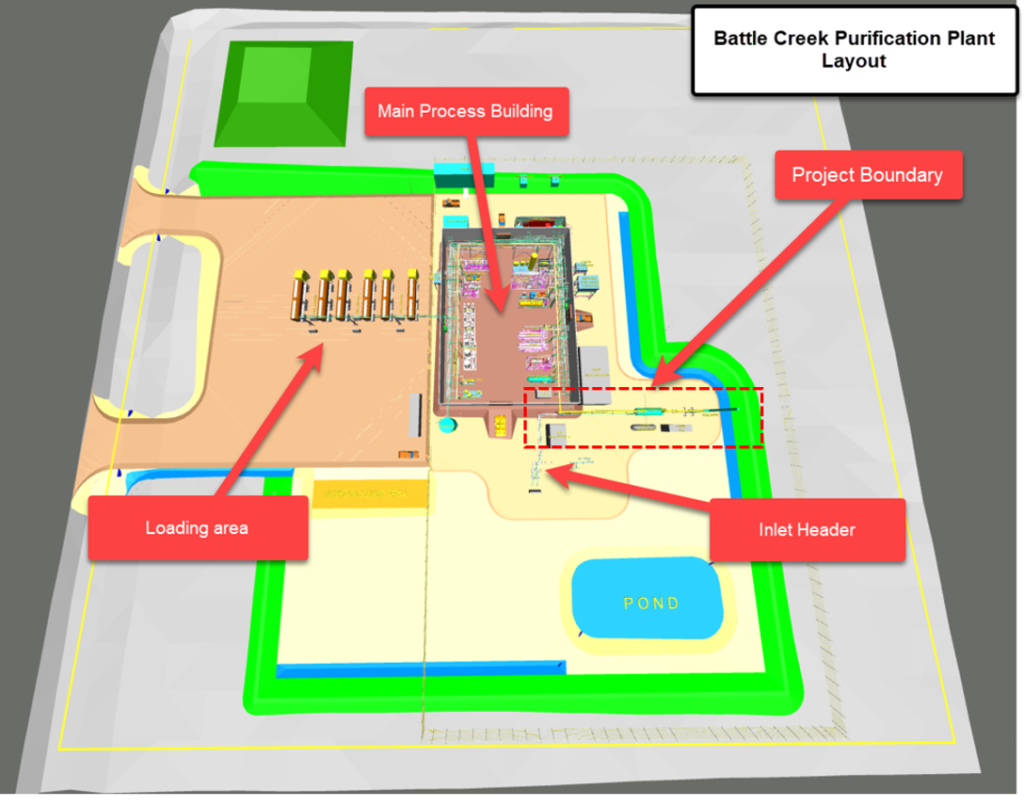
The proposed RTO location is downstream of the main vent header and immediately upstream of the facility vent stack to ensure that all vent gas passes through the RTO prior to being vented to atmosphere.
Technologies Considered
There were several factors we considered when determining which technology to deploy for this project. Cost, complexity, and applicability are the primary concerns during the process of technology selection. As NAH is a small company with budgetary constraints, implementing a technology that is not proven or is highly complex is risky and not desirable if a simpler solution exists. The goal is to have an established technology installed that has predictable maintenance and operating expenses to avoid potentially large, unexpected costs in the future. The technology is also required to be:
- Compatible with the current physical layout of the plant
- Applicable with the conditions and compositions of the continuous vent stream
- Self- sustaining, or prove economic with the addition of a fuel gas source as the plant design does not have a consistent source of fuel gas on site
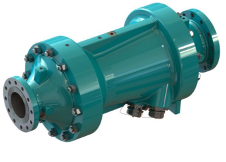
Turboexpander
Possible solutions we explored for reducing the electrical cost were stand-alone generation, solar power, wind power, and a turboexpander. NAH requires a steady electrical connection, without the need to consistently supply fuel. The most favourable option for power generation that meets these criteria is a turboexpander, which would utilize one of the high-pressure vent lines to convert kinetic energy to electrical energy through a generator.
Emissions Reduction
Though the potential long term cost savings for emissions reduction are quite significant, the objective remains to present the most economical solution. The economics for emissions reduction is a balance between emissions tax savings and the cost of the technology. Though some technologies are relatively inexpensive to deploy, the quantity of emissions reduced may still result in substantial emission taxes incurred. Likewise, the highest emission reduction technology may not be economically favorable due to the associated technology costs.
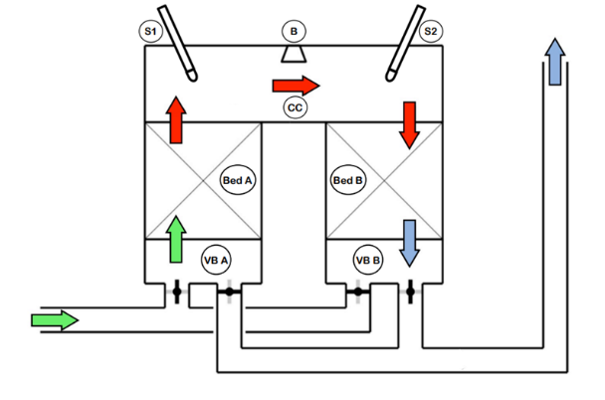
Regenerative Thermal Oxidizer (RTO)
After considering the technology requirements, a regenerative thermal oxidizer (RTO) was selected as a viable technology to reduce emissions at the NAH facility. RTO’s are commonly implemented in processing facilities with low volatile organic compound (VOC) concentrations. This includes methane which is the primary component of interest for this project as it is the highest contributor to the emissions tax.
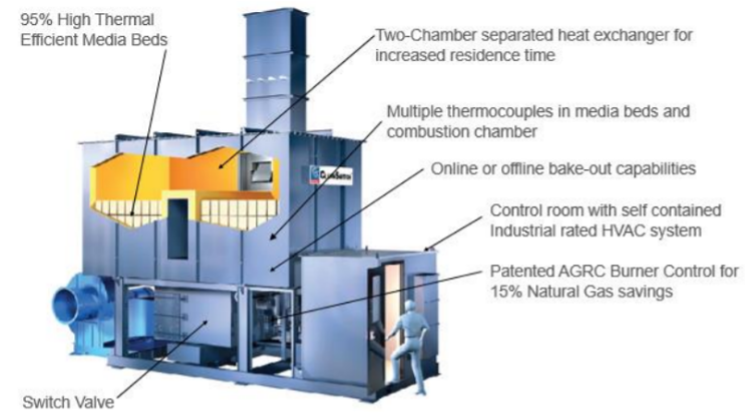
The RTO’s primary function is to bring the exhaust gas to high enough temperatures for combustion of VOC’s. Supplemental fuel and fresh air are required upon start up and propane will be kept on site for this purpose. Once desired temperatures are reached, exhaust gas is combusted with a destruction and removal efficiency (DRE) of up to 99%. Heat recovery is maximized during this process by alternating inlet and outlet flow direction through ceramic beds every few minutes by a series of valves . By alternating the flow within the RTO, the unit can be self-sustaining by utilizing the VOC’s as fuel, hence why no supplemental fuel gas is required.
Sequestration
In addition to the RTO as another form of emissions reductions, sequestration of vent gas from the Battle Creek Facility was into nearby injection wells was considered as an alternative option to reduce emissions and avoid the associated taxes.
Design Case Overview
Case 1: Turboexpander
The implementation of a turboexpander application will help lower plant electrical costs by converting kinetic energy of the R10 high pressure vent stream into usable electrical energy. The R10 vent stream was chosen due to its operating pressure and temperature of 4130kPa and 38 degrees Celsius, respectively. Our analysis and design assumed that the inlet pressure and temperature of the turboexpander would be constant throughout the life of the plant. A max power scenario was analyzed which resulted in a max power output of 880 kW. Although this seemed favourable, simulation proved two unfavorable outlet conditions, liquid drop out and low outlet temperature.
Further simulation and sourcing of different expander technology showed a more realistic power generation of 127 kW using a two-stage pressure drop to remedy low outlet temperature and liquid drop out.
Case 2: Regenerative Thermal Oxidizer (RTO)
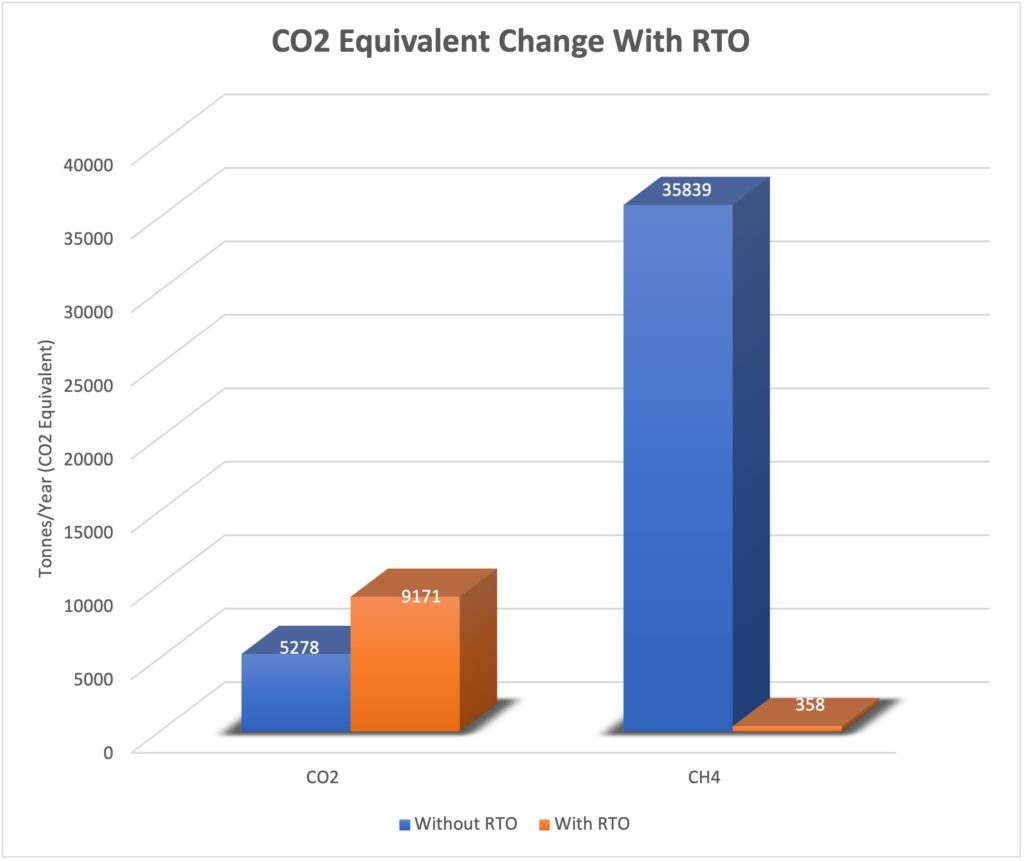
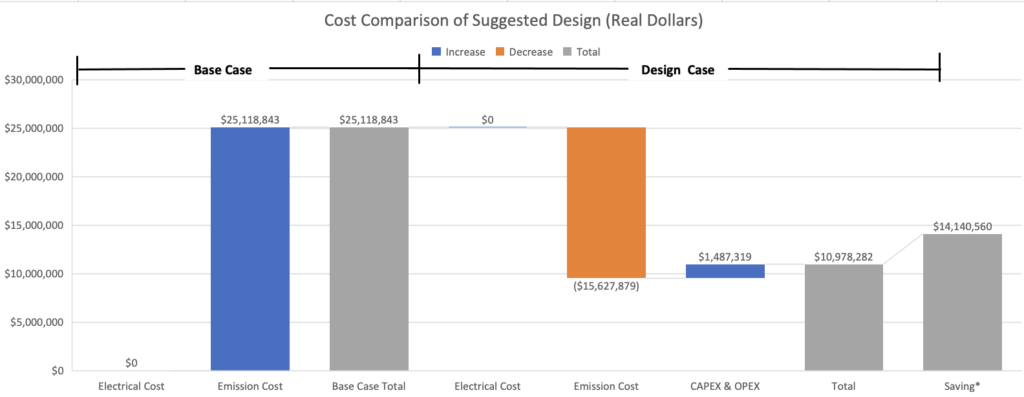
The implementation of an RTO application to convert Methane gas to Carbon Dioxide showed substantial reduction of potential carbon taxes. Although the process stream of study has trace amounts of Methane (~1.45%), the global warming potential of Methane is 25:1 to that that of Carbon Dioxide which has a large impact when calculating emission taxes. The regenerative thermal oxidizer will be able to convert up to 99% of the methane stream to CO2. This will be able to reduce the emissions from 41,117 Tonnes CO2e / year to 9,529 Tonnes CO2e / year.
Case 3: Sequestration
Sequestration of the facility vent gas was briefly examined as an additional solution to lowering the amount of Methane released to the atmosphere. This case assumed that all facility emissions were sequestered. Nearby wells were considered for injection purposes into the Upper Shaunavon formation, an abandoned oil producing formation in the area. Total facility emissions of 7,154 MMSCF per year would theoretically be stored underground reducing the emission impact of the facility to essentially zero. Preliminary analysis showed promising economic results but due several risks involved such as insufficient reservoir data, large CAPEX costs, and licensing this case was ruled out.
Case 4: Turboexpander and RTO
Design Case 4 utilizes both a turboexpander and an RTO which allows for a potential overall design solution that addresses both challenges associated with electrical costs and emissions. Combining technical aspects from Case 1 and 2 allowed us to determine the operating relationship of both the RTO and turboexpander. Through simulation we found that the pressure drop across the turboexpander needed to be through two stages utilizing a Joule-Thomson valve. This was needed to ensure that the exit temperature of the turboexpander remained within the range of 11 – 38 degrees Celsius. As mentioned previously in Case 1, by limiting the pressure drop across the turboexpander, the maximum amount of available power was 127 kW. The regenerative operation of the RTO is very dependent on the inlet temperature of the process stream. With the lack of fuel gas available on site, the RTO needs to maintain an operating temperature in the combustion chamber between 815 – 843 degrees Celsius to ensure self-sustaining operation.
Technical Analysis
Preliminary Hand Calculations
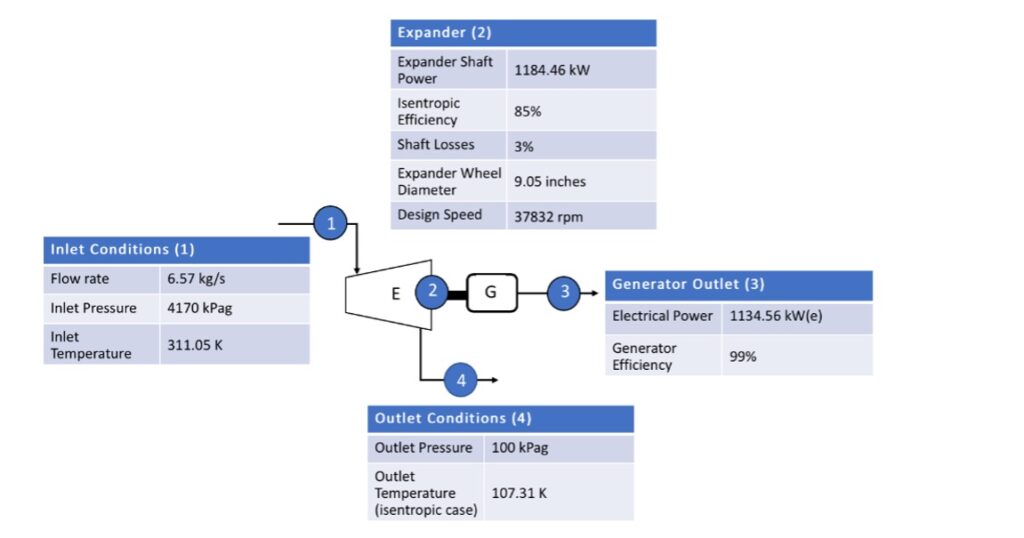
To initially assess the feasibility of installing a turboexpander to decrease operational costs, research was done on the technology and preliminary hand calculations were performed. For the preliminary calculations, the maximum efficiencies were used to determine the feasibility of the best-case scenario. If the turboexpander was not feasible in this case, it would not be feasible for any subsequent cases.
For the calculations and sizing, the following assumptions were used:
- Pure nitrogen stream (actual stream ~97% nitrogen)
- Constant specific heats (reasonable for nitrogen at these temperatures)
- Shaft losses 3%
- Ideal gas (Z=1)
- Isentropic efficiency 85%
- Generator efficiency 99%
The pure nitrogen stream assumption was used to simplify the process since our actual stream has multiple components, process calculations by hand with multiple components is very complex and unnecessary due to the utilization of software to simulate the process, providing more realistic results.
We applied knowledge from school, textbooks, and industry technical papers to achieve the results for the hand calculations. The following were determined with hand calculations:
- Power output
- Expander outlet temperature
- Design speed (RPM)
- Expander wheel diameter
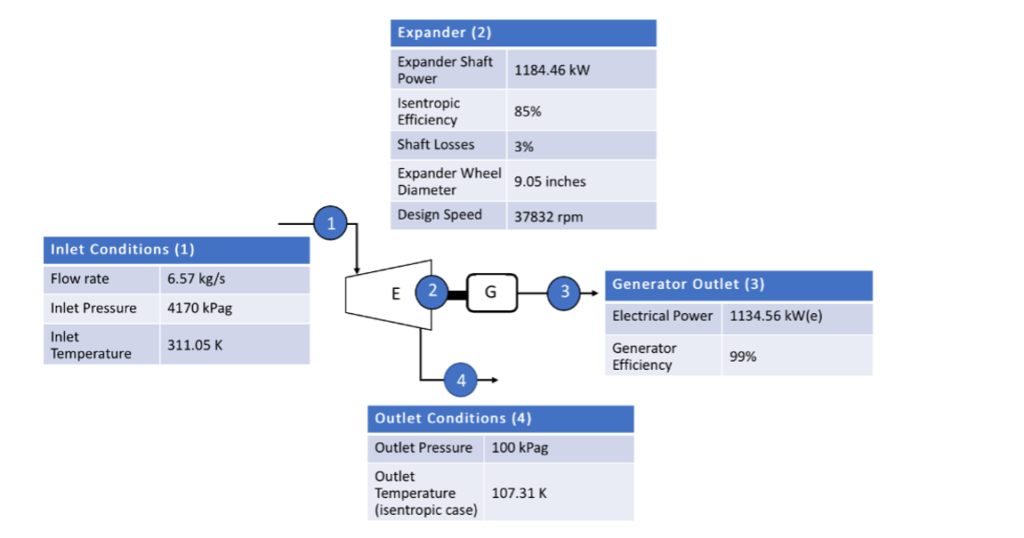
All results and inlet/outlet conditions are summarized above. As mentioned previously, these results are for ideal conditions only and are therefore not realistic for our application. They do, however, provide us with an indication of feasibility. Further analysis was conducted using Aspen HYSYS which is further explained in the section below.
ASPEN HYSIS Simulations
Using Aspen HYSYS simulation software, we determined process concerns associated with design cases such as inlet/outlet pressures and temperatures, as well as liquid accumulation. Based on the results of the simulations, iterations were performed until acceptable results were achieved in order to proceed forward as a viable solution.
Turboexpander Simulation
Using Aspen HYSYS, multiple turboexpander scenarios were evaluated by varying the outlet conditions of the turbine. This was done to determine the maximum available power, as well as model the risk of unfavorable outlet conditions. The two most significant unfavorable outlet conditions determined were:
- Drop out of liquid content due to large pressure drop.
- The presence of liquid in the outlet stream could cause erosion of the pipeline or other components.
- A small fraction of the inlet stream contains hydrocarbons that could potentially collect in a section of the pipeline and pose an explosion risk.
- Accumulation of liquids amounted to ~4.8m3/day which would require disposal and potential for additional process equipment to handle these liquids.
- Low outlet temperature
- Low outlet temperature creates significant freezing issues which can lead to blockages in piping creating operational risk and safety concerns.
- In Case 1 (turboexpander only): only piping design would need to be considered.
- In Case 4 (turboexpander + RTO): outlet temperature of the turbo expander needs to be limited to ~20°C to accommodate RTO operating requirements.
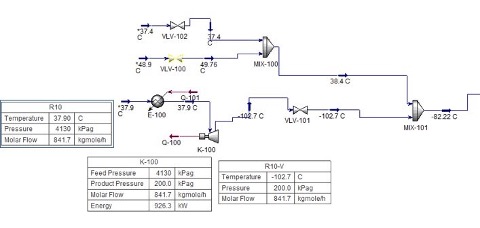
The simulation shown in the figure below shows a max power generation capacity of 926.3 kW (880 kW when generator efficiency applied) by limiting the output of the HYSYS simulations to 2 bar gauge creating an outlet temperature of -103°C. Power generation of 880 kW would save NAH approximately $890k/year after installation or a savings of $0.03/kWh.
This outlet temperature of -103°C creates significant process concerns such as freezing, and liquid drop out which were previously mentioned. To address these concerns a couple solutions were proposed to help mitigate this risk:
- Pressure control on outlet of turboexpander to reduce overall pressure drop.
- Heating of inlet gas to turboexpander with heat exchanger.
Both proposed solutions may drastically change the economic viability of the turboexpander generator application due to:
- Reduction of power generated due to reduction of pressure drop.
- Increased capital of adding heat exchanger to process flow.
- Additional power requirements of heat exchanger.

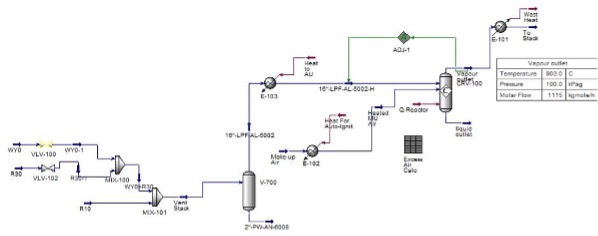
RTO Simulation
Aspen HYSYS was used to validate the output composition for the RTO process (shown figure below ). This confirms that the destruction and removal efficiencies provided by vendors are accurate and will ensure the reduction of emissions and associated taxes. Results from simulations have shown that conversion of Methane to Carbon Dioxide with the use of an RTO are significant and have a strong potential to add value for NAH. Table 1 below shows the comparison of tonnes of CO2 Equivalent with and without the installation of an RTO.
Turboexpander and RTO combined Simulation
Findings of our simulation of the combined applications on Aspen HYSYS showed that the outlet temperature of the turboexpander has a significant impact on the operability and efficiency of the RTO. Through simulation and research of technical specifications, we found that the inlet of the RTO needs to remain at ~20°C and 200 kPa for optimal operation.
This requirement required the outlet pressure of the turboexpander to be limited to 3,226 kPa to ensure that the stream temperature at the inlet of the RTO stayed consistent at ~20°C. Outlet pressure of the turboexpander is further reduced as the outlet piping of the turboexpander is increased from the process piping into the main vent header. Pressure reduction continues as the vent gas flows into the vent knockout drum before reaching the inlet of RTO.
When limiting the pressure drop across the turboexpander, this resulted in a reduction of available power. Limiting the outlet conditions of the turboexpander allows the RTO to operate within its preferred temperature range which ensures its self-sustaining nature, reducing the need for constant fuel gas. Simulation also has shown that the reduction of pressure drop across the turboexpander also reduces the risk of liquid drop out as the outlet conditions of 20°C and 3,226 kPa are well above the dewpoint of stream components. Restricting the outlet pressure of the turboexpander resulted in a maximum available power of 127 kW.
The regenerative operation of the RTO is very dependent on the inlet temperature of the process stream. With the lack of fuel gas available on site, the RTO needs to maintain an operating temperature in the combustion chamber between 815 – 843 ͦC to ensure self-sustaining operation.
Upon realization of understanding the need for self-sustaining regenerative process of the RTO our group decided to limit the outlet conditions of the turboexpander to ensure that the operation of the RTO was not adversely affected.
Feasibility of the Design Cases
Based on economic and technical analysis, our team recommended Case 2 – RTO design, as the preferred design case. This is due to the high economic benefit and low technical and operability risk.
| Indicator | Case 1 Turboexpander | Case 2 RTO | Case 3 Sequestration | Case 4 Turboexpander & RTO |
| Δ NPV 9% ($MM) | $0.196 | $8.9 | $10.8 | $7.2 |
| Payout (Years) | 4.5 | <2 | <2 | <2 |
| ROR (%) | >50% | >50% | >50% | >50% |
| Cost Savings per year ($MM/Yr.) | $0.659 $0.0046/kWh (electricity savings) | Average $1.31 | Average $1.60 | Average $1.38 $0.003/kWh |
| CAPEX ($MM) | $0.3465 | $2.0 | $1.75 | $2.12 |
RTO Vendor Engagement & Validation
Several vendors were contacted to provide quotes for an RTO, four quotes were obtained that were suitable for the specific plant conditions and flow components for this project. Continuous vendor engagement included data quality, plant compatibility, project timelines, capital and operating costs, remote assistance, service representatives, product maintenance and warranties. See below for the technical validation and economic comparison of vendor data.
Technical Validation
To validate our technical analysis and vendor values, further literature review from scholarly articles was conducted to ensure that vendor and simulation values were aligned with literature values. Technical factors that were analyzed were residence time, thermal efficiency and destruction and removal efficiency (DRE).
Residence time of the RTO was a key parameter that needed to be validated to ensure that optimal Methane destruction was achieved. This parameter is very complex in nature and for our group to accurately model it was out of the scope of our project. Using literature sources that modelled residence time in an RTO we were able to compare these values to the residence values quoted from vendors. The following table shows residence time difference between vendor data and literature values.
| Vendor | Residence Time (s) | Residence Time average from Literature (s) | Percent Difference (From Literature) |
| 1 | 0.3 | 0.6 | 67% |
| 2 | 0.5 | 0.6 | 18% |
| 3 | 0.4 | 0.6 | 40% |
| 4 | 0.4 | 0.6 | 40% |
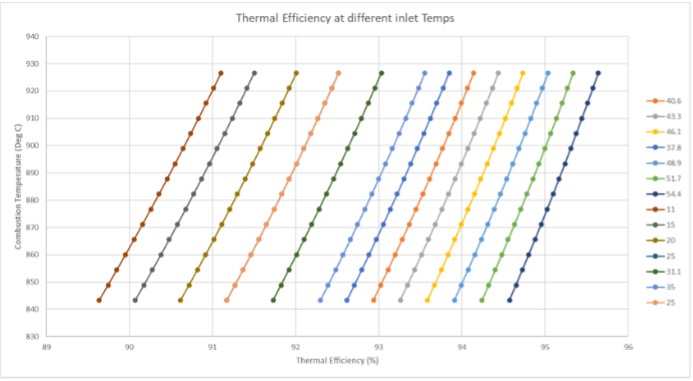
Thermal efficiency was evaluated at different inlet temperatures, as expected, we found that lower inlet temperatures reduced the thermal efficiency of the RTO. The following graph illustrates this relationship.
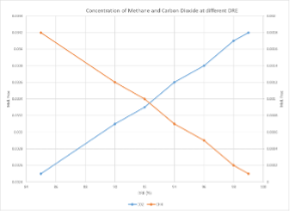
Destruction and removal efficiency (DRE) of the RTO was validated by evaluating Methane and Carbon Dioxide concentrations at different DRE values. As DRE increases, Methane concentration decreases, and Carbon Dioxide concentration increases.
Economic Comparison
Our economic comparison included the 4 vendors with the following assumptions:
- NPV discounted at 9%
- Economics discounted to Jan 1st, 2021
- Only Unit Capex and Startup/Maintenance considered
- Unit Purchased in 2023 and ready to operate Jan 2024
- Emissions cost based on Destruction Removal Efficiency (DRE) of vendor
| Vendor | Unit Price ($MM CAD) | DRE | Emission Cost (Real $MM CAD) | Δ NPV ($MM) | ROI | Payback Period (Years) | Expected Savings (Real $MM CAD) |
| 1 | $0.83 | 98% | $9.49 | $6.83 | >50% | <1 | $14.57 |
| 2 | $1.25 | 98% | $9.49 | $6.48 | >50% | <1 | $14.12 |
| 3 | $1.22 | 98% | $9.49 | $6.50 | >50% | <1 | $14.14 |
| 4 | $1.36 | 99% | $9.40 | $6.39 | >50% | <1 | $14.03 |
| Turboexpander Vendor | Unit Price & Freight ($MM CAD) | Δ NPV ($MM) | ROI | Payback Period (Years) | Expected Savings (Real $MM CAD) |
| Vendor 1 | $0.83 | $0.196 | >50% | 4.5 | $0.659 |
Final Design Solution
Based on technical, economic, and qualitative analysis our team overall recommended Design Case 2 which includes an RTO only design and we are suggesting Vendor 4 as our RTO supplier of choice.
Although the turboexpander application is appealing we feel that the economic benefit is not as favourable as the RTO. In addition to economics, the operability of both the RTO and turboexpander in series may not always be conducive to constant steady state operation of the RTO. The lack of fuel gas available on site means that self sustaining operation of the RTO is vital in ensuring that methane conversion is achieved as supplemental fuel would not be available to account for lower inlet process temperatures. To mitigate risk of lower inlet temperatures at the RTO we feel that it would be the best option to only operate the RTO.
This decision to go with Vendor 4 was based mainly on qualitative factors since technical and economic results from vendors were very similar. Qualitative factors considered were data quality, plant compatibility, procurement timeline, service support, service representative availability, product maintenance and warranties. Based on these metrics, Vendor 4 showed superior results to other vendors.
Throughout the 15-year project life, the RTO supplied by Vendor 4 will provide North American Helium with:
- An NPV of $MM 6.39
- ROI of > 50%
- Payout of < 1 year
- Expected savings of $MM 14.03 in emission taxes.
Additionally, this product will reduce NAH’s environmental footprint by reducing plant emissions from 41,117 Tonnes CO2e / year to 9,529 Tonnes CO2e / year.
Partners and Mentors
Our project would not have been possible without the support and mentorship from the multiple stakeholders involved with this project. We would like to extend a very special thank you to our industry sponsors and our academic advisors, without their support and guidance our project would not have been possible.
Industry Sponsors: NA Helium
Marlon McDougall – North American Helium
Stuart Ridgeway – Journey Engineering
Academic Advisors:
Dr. Kazi Sumon – Department of Chemical and Petroleum Engineering
Dr. Roes (Arief) Budiman – ENGG 501/502 Course Instructor
Peng (Penny) Gong – Teaching Assistant
Haobin (Peter) Chen – Teaching Assistant
Our photo gallery