Project Category: Energy Engineering

Join our presentation
About our project

The team, sponsored by a Canadian Oil and Gas company, set out to design a net zero emissions 4 well gas pad. This is defined as the sum total of emissions from the pad equating to zero. Our sponsor has set a public goal to achieve a 25% reduction in emissions by 2025 and net-zero by 2050. This will be achieved through a variety of emission reduction initiatives and technologies. Our project has the potential to be part of the solution for achieving or exceeding this goal. The primary objective of this project is to provide a re-designed solution which achieves net-zero for the existing standard gas pad design.


Original Design
Original Design
One of the major drivers for this project is the changes made with the release of Directive 60 from the Alberta Energy Regulators (AER). The directive changes the allowable release of methane emissions, with a particular focus on instrumentation and chemical pumps. The most relevant section of the directive reads:
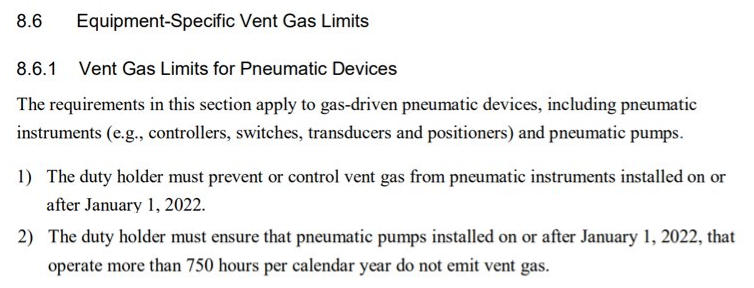
This provided the framework for tackling the problem, the implication of the above is that the greenfield (newly constructed) production wells will need to either have a vapor recovery system, switch to electrical powered systems or switch to air power pneumatic systems.
Through the generosity of our sponsor, we were provided detailed schematics (PFDs and P&IDs) of the inner components of the current well designs. Due to the proprietary nature of this technology, the team has made a PFD representation of the wellhead system under analysis. The diagram below shows the processing infrastructure to one of the production wells. The emissions produced from the asset are highlighted by red circles.

A mixture of gas, water and condensate are produced to surface from a reservoir, deep beneath the earth. This mixture is routed to a heated sand separator unit which removes many of the solids, such as sand. After leaving the sand separator, the pressure of the mixture is reduced in a gas separator vessel. This allows the heavier parts, the water and condensate, to drop to the bottom while the gas exits the top and travels down the sales line. The condensate is measured and, as it is of high value, reintegrated into the sales line downstream. The water is sent to a produced water tank where it is trucked out at a later date.
Analyzing the data provided to us, we investigated each part of the production system for potential emission sources. There were four emission culprits identified from regular operations: pneumatic instrumentation, pneumatic chemical pump, catalytic heaters and the produced water tank. These sources are described in more detail below.
Through investigative analysis, we evaluated a myriad of alternatives in the interest of arriving at a solution. It was found that the most likely path to success was to convert the pneumatic instrumentation and pumps to electrical power and analyze vapor recovery technology for a high-pressure application.
Instrumentation
A variety of pneumatic devices are used in the operation of the gas pad, including controllers, pressure and level switches, transducers, valves, etc. These pneumatic devices use pressurized natural gas for actuation and signals, and will release the natural gas to the atmosphere as part of normal operations. High-bleed devices will bleed and emit more than 6 standard cubic feet (scf) of methane per hour and can average about 4 tonnes of methane bled per year.
Heating
Catalytic heaters work by combusting natural gas at low temperature. There is no flame and the only products of the reaction are CO2 and water vapor.
Catalytic heaters do not have a vent, so direct capture of the emissions is not plausible. The original design uses three heaters, one in the sand separator building and two in the gas separator building.
Pumps
Methanol is injected into the gas lines to prevent the formation of hydrates, which occur mainly due to pressure and temperature fluctuations. When formed, hydrates can halt production and may have to be “pigged” out of the line. There are three types of chemical pumps: pneumatic, low-bleed pneumatic, and electric. The design uses a pneumatic and solar powered pump for downhole and sales line hydrate mitigation.
Produced Water Tank
Water drops out of the gas in the separator unit and is moved to a produced water tank, which is open to atmosphere outside the gas separator building. The pneumatic fuel gas from the instrumentation and pump are also routed to the tank. This is done as a safe venting practice so there is no risk of accumulating flammable gasses in the building. The water goes from high pressure to low pressure and “flashes” the solution gas to atmosphere.
PV Solution
Background Information
Bifacial panels increase the array power density by capturing additional energy from the light reflected from the ground below and around the panels. They can increase array efficiencies in ideal conditions with high albedo. However, this bifaciality is highly dependent on the reflectivity of the surface below.
In the modelling for this effect, the summer and winter albedos in Alberta were taken into consideration, and the use of bifacial panels in our scenarios decreased array size significantly.
These values were applied to real-world data to achieve a robust estimate of monthly albedo. This albedo was then used to calculate the bifaciality. The additional production effect from the high albedo of snow proves useful in increasing energy capture during the leanest months.
Fox Creek was chosen as a representative data set for this model as it is an area of operations for our client. Additionally, Fox creek provides insolation and solar potential data values similar to the mean in Alberta.
Within all the cases in Alberta, Calgary displays the best generation potential, and High Level the worst. This sensitivity to location can be seen in the required panel areas for each location, with more northerly locations needing larger array capacity.
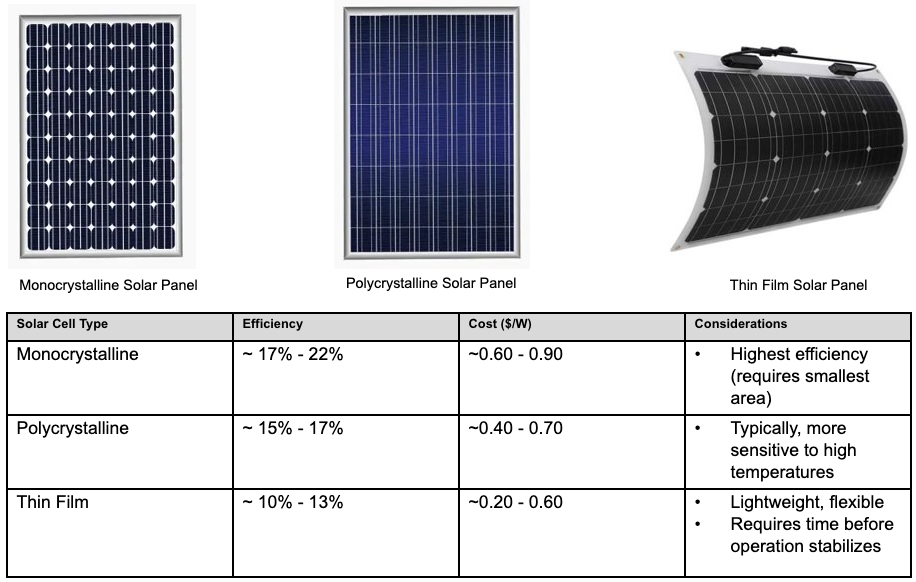
Solar Panels
The albedos used for summer and winter were acquired from a research study conducted in the Fox Creek area. The average albedo in the winter is ~0.60 and the summer is ~ 0.17.
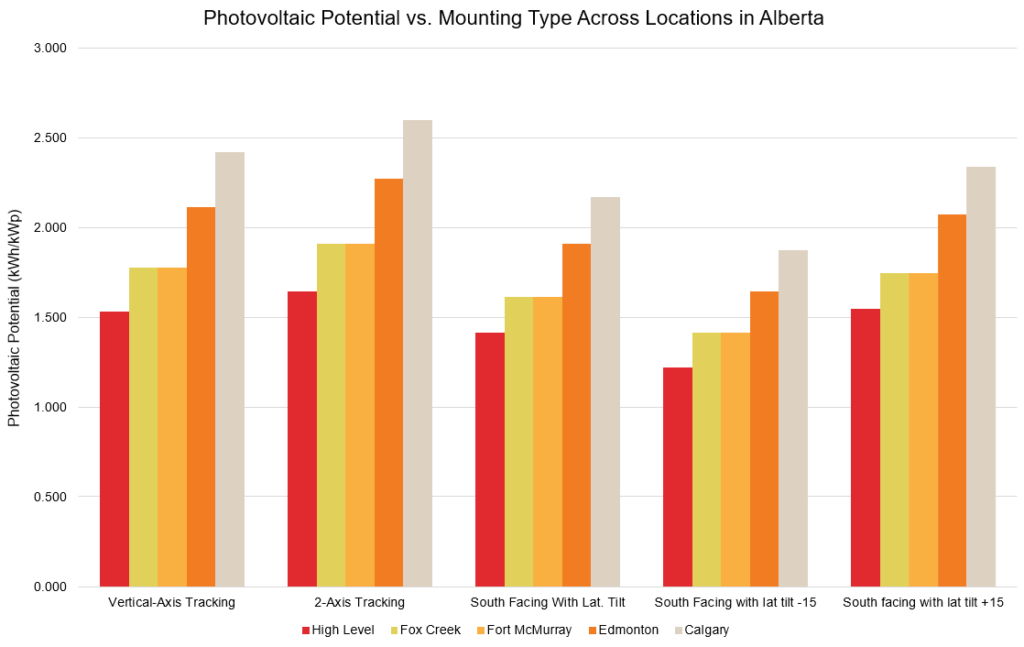
Above is a chart showing the differences in photovoltaic potential found in different locations in Alberta with a range of mounting systems. 2-Axis tracking allows the system to track the sun most accurately, hence having higher efficiencies. Vertical-axis tracking follows the sun in one-axis and is a reasonable middle-ground for performance and cost. The south facing iterations are a fixed system with a panel angle that requires seasonal change. This alteration is manually made and can allow for reasonable performance and lower cost.
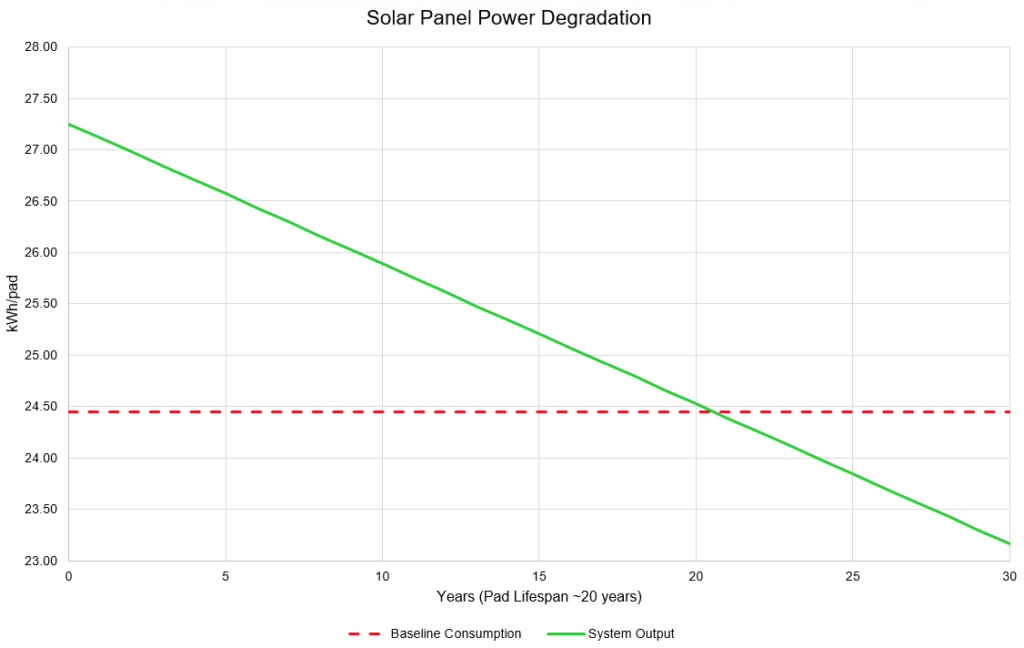
This chart displays the power output versus time, creating a degradation curve over the 20 year lifetime of the pad. As you can see the design starts out as being well oversized, and output meets the baseline consumption at 20 years.
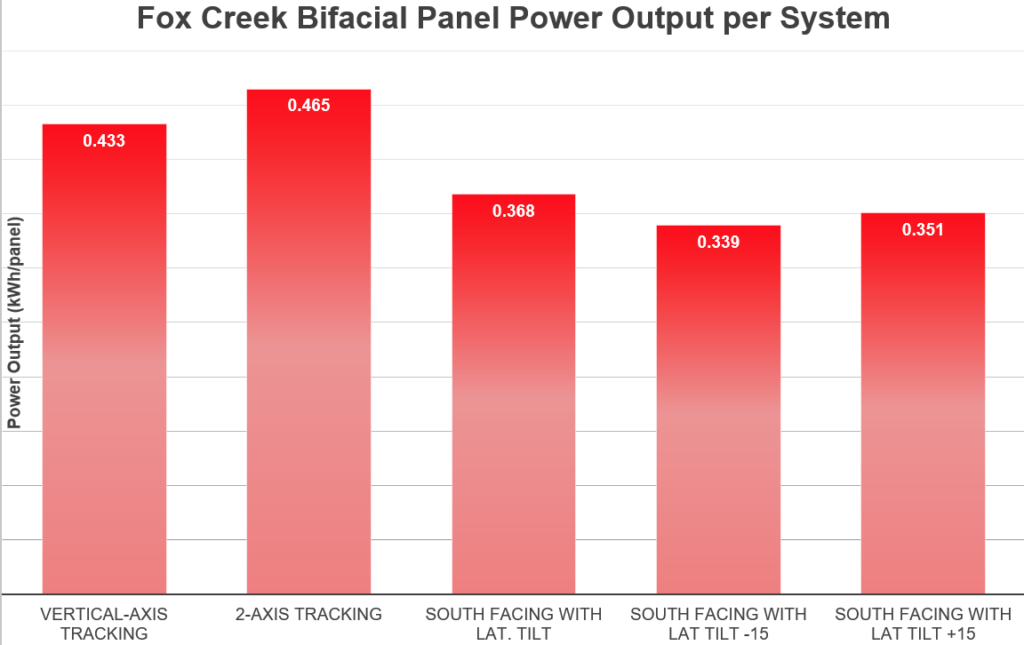
Fox creek was chosen as an area of operations due to industry needs in the area. This was a median point for solar potential in Alberta and served as a good benchmark location. In the chart above, the differences in the power output per panel, with different types of mounting systems, can be observed.
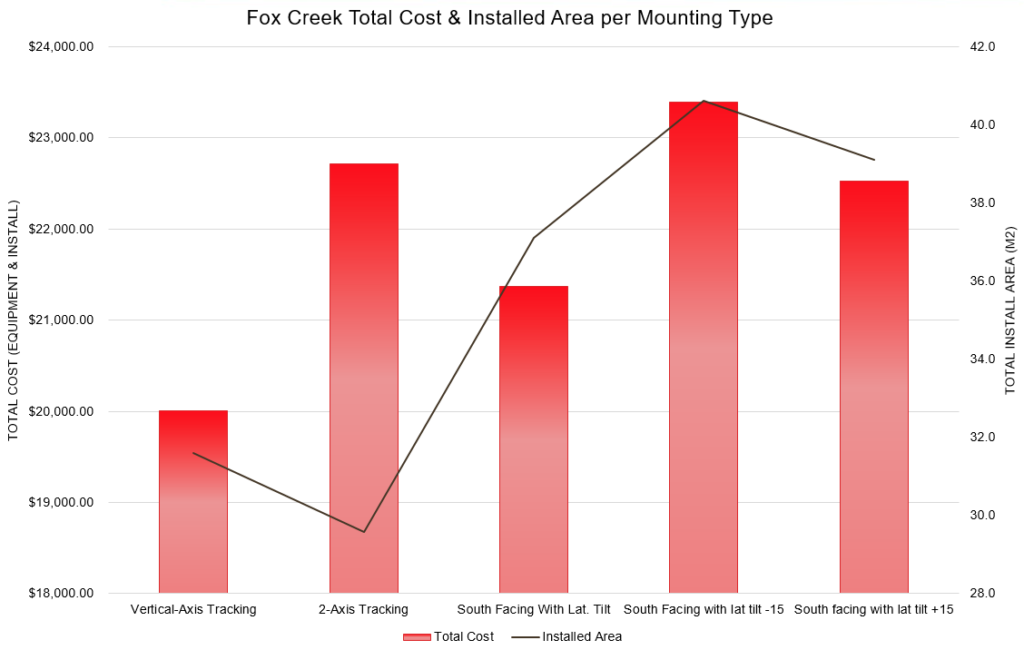
Above is a comparison of cost and installed area dependent on each mounting type. Installed area is an important consideration as space on lease is at a high premium. To be feasible the installed areas should ideally be as small as possible. The vertical axis tracking system provides an excellent approach to the problem.
Battery and Inverter Selection
Two battery alternatives that were examined are the AGM sealed lead acid and lithium ferro phosphate. These batteries are similar in terms of operating conditions required, they are maintenance free and do not need venting. The key differences are highlighted below:

Although lithium batteries have a better Depth of Discharge (DOD 80%), it does not make up for their high cost. Over the 20-year life of the well, the total cost for lithium is ~$50k versus about half that for the selected AGM at ~$26k.
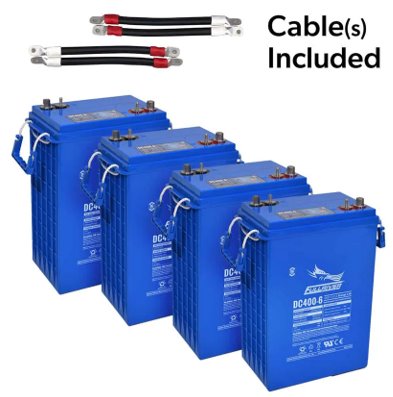
For the System to work, 8 AGM sealed lead acid batteries are required for each well. Based on the battery specifications each battery weighs ~123 lbs. Therefore, the total weight of batteries required per well ~986 lbs.
The manufacturer recommends a spacing of ~12.5 mm between each batter in the bank. Using the dimensions, the total area (WxL) required per well ~0.45 m2 to supply power to each well for ~3.25 days.
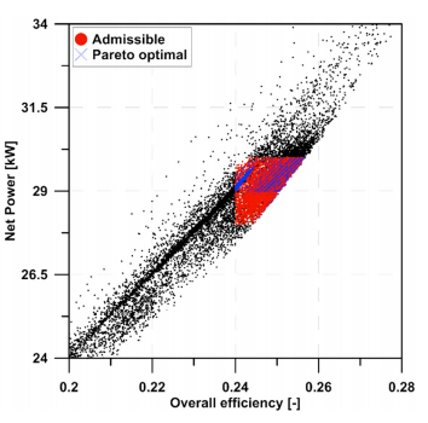
SAMS Modeling
The results from data modelling were compared to computer modelling with the aid of SAMS. This provided excellent data points to compare the validity of our solution.
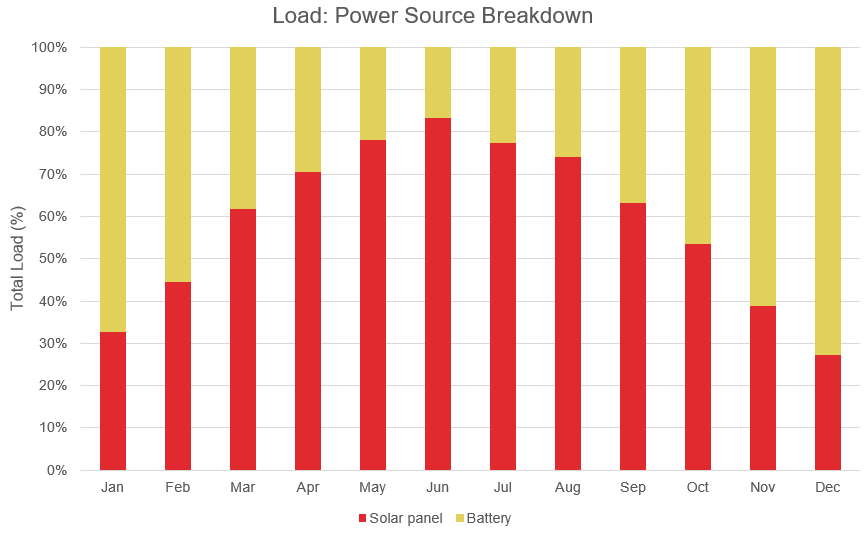
The power source breakdown can be seen above with total load and draw breakdowns. It is visible that the batteries are discharged heavily in the winter months without much input, and conversely, the summer months have an excess of power.
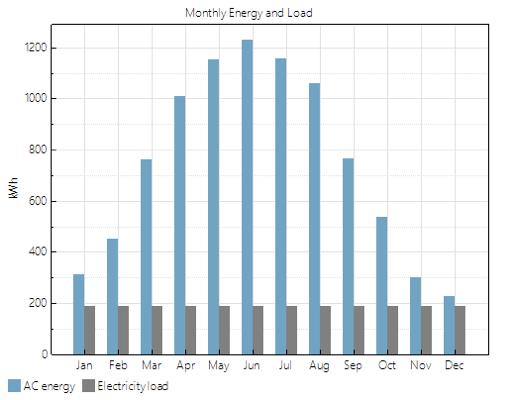
The excess power generating potential of the system is apparent in the above output from SAMS. The system meets the December load requirement, but has the potential to over produce substantially in the summer. In the case that a grid system is relatively close to the pad location and the capital is already sunk into the solar asset, selling power might be feasible to boost revenue. While this is not part of this design solution, it is an interesting approach when considering the number of wells in Alberta.
Turbine Solution
Background Information
After extensive research, the most applicable turbine on the market is a C30 microturbine, developed by Capstone Turbine Corporation. This microturbine replicates an open Brayton Cycle, which can be modelled as a closed cycle. To determine cycle efficiencies, we will be assuming the case of an ideal Brayton Cycle.
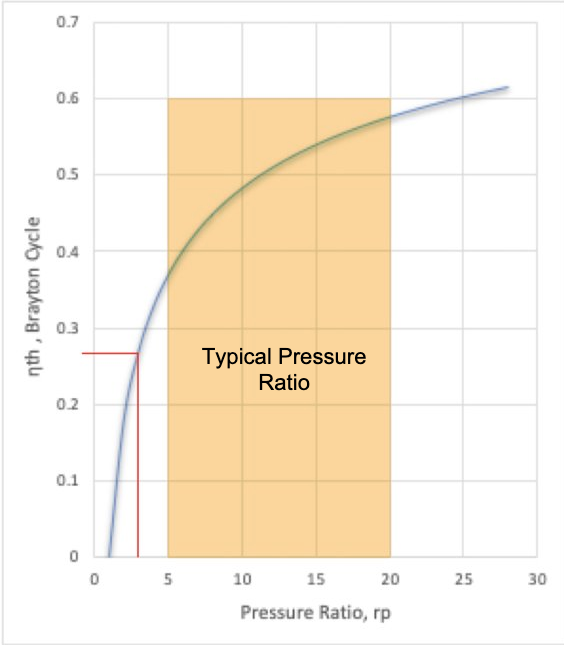
Using the standard cold-air assumption, i.e. constant specific heats of air (k=1.40), the ideal efficiency can be modeled vs. the pressure ratio with the following equation:
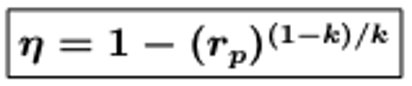
Using a design pressure ratio, of 3.39, from a given research paper the ideal efficiency is ~27%.
This efficiency value corresponds with corresponds with the manufacturer’s specifications.
As turbines operate most efficiently at their rated power at steady state, we will require a buffer system to store energy to power the pad while the turbine is off.
Turbine Selection
Due to the impracticality of turbines available on the market, we are forced to source a microturbine that is well oversized for our pad design.
The power requirement for a four-well pad is ~24.5 kWh per day. At the optimal running conditions, the C30 is rated for 30 kW and capable of producing 720 kWh per day. This is oversized for our application.
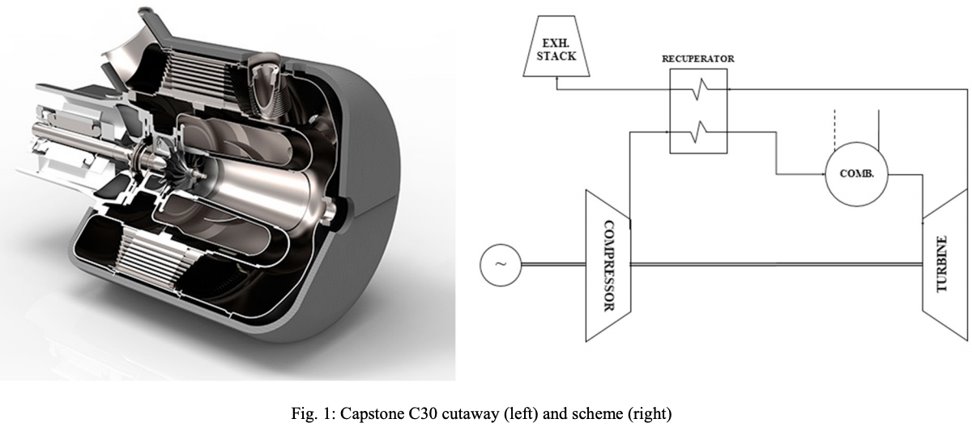
Looking for a real-world solution, we opted for the C30 30kW microturbine produced by Capstone Turbine Corporation. This microturbine features air bearings and operates on an open Brayton cycle.
This solution also has a small physical footprint on site, as the turbine unit occupies an area of 2.56m2 and comes as standalone unit that can have programmed or remote-controlled operation. This technology is well utilized in industries such as telecom and petroleum, and so has the benefit of precedence in industry.
Some comparisons to the pressure ratios found in conventional turbines reveal that these turbines are designed with a lower pressure ratio, 3.39, vs 5-20 for conventional turbo machinery. Due to this, the efficiency is 27%, which is fairly close to the listed efficiency at rated power.
The major issue in the implementation of this design is the disparity between the turbine generation capacity and the pad power consumption. Turbines must be sized closely to their application as they operate best at steady state, near the rated power, for optimal efficiency and longevity. In the case of a C30, the turbine cannot be throttled without being penalized with low overall efficiencies (BELOW 20%) and shorter operational lifespan.
To take full advantage of this technology, would be to utilize it to power a web of 4-well pads. This would allow this system to utilize its high efficiency and low emissions potential, however, to scale it to our application, we will need a battery bank to act as a buffer to store energy.
Battery Selection
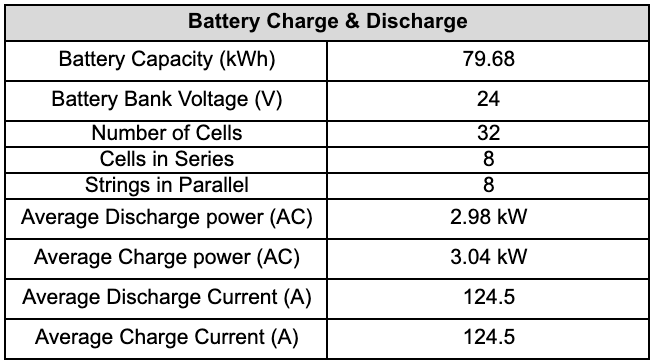
Using the same battery system as the solar system, the turbine would require 32 batteries to power the pad for ~3 days. Based on an average battery system charging rate of ~125 A, we calculated that the batteries would require 27 hours to charge, utilizing ~3.04 kWh of the turbine output per hour. Conversely, the pad would utilize ~1.02 kWh of the turbine output per hour. Based on the load demands, the system would utilize 4.06 kWh of the turbine output per hour, only 13.5% of the turbine’s rating.
Stirling Engine Solution
Background Information
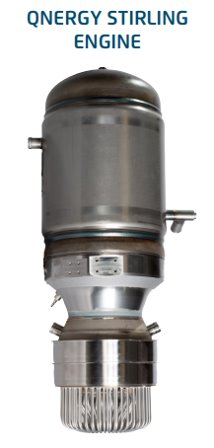
Stirling engine technology was invented in the 1800s and was used to pump water and generate electricity on a small scale. The engine uses a working fluid to move a piston assembly up and down as the working fluid is heated and cooled. The Stirling engine is fuel agnostic, meaning the working fluid can be heated using any source for operation. With the low number of moving parts and the working fluid sealed, Stirling engines are known to be reliable. NASA currently has a test Stirling engine that has been running continuously for 14 years without maintenance and is planned to be used in future Mars missions.
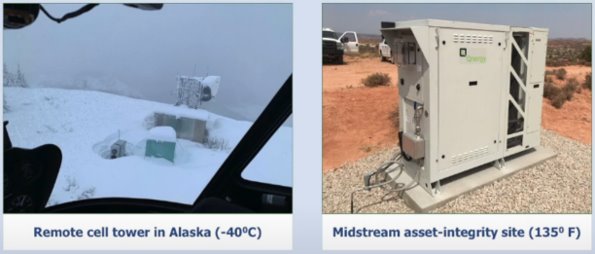
Since then, many have tried to adapt this technology into a modern electricity generator with little success. This limited success is mostly attributed to finding an appropriate working fluid and limitations in power electronics technology. With recent advancements in power electronics, coupled with using inert helium gas as the working fluid, a company called Qnergy was able to achieve a commercially successful sterling engine power generator, known as PowerGen units. These PowerGen units can run practically maintenance free (1-2 hours of scheduled maintenance per year) and can be used in a wide range of ambient temperatures (working examples at -40°C to 57°C). For these reasons, these PowerGen units are very well suited for our application.
Stirling Engine Selection
Qnergy offers three commercial models of its Stirling engine, the PowerGen 600, 1200 and 5650. Each unit has its advantages and applications in relation to the power supply for gas production. Below is a table that shows the different applications based on the size of the generator.
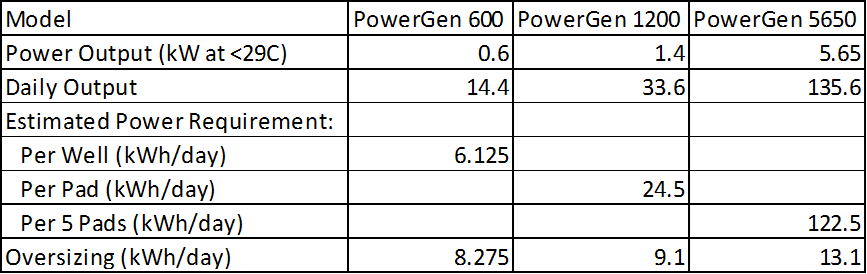
The graph below shows CO2 emissions from the engine as it relates to changes in ambient temperature. Built from correlations based on information from the Qnergy website, it can be concluded that the PowerGen 600 and 1200 have small variation in their emissions. However, the PowerGen 5650 is much more sensitive.
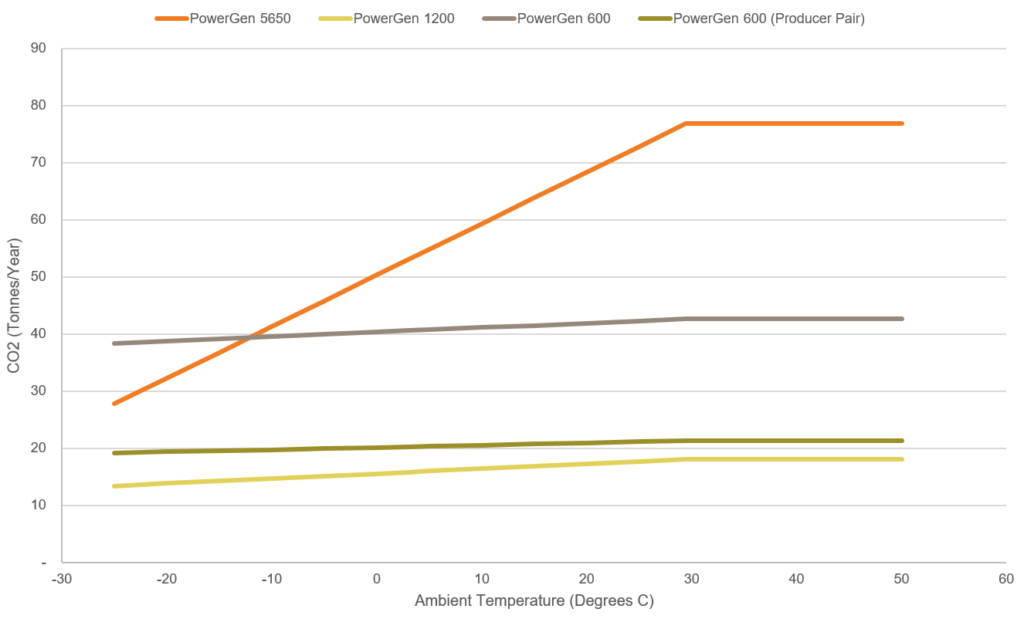
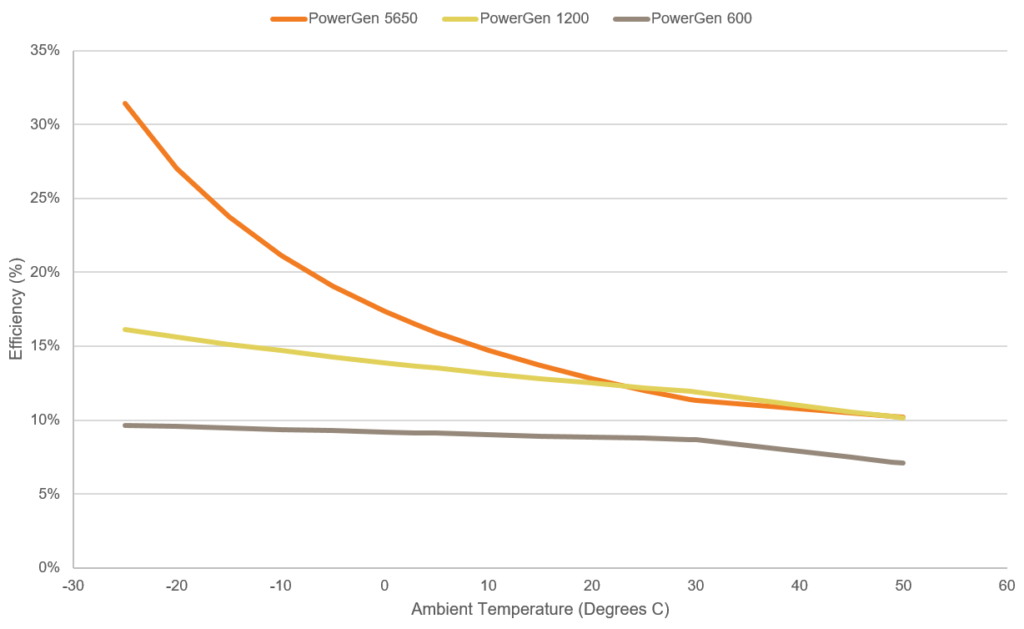
The aggressive fuel efficiency curve for the 5650 shows why the engine is sensitive in terms of ambient temperature. The temperature differential which operates the engine is easier to achieve at lower temperatures (requires less fuel to produce the same energy) and all the efficiency curves will display the exponential characteristic. The 5650 is engineered in such a way that the profile is displayed at realistic temperatures.
Even with the higher efficiency, two PowerGen 600 units to power the four well pad would be the optimal choice. The 5650 is an oversized unit for the application and thus is not selected. Using the 600 units provides the least wasted work while meeting the power requirement of the wells.
Additional Considerations
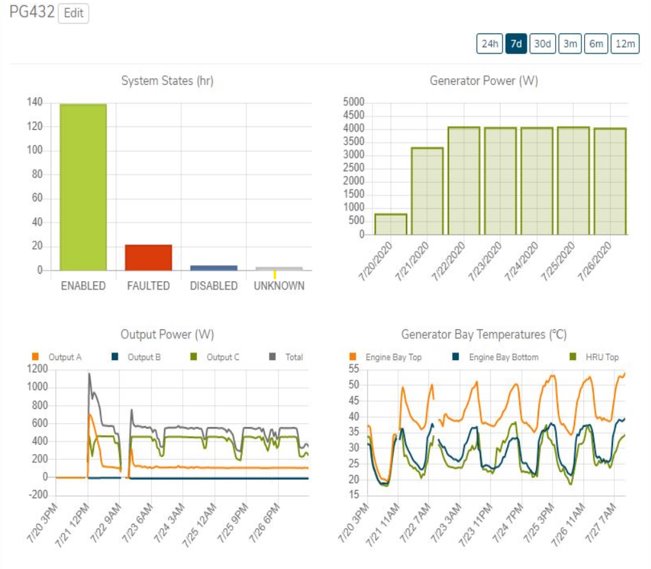
Qnergy also offers a remote monitoring service that comes standard with the PowerGen units. This monitoring service provides real-time status updates of the units and can alert operators when faults occur. The picture below is an example of the remote monitoring data available.
Another advantage of the PowerGen unit is that they are reliable enough to not require a battery intermediary system to support the well, something that both the PV solar units and turbine units will require. The team sized a battery pack capable of supporting well operations for 8.5 hours for maintenance and emergencies associated with the Stirling engine.
Economics
Economics
An economic analysis was performed on each solution and then compared to each other to find the economically optimal solution.
An important aspect of solar power that should be considered is downtime due reliability issues. With some assumptions, this issue was quantified in our economic analysis. The assumptions made are listed below:
- Each year, the system will be down for 4 days in winter (storms) and 4 days in summer (forest fires)
- Average gas production per well is 80 e3m3/day
- Average gas price is ~0.08 $/m3
The results estimate an average loss in revenue of ~$50,000/year per well.
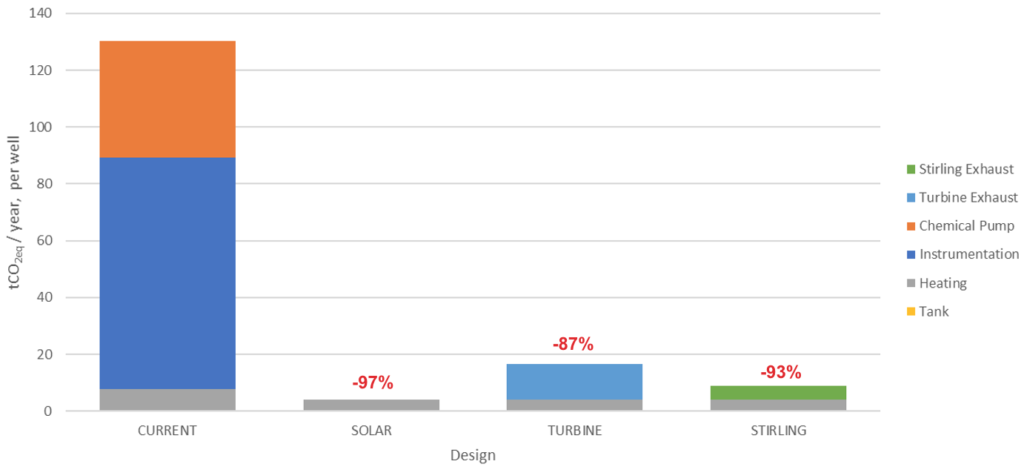
The graph below represents the total reduction of CO2e per year, per well in tonnes of CO2e compared to the existing solution, currently in use. The PV solar solution shows the highest reduction of 97%, the Sterling engine solution shows the second highest reduction of 93%, and the turbine solution shows the lowest reduction of 87%. While the total reductions between the three solutions vary, it is clear that all three represent a significant reduction in CO2e over the existing solution.
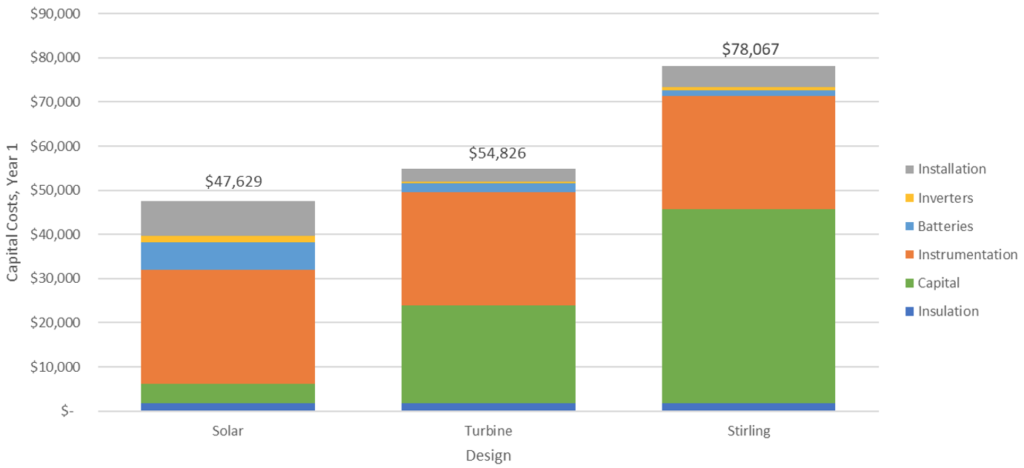
The following graph is a representation of the year 1 capital costs of the three design solutions, broken down by cost categories. It is interesting to note that while capital costs of the PV solar solution are relatively lower compared to the other two solutions, the installation and battery costs are relatively higher.
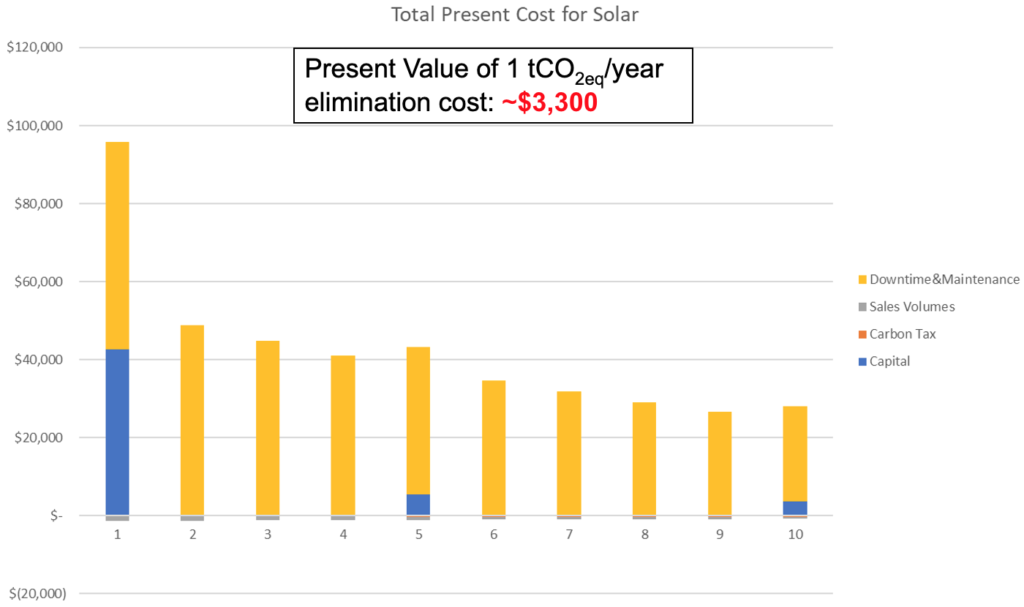
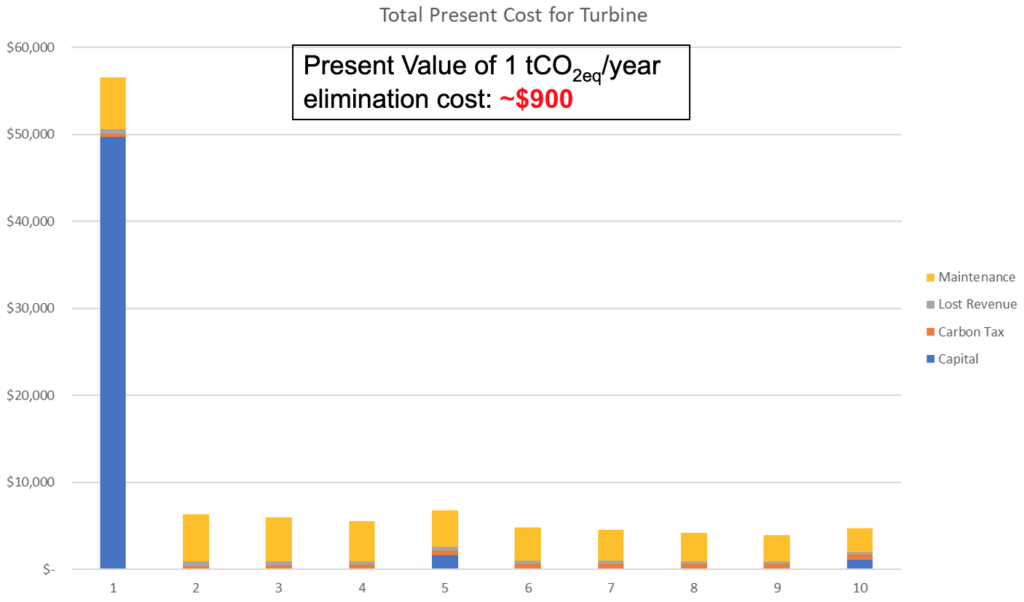
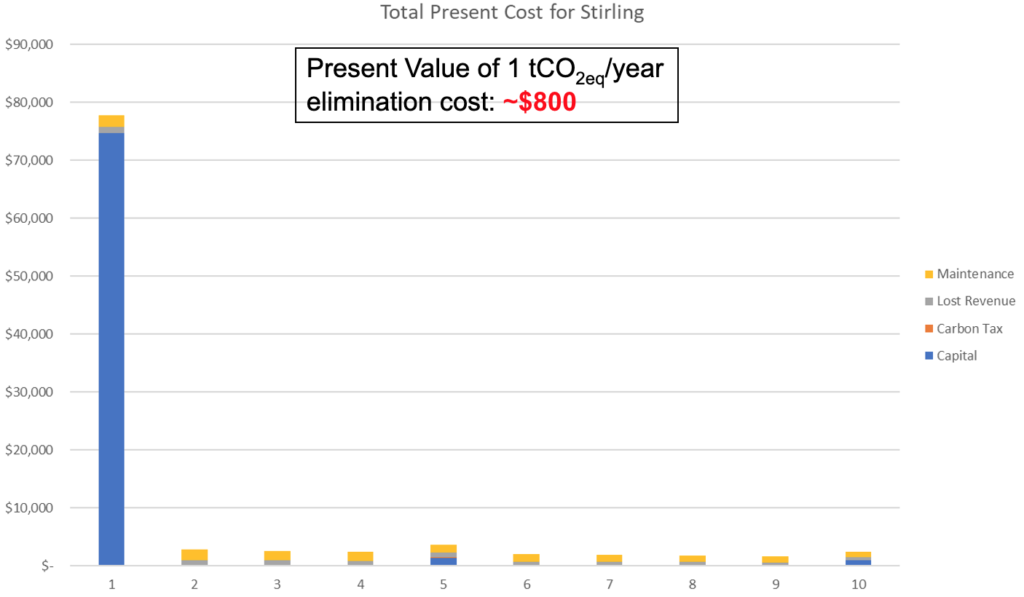
The next set of graphs represent the costs of each solution over a span of 10 years and the Present Value elimination costs of 1 tonne of CO2e per year for each solution. The capital costs in year 5 and year 10 represent the purchase of new batteries for replacement. The PV solar system has the lowest initial capital cost, however, factoring in the expected lost revenue due to system downtime, the option bares the highest cost of ownership at ~$3,300/CO2e. The reliability of the Stirling engine option reduces the amount of revenue loss due to downtime. Over the 10 year forecast, this alternative has the lowest cost of ownership resulting in ~$800/CO2e.
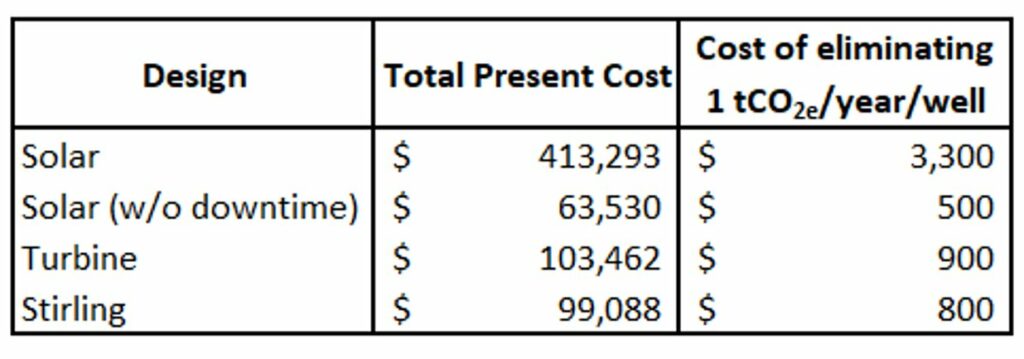
The table below summarizes the total present costs and elimination costs for each design. For comparison’s sake, the PV solar solution without downtime was added. We can see that without the losses from the downtime, the elimination costs become the lowest of the three solutions. However, this scenario with no downtime is unrealistic and is only used for a theoretical comparison.
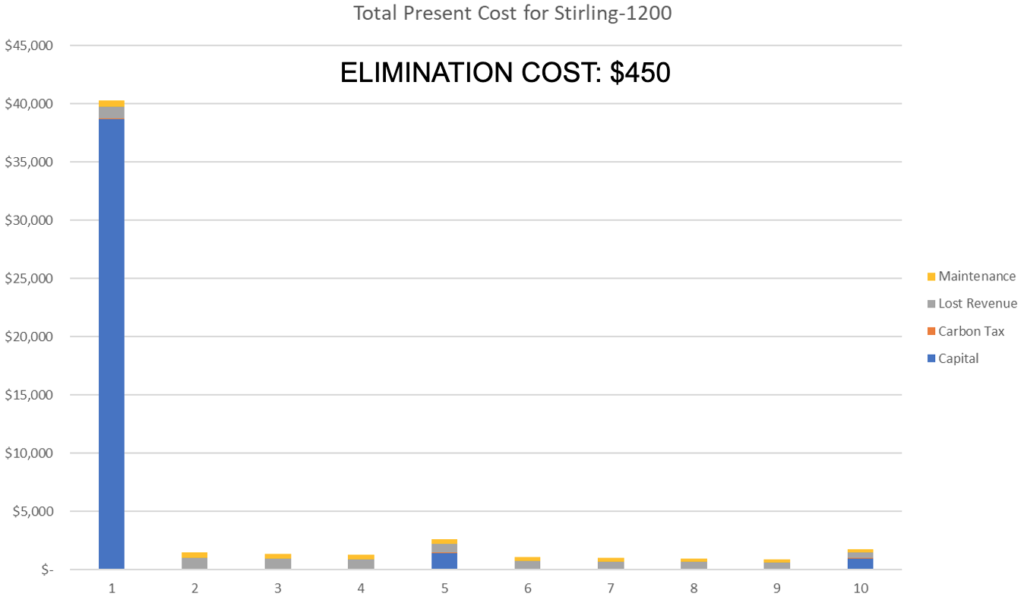
PowerGen 1200 Case
The PowerGen series is not included in the above comparison but has favorable costs. It could be used in certain applications, however, in the oil and gas industry modularity is prized. The single power supply for a pad is not as appealing as a per well power solution. The 600 is in between and offers the best utilization of power generated and modest modularity. The lower capital cost makes the 1200 appealing in specific cases and is why it is included here.
CCA Rule Change
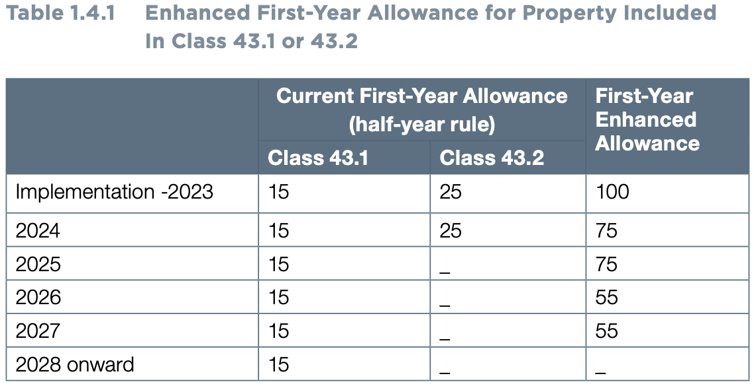
Eligible energy systems and equipment as defined by the requirements of Classes 43.1 and 43.2 of Schedule II of the Income Tax Regulations Act can apply an accelerated Capital Cost Allowance (CCA) rule [11]. Currently any eligible systems and equipment purchased after November 20th, 2018 and implemented before 2023 can apply the ”First-Year Enhanced Allowance” rule that allows 100% of the CCA to be deducted in year 1. Each year after the allowable rate declines until 2028 [11].
Example
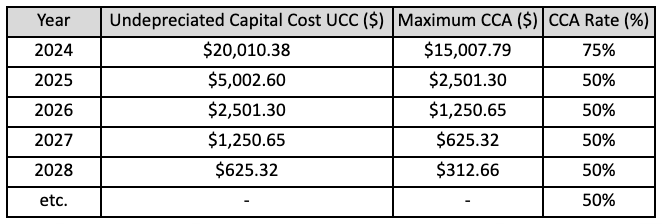
Below is an example of the half year rule being omitted and the First-Year Enhanced Allowance being applied in full. The CCA is fully realized in fiscal 2023 with no undepreciated capital cost (UCC) remainder for subsequent years.

Below is an example of the half year rule being omitted and the First-Year Enhanced Allowance being applied in the 2024. This results in the full amount of capital cost being available for CCA purposes and an accelerated CCA rate of 75% in the first year. In this case there is a remainder of UCC and it is depreciated at year over year enhanced allowance rate of 50% for the remainder of the UCC balance.
Carbon Credit Rule Change
On March 25, 2021, the supreme court of Canada ruled that federal Liberal plan to increase the cost of carbon credits was constitutional. This ruling is timely with respect to the new federal budget to be released April 19, 2021. The details have not been stated in terms of the increments that will lead to the final price of ~$170/tonne by 2030 and may come out with the new budget.
Recommended Design
Recommended Design
The final design recommendation is to change the chemical pump and instrumentation to electronic equivalents. The new system design will be energized by two Qnergy PowerGen 600 engines. This recommendation does not achieve the initial target of a net zero pad, however, the design does reduce emissions by an estimated 92% and is projected to eliminate downtime due to power related issues. The majority of real-world problems with power at these remote sites are related to batteries. By eliminating the large reliance on battery banks, production will experience less interruptions thus maximizing revenue. It takes a very small amount of downtime to make up for the larger capital cost of the PowerGen 600 units. The re-usability of the units and their prolonged length of the life expectancy provides assurance that surplus revenues will be achieved when compared to other alternatives.
Alternative Technologies
VRU System
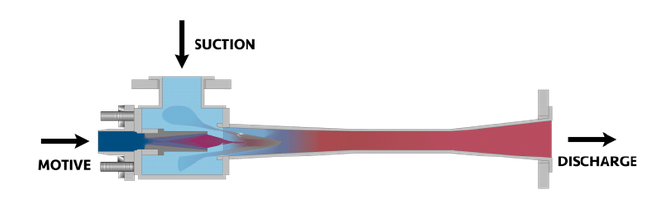
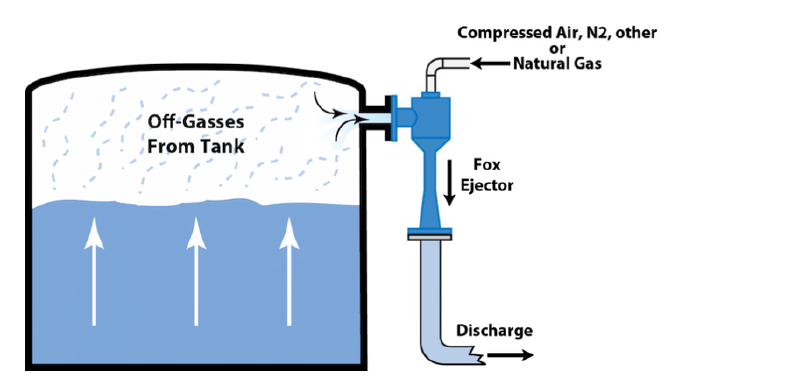
A Venturi Jet Ejector (VJE) based VRU is a potential avenue for capturing the relatively small amounts of emissions given off by the produced water tank and catalytic heaters. As the produced gas moves through the unit, a suction force is created due to a negative pressure phonon around the diffuser. This allows the emissions captured in the produced water tank to be sucked into the produced gas line for processing further down the line. The picture below illustrates the operation of a VJE.
The major disadvantage with these systems is the large drop in pressure across the device. To counteract this drop in pressure, a compressor must be added to the line after the VRU.
An inline booster compressor would be appropriate for this application, however after sizing a unit, the motor required ~410 kW of power. Given the remoteness of the gas wells, the additional capital costs, and the high amount of power input required this VJE based VRU system is rendered unfeasible.
CO2 – Theoretical Solution
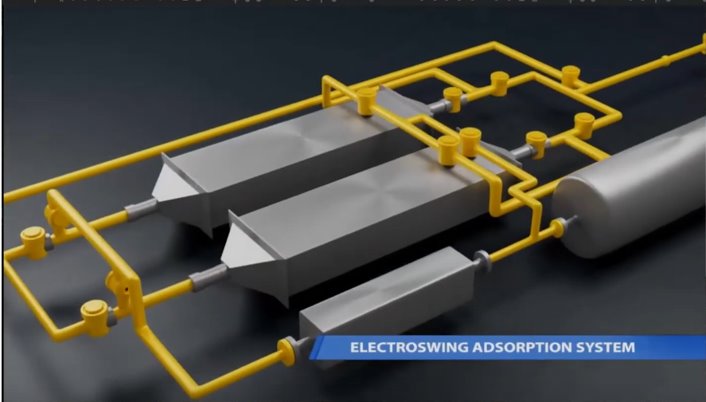
The Electroswing Adsorption System is a developing technology that uses electrochemical cells to capture carbon dioxide as it passes through the system. The exhaust from the catalytic heaters and power generator will be passed through the Electroswing Adsorption System. As the exhaust passes through the system, an electrical current will be induced. This electrical current allows the electrochemical cells to capture and hold onto the carbon dioxide within the exhaust fluid while allowing the remainder of the fluid to pass through. The electrical current can then be reversed, and the carbon dioxide is released and stored in a vessel on-site. With current testing showing ~70% effectiveness in capturing carbon dioxide, this technology could become a large contributor in the global reduction of carbon dioxide.
Partners and Mentors
We thank our industry sponsor for supporting us throughout the project selection and design. We thank our academic advisor, Dr. Gordon Moore, for sharing his wisdom, expertise and industry contacts. A special thank you to the industry contact, Bruce Peachy, for his insightful discussions on Stirling engines amongst an array of other topics. We thank our TA, Saeedeh Saghlatoun, for her inquisitive and thoughtful questions throughout the life of the project. Thank you Dr. Roes Budiman for your academic rigor.
