Project Category: Multidisciplinary
Join our Zoom Q&A (10:00 AM – 12:30 PM)
About our project
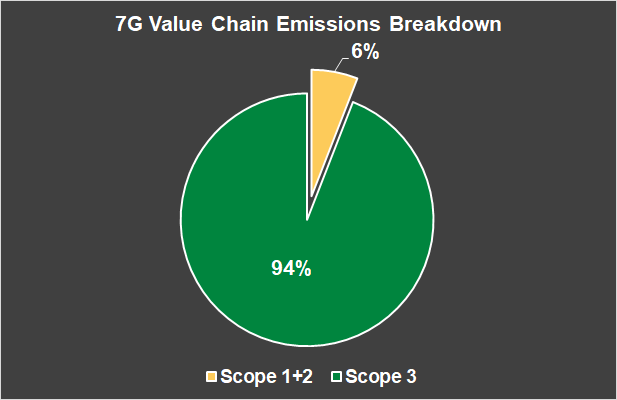
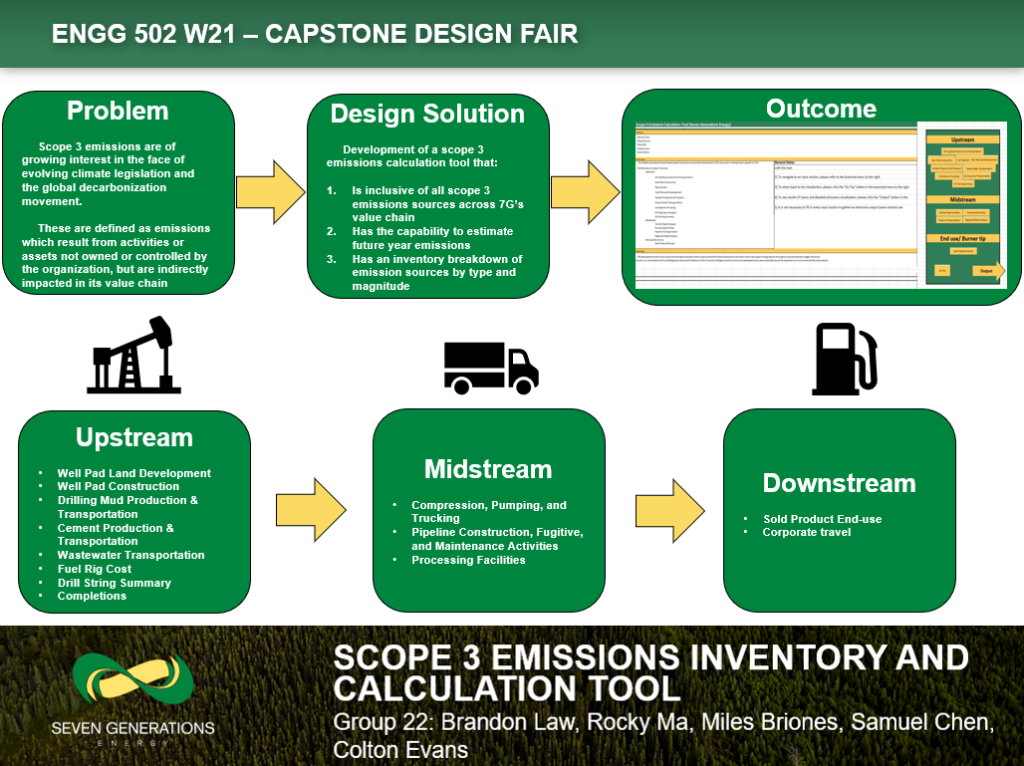
Scope 3 emissions have become a topic of importance in recent years as corporations look to quantify the GHG impact of their corporate value chain in the face of emerging climate legislation and the global decarbonization movement. In general, scope 3 emissions are defined as emissions which result from activities or assets not owned or controlled by the reporting organization, but that the organization indirectly impacts in its value chain. Scope 3 emissions can represent the largest source of emissions for companies and present the most significant opportunities to influence GHG reductions and achieve a variety of GHG-related business objectives.
This project entailed two key objectives that were worked on in the entirety of the capstone course:
- Development of a scope 3 emissions calculation tool including all scope 3 emissions sources inclusive to Seven Generations Energy Ltd (7G)’s value chain and with the capability to estimate future year emissions
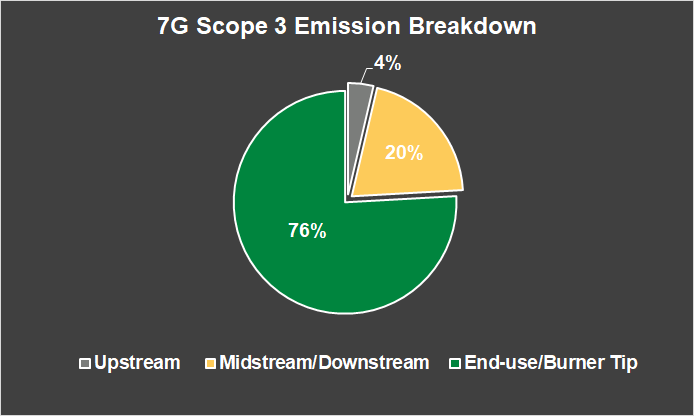
2. Develop a detailed inventory of scope 3 emissions sources with capability of breakdown emission sources by type and magnitude to allow identification of potential reduction areas

Meet our team members

Energy Engineering

Mechanical Engineering

Chemical Engineering

Energy Engineering

Energy Engineering
Details about our design
HOW OUR DESIGN ADDRESSES PRACTICAL ISSUES
Our project addresses the growing demand for corporations to better understand and report on the lifecycle greenhouse gas impacts of their corporate value chain. This expectation continually becomes ever prevalent in the face of evolving climate legislation and the global movement towards a transition to a low-carbon economy. Scope 3 (or indirect) emissions quantification across a corporation’s value chain allows a given company to understand and analyze the emissions intensity of products they produce. The benefits of quantifying corporate scope 3 emissions are far reaching and have the potential to generate meaningful sustainability linked business opportunities. Therefore, enhancing a company’s environment, social, and governance (ESG) reputation to stakeholders, individual consumers and the broader capital markets.
WHAT MAKES OUR DESIGN INNOVATIVE
Our design offers an innovative corporate GHG impact evaluation tool with the capability of quantifying scope 3 emissions utilizing inputs specific to 7G’s value chain. Existing scope 3 emissions evaluation tools do not provide the input capability required to tailor specific processes and outputs to the operations of a Canadian exploration and production company. The tool also provides the capability to estimate future year scope 3 emissions with much higher certainty than other tools available through the utilization of easily forecastable input data specific to 7G.
WHAT MAKES OUR DESIGN SOLUTION EFFECTIVE
Our tool is simplified for the typical user as the input sheets are compiled into one unified location which is navigable via the branched menu. Our competitors typically have many worksheets to compensate for the numerous amounts of input data required. Our tool’s navigation and layout is easy to follow and utilize. As well, the tool is capable of taking rich data for accurate calculations and poor data for scale of magnitude calculations. Our tool provides in-depth analysis on a modular basis (for emissions) which can be compared to 7G’s total scope 3 emissions to see where large amounts of emissions are being produced in the value chain.
HOW WE VALIDATED OUR DESIGN SOLUTION
Our tool’s results were compared to other existing tools and literature values to ensure the reliability of our calculation methodologies utilized. As well, we did external research to acquire emission factors that better reflected 7G’s scope 3 assets. The models that we chose to utilize or develop for our calculation tool were justified with sources prior to implementation to ensure that we are not providing an incorrect model for our client.
FEASIBILITY OF OUR DESIGN SOLUTION
The product is designed on excel (supported by VBA) and is accessible by most employees that would like to utilize the tool. Therefore, the software implementation of this tool is very feasible and cost effective for 7G. It is also convenient to obtain or estimate the required data for inputs which makes the implementation of the software feasible for 7G.
Partners and mentors
We would like to thank the individuals who have helped us with the development of this project. Our main advisors at 7G guided us through the process through meetings and learning sessions. As well, our consultation with Joule Bergerson (Associate Professor at the University of Calgary), and her previously developed tools, were invaluable due to her experience in environmental life cycle analysis. Lastly, we would like to thank Dr. Budiman (Capstone Professor) and Saeedeh (TA) for their guidance and feedback throughout our project’s life cycle.

Seven Generations Energy Ltd.

Seven Generations Energy Ltd.

University of Calgary

University of Calgary

University of Calgary
Our photo gallery
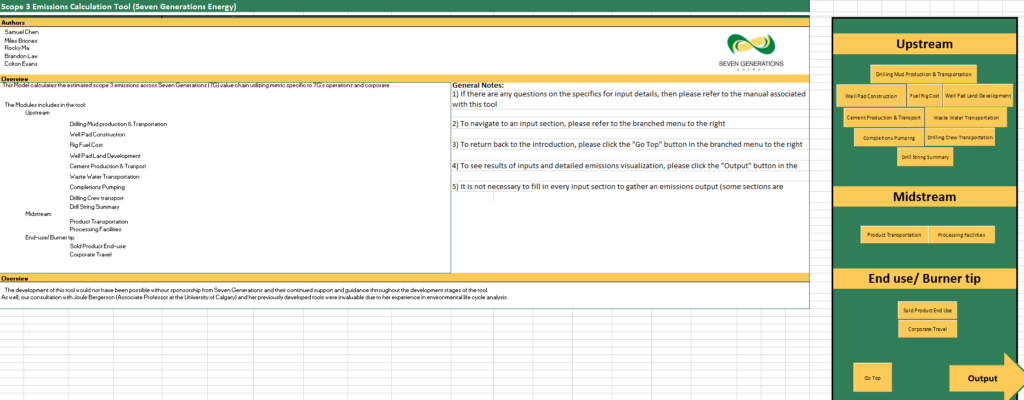
Welcome Menu
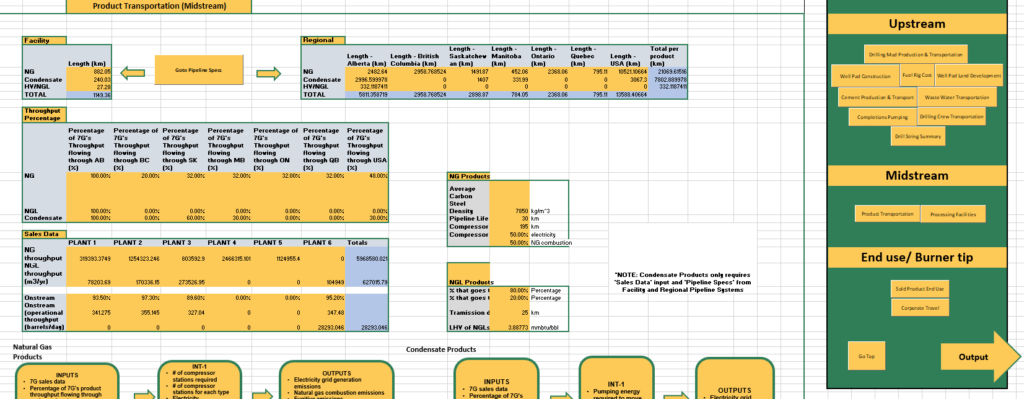
Product Transportation Input Screen – 1 of 13 Modules (Example)
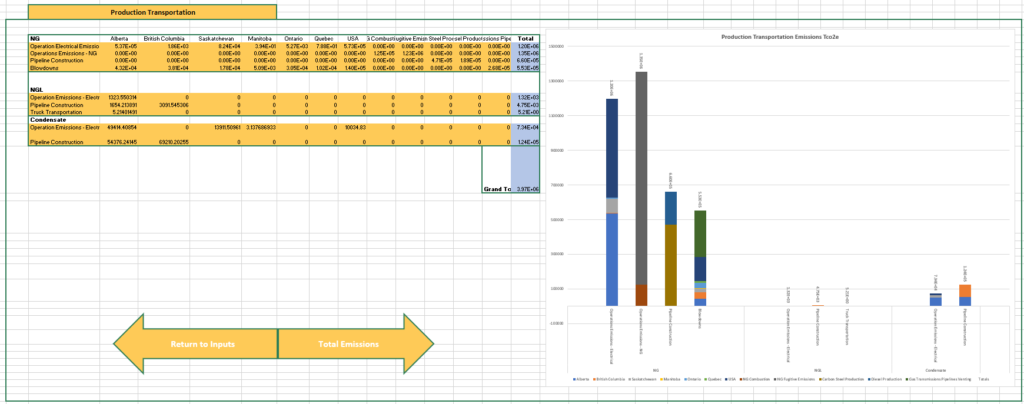
Product Transportation Output Screen (Example)
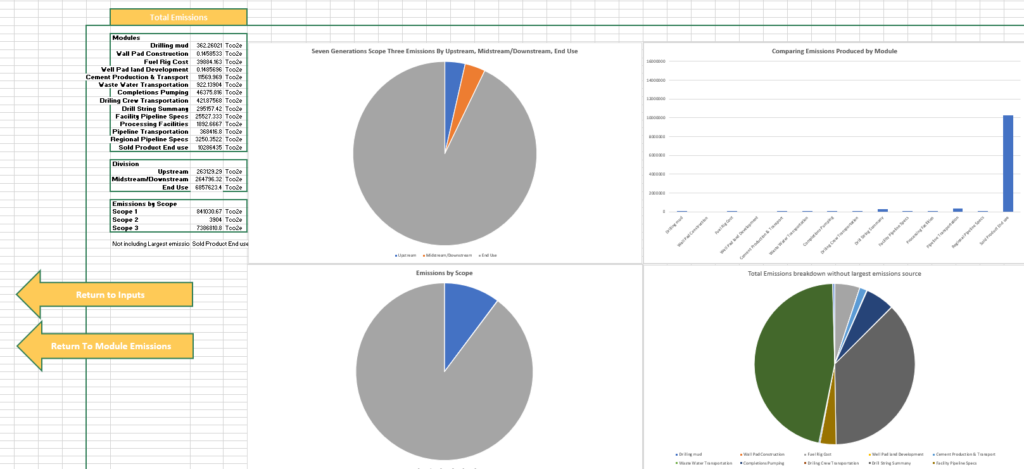
Total Emissions Output (Example)
