Project Category: Petroleum
Join our presentation
About our project
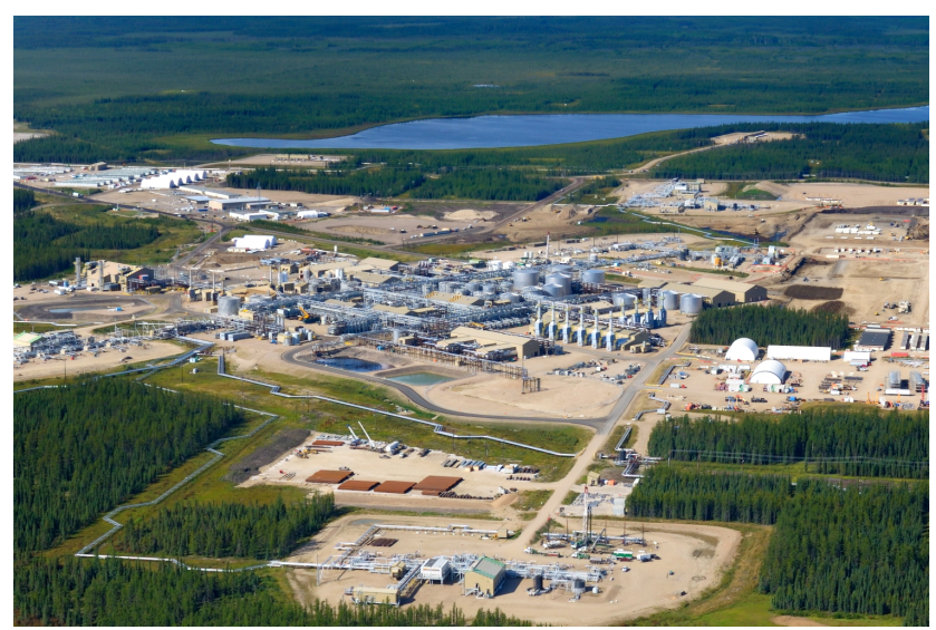
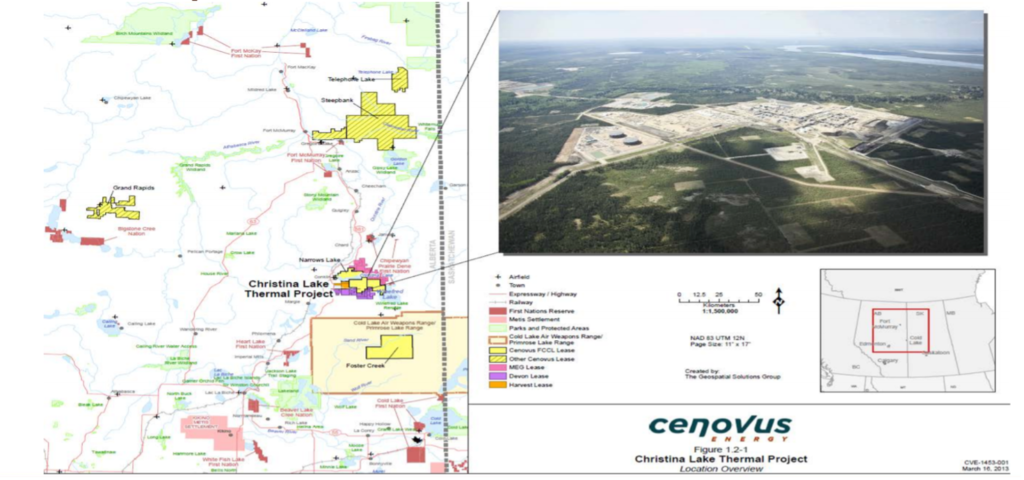
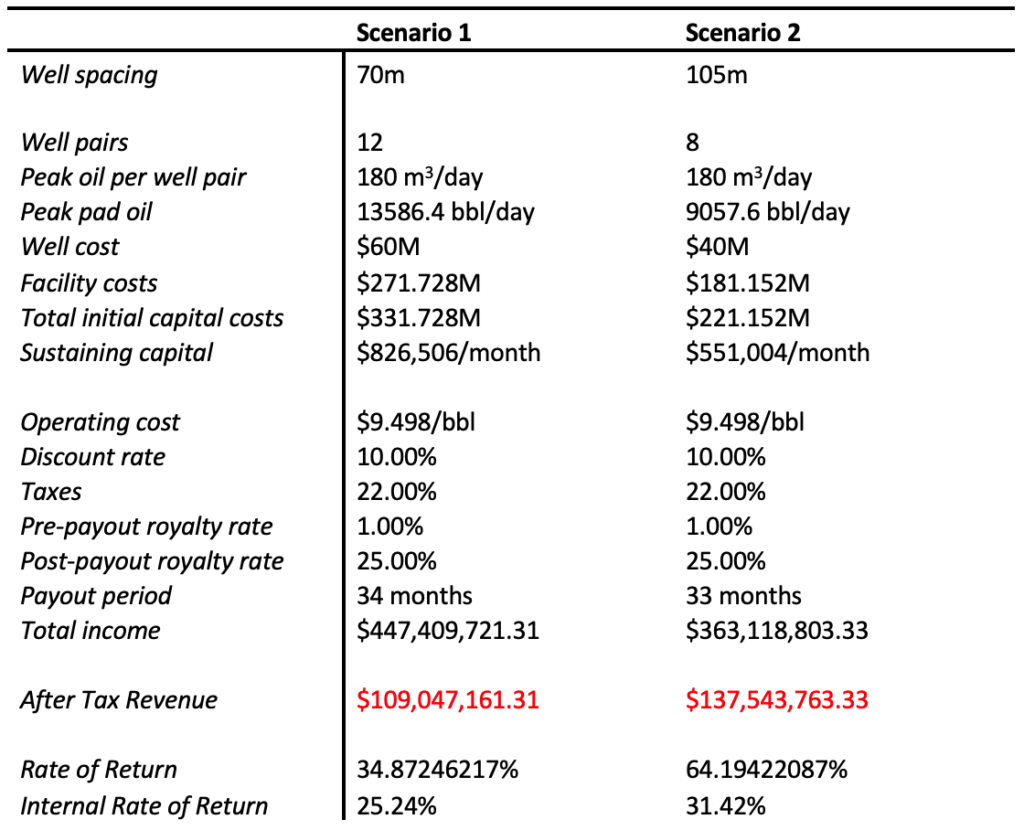
The project intends to use historical field data, analytical model and simulation model to assess the H03 Pad performance of Cenovus Energy’s Christina Lake Thermal project located in Township 076-06W4. This assessment compares the project in its current state of 12 well pairs at 70m well spacing, against alternative scenarios for 8 well pairs at 105m well spacing. Triple well-pair reservoir simulation models were built using CMG STARS for both the current scenario (70m) and the alternative scenario (105m). Production data for both scenarios were analyzed from August 2016 to the date where 69.4% of oil is recovered. Based on economic analysis, it was found that the alternative scenario (105m) is able to generate an additional $28M than the current scenario (70m) running at an additional 9 years.
Meet our team members

Sihan Ye
Chemical and Petroleum Engineering

Munashe Chipuka
Chemical and Petroleum Engineering

Natan Sibnatu
Chemical and Petroleum Engineering

Jiajie Liang
Oil and Gas Engineering
Details about our design
HOW DOES OUR DESIGN ADDRESS THE CHALLENGES IN THE OIL RECOVERY PROCESS
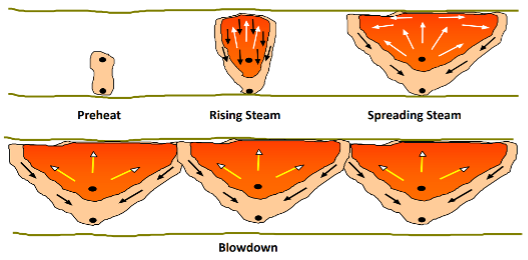
The project focuses on bitumen recovery using the process of dual-horizontal well steam-assisted gravity drainage (SAGD). The two horizontal wells are approximately 5 meters apart vertically. Steam is injected and released from the upper well to heat the surrounding bitumen, decreasing the bitumen viscosity and allowing the bitumen to flow to the production well below through gravity drainage. The oil and water emulsion are then pumped to the surface for further treatment. The whole process consists of 4 steps: start-up, steam rise, chamber spread, and blowdown.
WHAT MAKES OUR DESIGN INNOVATIVE
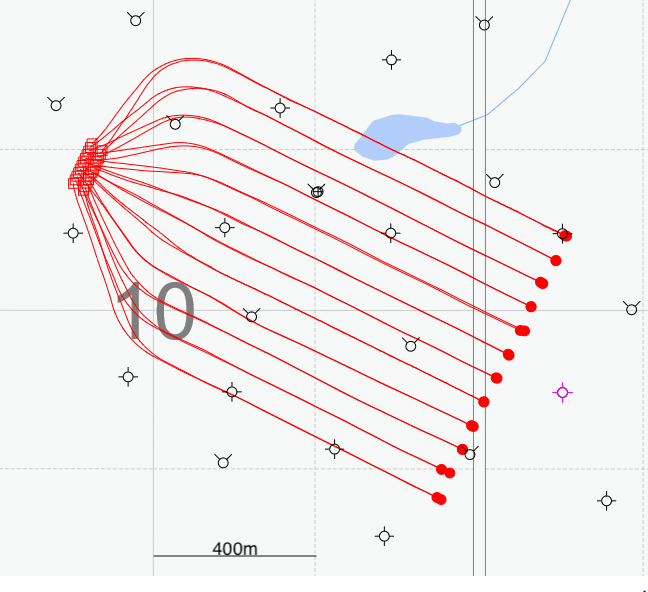
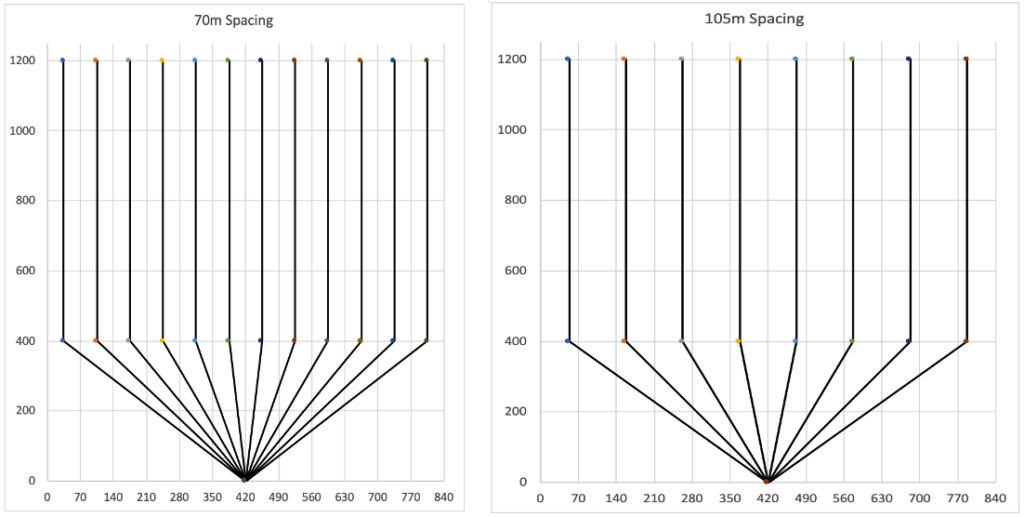
We investigated increasing the inter-well spacing from 70m to 105m while keeping the pad drainage area fixed at 840m wide by 800m long. The two figures below show the schematics for the well pairs for 70m and 105m spacing, respectively. We can see that in the 840m width, in changing the inter-well spacing, the number of the well-pairs have reduced from 12 on 70m spacing to 8 on 105m spacing, which have reduced the initial capital cost by $11M.
HOW WE VALIDATED OUR DESIGN SOLUTION
We validated the production of our processes through two methods: analytical model and simulation model; both are later compared to field data provided by Cenovus Energy. In addition, we have included a detailed analysis on the drilling and completions, and surface facilities for a SAGD project.
Analytical Model
We have used the analytical method developed and modified by Butler and Stephens in 1997 to predict our SAGD oil production rate performance.

Where g=9.81 m/s2, L=770m; K=10.6D; ∅=0.373; ∆So=0.534; h=30m; P=2500kPa. Using the SAGD pressure, saturation steam temperature was found to be at 223°C. From the Handbook of Canadian Heavy Oil and Oil Sand Properties for Reservoir Simulation, the dynamic viscosity, thermal diffusivity, and density for Athabasca Bitumen were found to be 7.0 mPa.s (7.0E-3 kg/ms), 5.38E-7 m2/s, and 0.8749g/cm3 (874.9 kg/m3).
Simulation Model
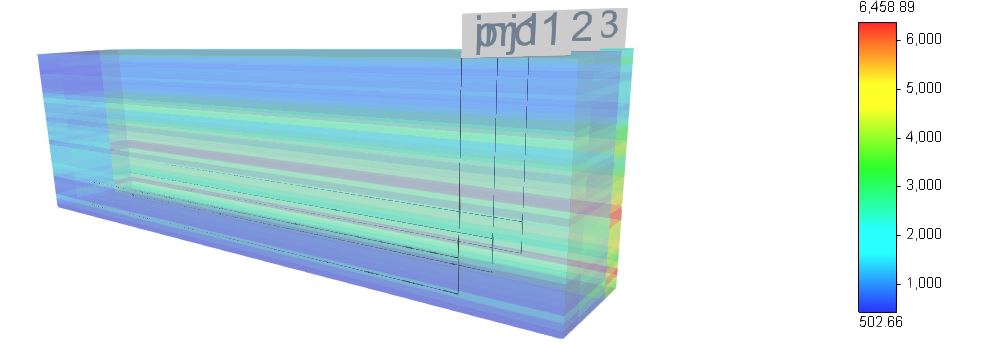
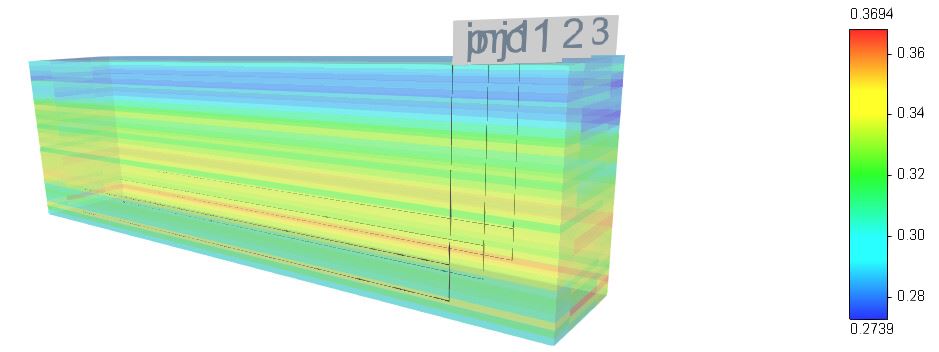
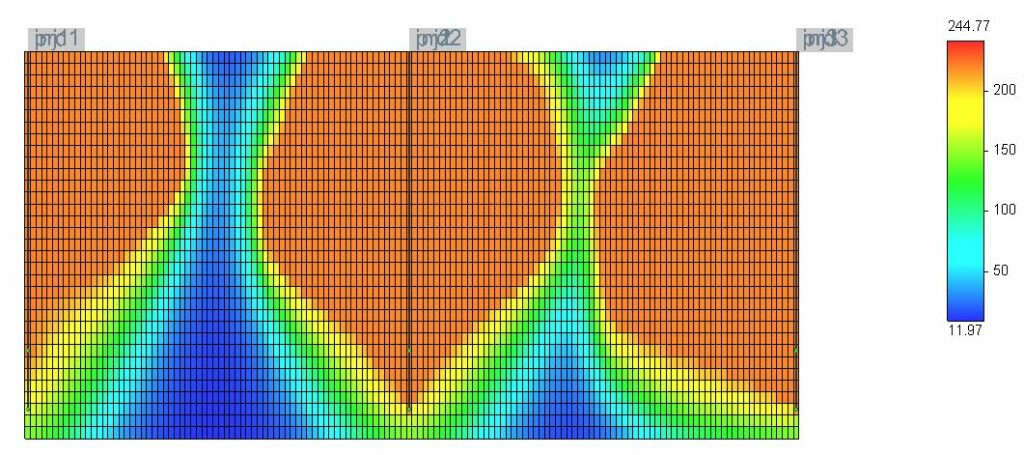
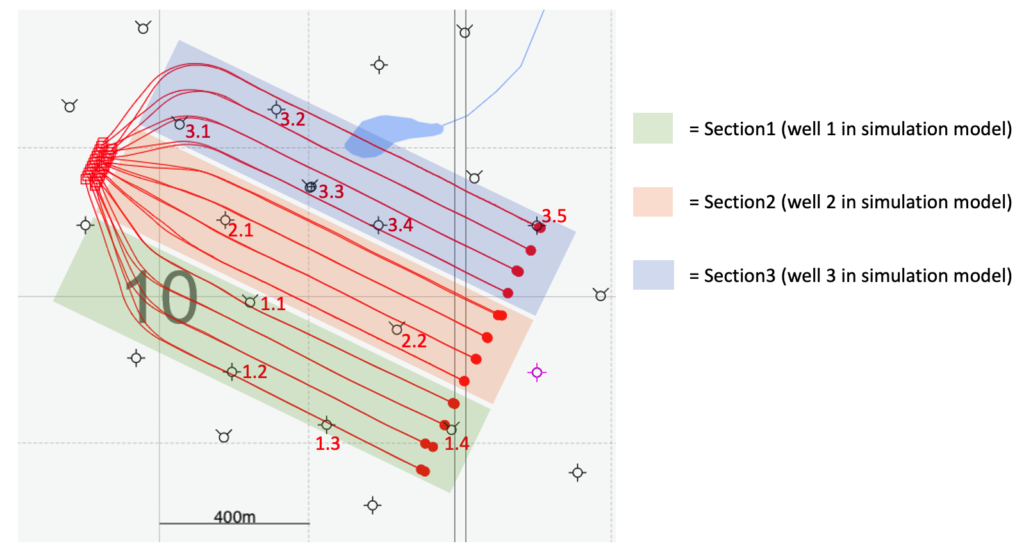
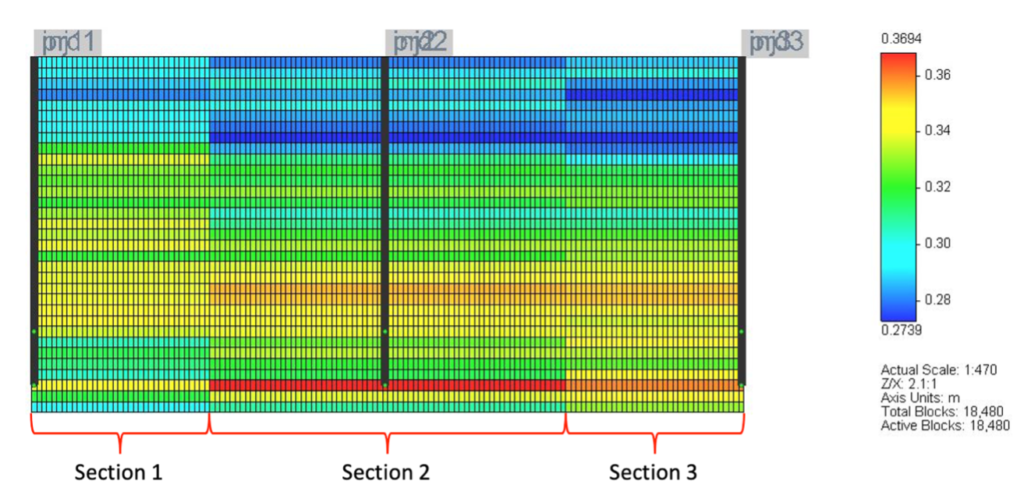
The triple well pair model consists of two half wells at both left and right edges and then a full well in the center. The dimensions of our triple well pair reservoir model for the 70m scenario is 140 m wide (i-axis) by 800 m long (j-axis) by 33 mthick (k-axis). Dimension interval for both directions i and k is 1m; and for direction j is 200m. The top 31m is the original oil in place (OOIP) available to be recovered. The bottom 2m is below the producer, so it will not be included in the recoverable oil estimate. We divided the whole reservoir into three sections along the i-direction. Each of the three well-pairs in the model represents 4 well-pairs on the H03 Pad (first figure below). Section 1 is a half well, it goes from 0-35m. Section 2 is a full well, it goes from 36-105m. Section 3 is a half well, it goes from 106-140m (second figure below). For the 105m alternative scenario, the dimension in the i-direction is increased from 140m to 210m with a dimension interval of 1.5m. Section 1 now goes from 0-52.5m, section 2 is from 53-157.5m, and section 3 from 158-210m.
Reservoir initial conditions for the simulation model are 12°C and 2500kPa. The following is a list of inputs for our simulation and main parameters we tuned to get a better history match: porosity, permeability, porosity reference pressure, formation compressibility, rock heat capacity, thermal conductivity (rock, water, oil, and methane gas), bitumen viscosity variation depending on temperature, and relative permeability curves.
Drilling and Completions
For drilling and completions, we chose casing sizes and grades using the API Casing tables and the casing and bit size selection chart. Table below is a summary of our casing design:
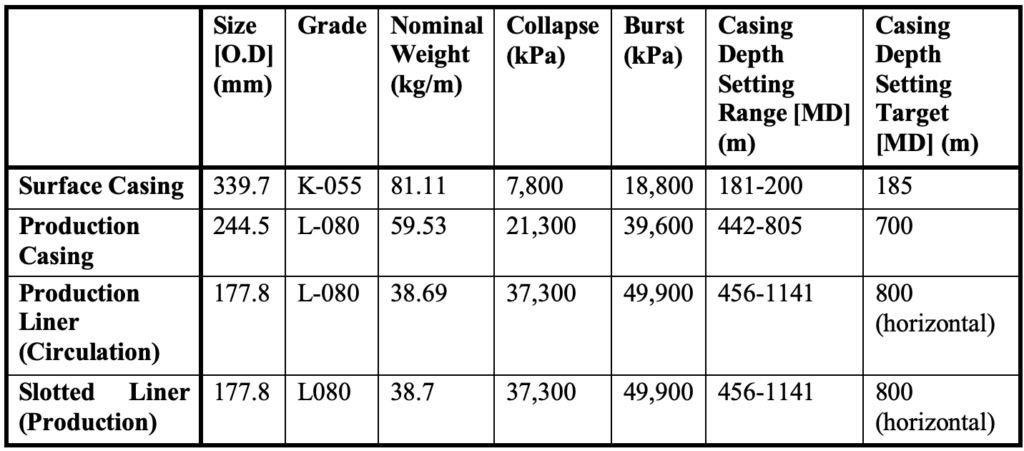
The sizes for the drill bits were chosen based on the previously mentioned casing and bit size selection charts while the types were chosen from a product catalog from Schlumberger’s Smith Bits company. The choices are summarized in the table below:

To maximize the performance of the fluid we decided to use M-I Swaco’s HydraGlyde drilling fluid system which offers excellent hole cleaning and high drilling rates, while stabilizing shale streaks in our reservoir. Schlumberger’s ThermaSTONE has been chosen as the cementing fluid primarily due to its ability to withstand high temperature and pressures associated with SAGD. The Akita’s 222,400 daN rated Triple Pad AC was chosen as the drilling rig. We went with Akita because they have multiple rigs operating around Canada in those regions close to our pad.During the production phase, we will be using the Electrical Submersible Pump as our production completion.
The three injector completion strategies we have proposed are:
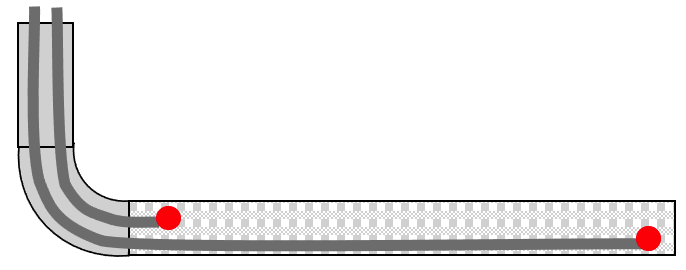
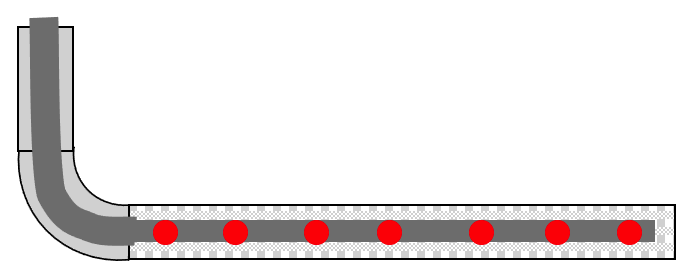
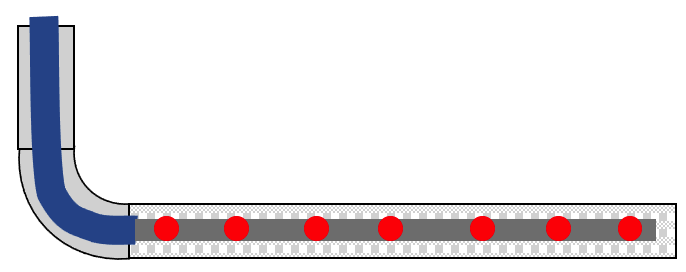
Surface Facilities
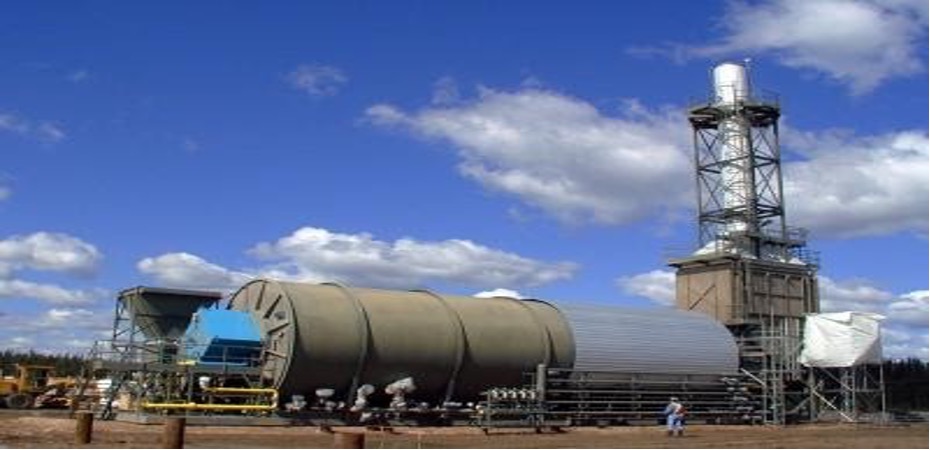
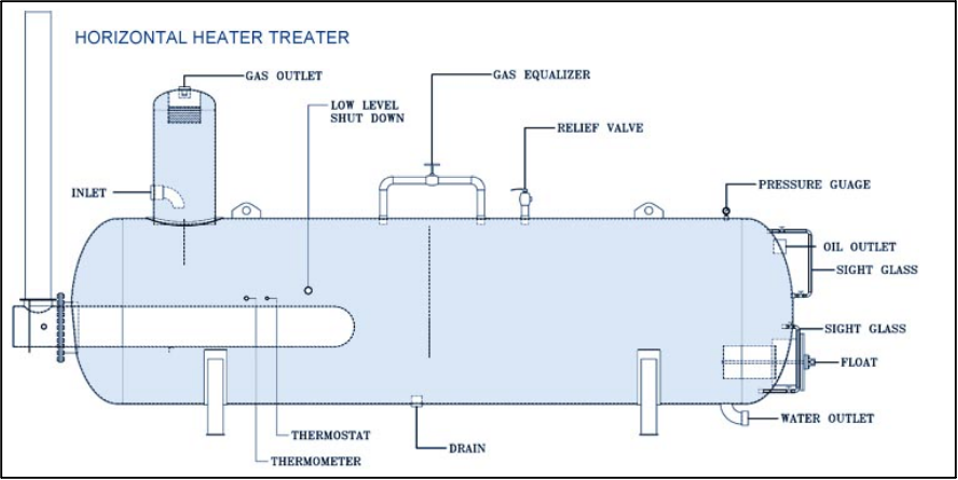
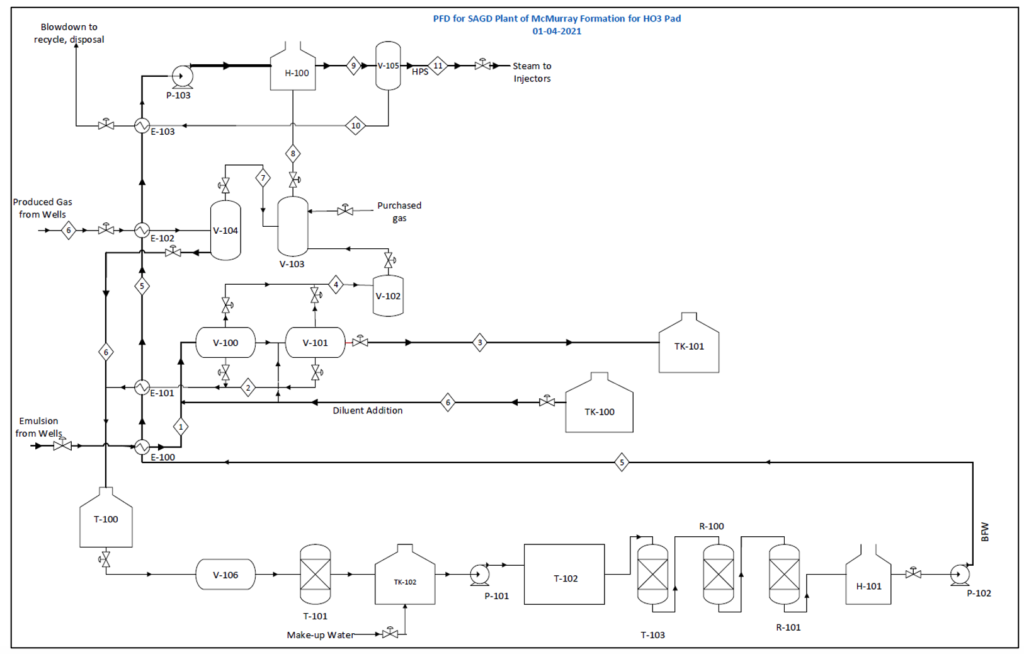
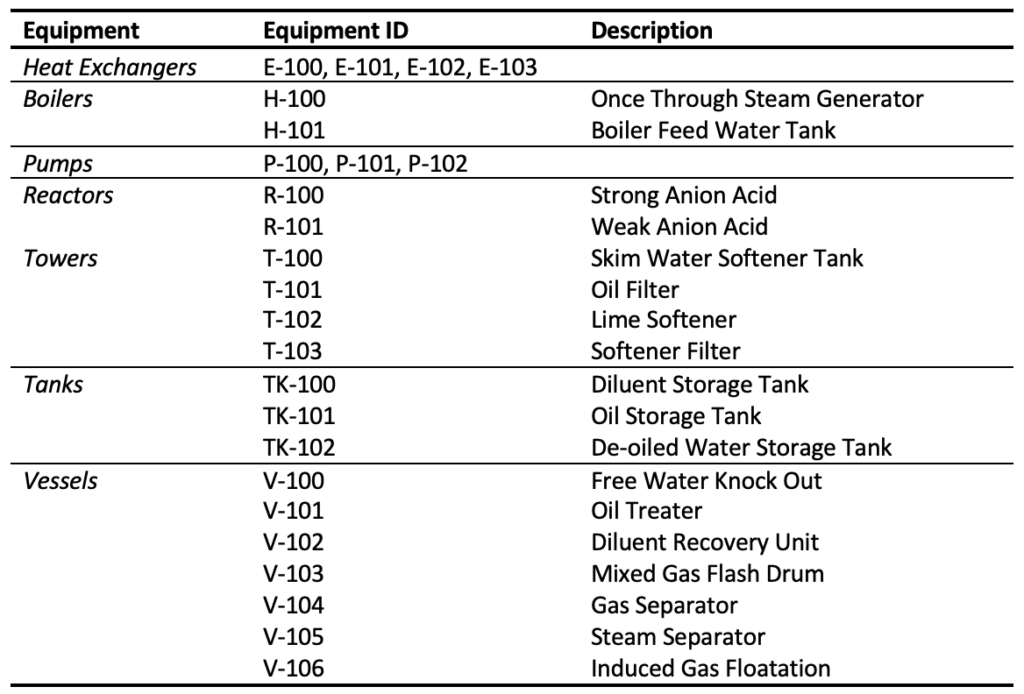
The SAGD facility is made up of five main sections: Inlet separation, oil treating, water treating, steam generation and heat integration. The process flow diagram is shown below in figure below. The corresponding equipment list is presented in table.
WHAT MAKES OUR PROCESS SOLUTION EFFECTIVE
Analytical Model
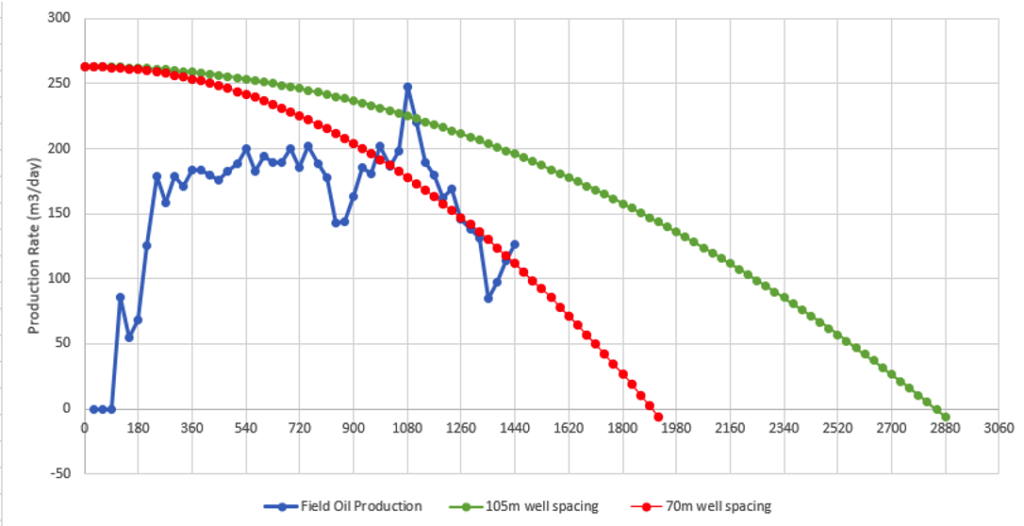
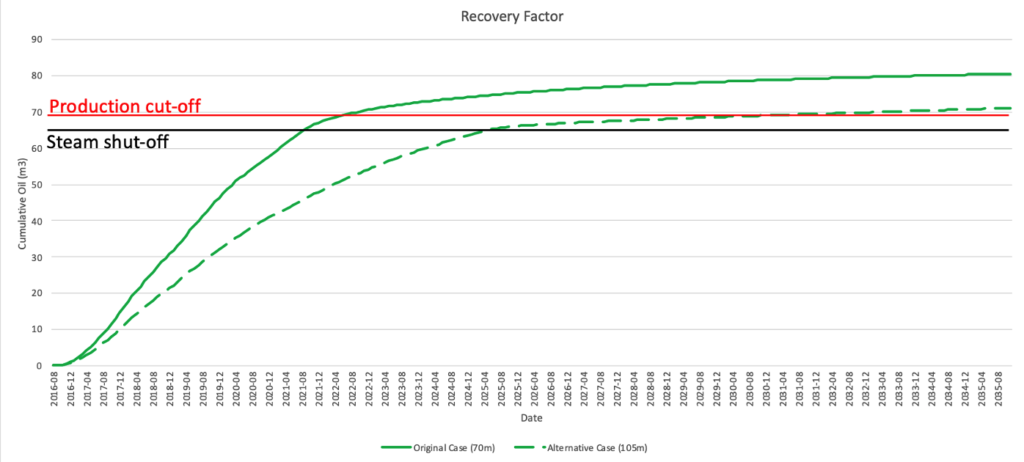
Using the same parameters for the butler equation for both the 70m and 105m case, the production forecasts can be found on the chart below. The OOIP from the analytical model is calculated to be 5.42e+06m3 and the OOIP provided by Cenovus Energy is 5.28e+06m3. Note that the analytical model was completed a semester prior to the simulation model. Even though it is not an accurate to the point when history matching it to the field data, but it was able to provide us with a general idea on the overall trend behaviour between the two scenarios.
Simulation Model
The overall history match cumulative production results for the triple well-pair model (70m scenario) can be found in the table below. Comparing the field data and the simulated data, the two data sets are all within a 5% difference which is noticeably better than the analytical model results. The triple well-pair OOIP is found to be 5.23e+06 m3, which is closer to the value reported by Cenovus Energy (5.28e+06m3) than the OOIP found last semester through analytical model (5.42e+06m3). By the end of the history matching period, the triple well-pair model has recovered 56.8% of the OOIP. The field data is at a recovery factor of 54.2%.

The figure below displays the pad production rate and CSOR comparison between the triple well-pair results and the available field data. The field CSOR is around 2.14 and the simulated CSOR is around 2.06. Both are good as they are below the common industry standard of 3.
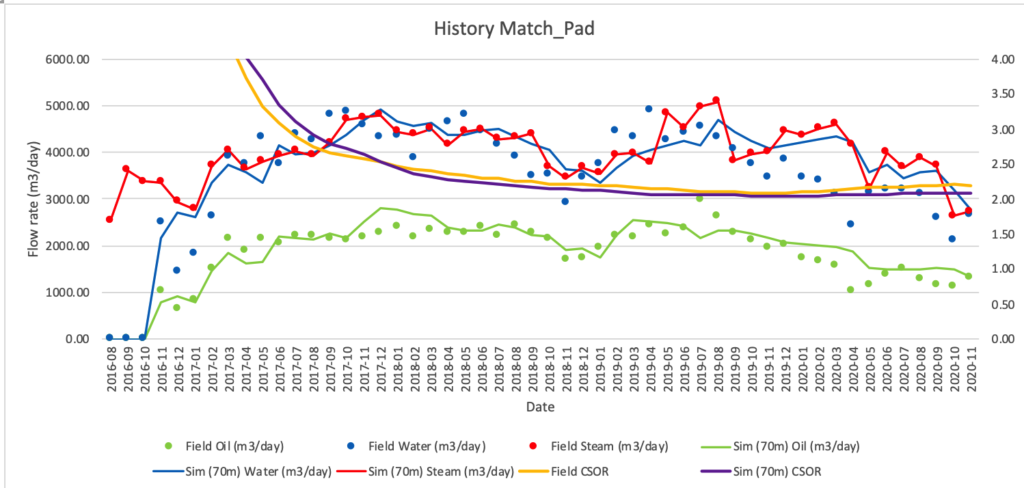
Based on the presentation slides Cenovus Energy provided to AER, they are estimating an ultimate recovery of 69.4%. So, we will be stopping the steam injection when recovery factor reaches 65% and switch to injecting methane gas to maintain the pressure while recovering the last bit of oil through the remaining heat. The cut-off date will be based on when the oil recovery has reached the 69.4% (provided by Cenovus Energy), which is end of July 2022 for the 70m scenario and September 2031 for the 105m scenario.
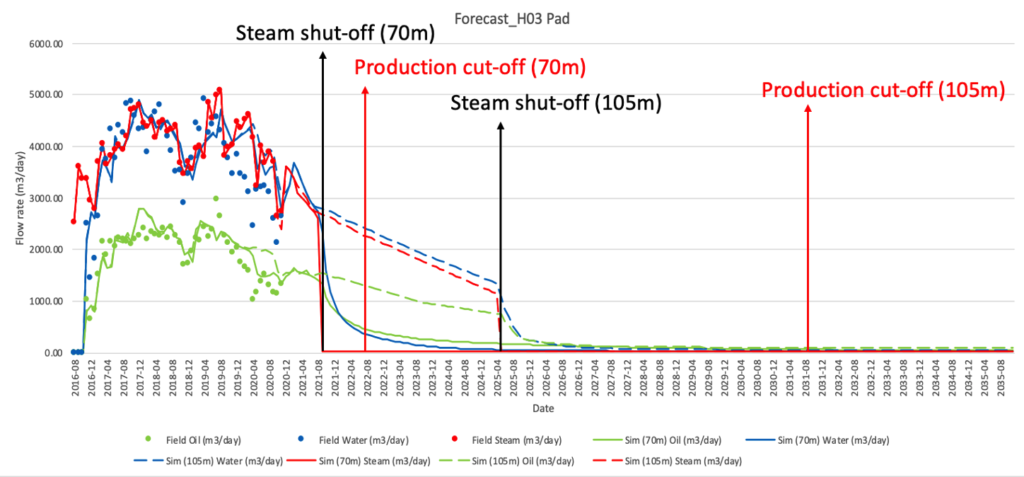
Using the production rates found in this section, economic analysis will be done the Economics section to determine the feasibility of each scenario.
Below are the links to the short clips on the steam chamber growth of the 70m and 105m scenarios.
FEASIBILITY OF OUR DESIGN SOLUTION
The 105m well spacing scenario looks to be the better investment option in almost every sense: it has a better internal rate of return and is predicted to require less initial investment, be more profitable, have a better rate of return, and far less risk of losses with the only drawback being that it will take longer to complete the project. Project time is an important factor. On the one hand, longer project time could leave it exposed for longer to economic climate changes. This is especially important in the current climate for the energy sector, where the sector is moving in a direction away from oil can decrease oil demand and therefore oil price significantly. Other changes such as government policy changes especially in periods where there are elections can also have great impact. This is without even considering circumstances such as the current pandemic which has affected all factors. On the other hand, the longer project lifecycle time also gives it more room to recover from these changes. Especially in the case of the market, prices are more stable over a longer period than a short one. Table below is a summary of results for our NPV (net-present value) calculations:
Partners and mentors
We would like to extend our sincere appreciation to Dr. Nancy Chen and Mr. Tim Boyle. They have patiently provided us with their invaluable guidance throughout the whole project. Their constant good advice and feedback have led us to successfully complete this project.
Our photo gallery
