Project Category: Petroleum
Interested?
Goal & Scope
As primary production in tight oil reservoirs often results in poor oil recovery, secondary and tertiary methods are further required to maximize production and profitability. The goal of this project is to utilize CMG’s suite of products to build an accurate history match of the historical production/injection data and to explore development scenarios such as waterflooding, CO2 huff-n-puff, and CO2 continuous flooding.
After developing an accurate CMG model, the team will strive to forecast the oil rates, oil recovery, and the added economical gains with each development option. Furthermore, a comparative analysis will be conducted to implement a recommendation on the optimal development scenario.
The Brains

Ahmed Rana
Chemical Engineering / Petroleum Minor

Amrit Dhanjal
Chemical Engineering / Petroleum Minor

Ishrat Oishee
Chemical Engineering / Petroleum Minor

Assaad Kanaan
Oil & Gas Engineering

Mustafa Ahmad
Oil & Gas Engineering

Ben Stewart
Oil & Gas Engineering
Study Area & Reservoir Architecture
Pool Background
The Cardium Formation is a late Cretaceous, Turonian, marine clastic that overlies the mudstones of the Blackstone Formation and includes repeated and stacked successions of silty mudstones through siltstones to very fine-grained sandstones. These units are unconformably overlain by chert-pebble conglomerates which in turn are overlain by the marine mudstones of the Colorado group shales.
The Cardium Formation is subdivided into two lithostratigraphic units: the larger Cardium Zone Member, which is primarily composed of shales, and the smaller Pembina River Member, which contains larger portions of sandstones and conglomerates. In the Pembina field, reservoir-like properties are found in the latter member. The sandstone units are classified as sub mature to mature lithic to quarts arenites, whereas the conglomeratic unit ranges from clast-supported quartzose conglomerate to matrix-supported quartzose diamidite. A summary of the pool properties is provided in the table below:
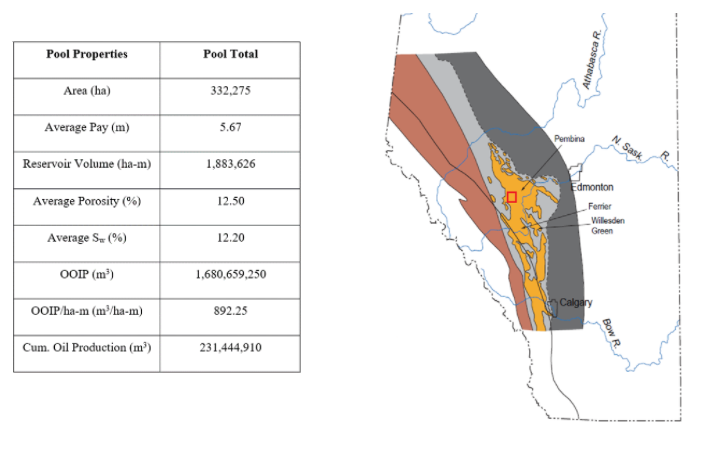
Area of Interest
Since the Cardium Pool covers a massive area and includes many distinct oil plays. The teams study area only represents a fraction of the Cardium pool but is not a pool itself. Therefore, a final extracted simulation area was chosen consisting of section 36-047-11W5, lying between 115°27’52” – 115°29’20” longitude and 53°05’26” – 53°06’18” latitude. The simulation study area was extracted from an initial “expanded” geological model as shown to the right. The primary reason Section 36 was selected was due to its high concentration of hydraulically fractured horizontal wells, with two wells on the northern pad and the remaining four on the southern one. Further reasoning as to why an initially larger area was modelled will be explained in subsequent sections.

Architecture
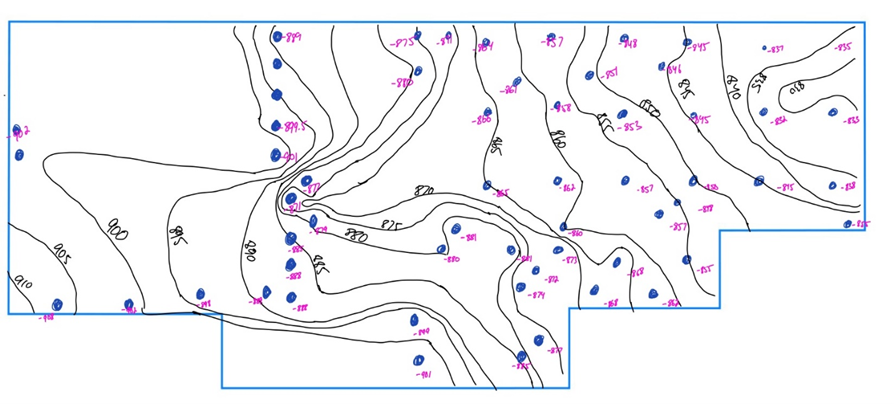
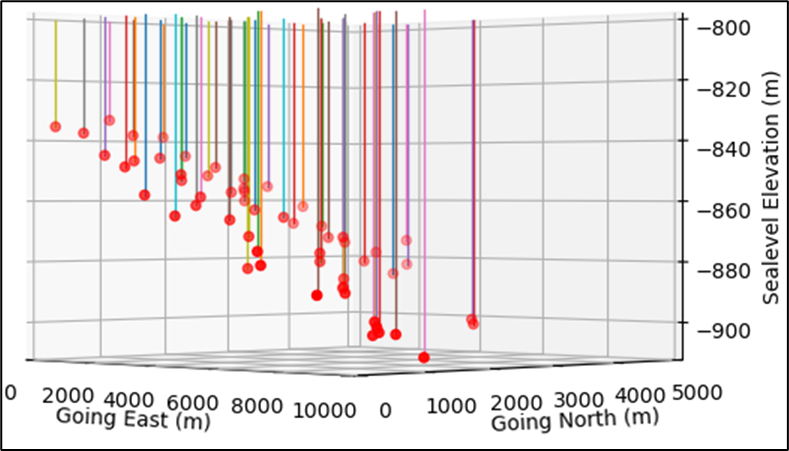
It was noticed that the study area includes a tilt/dip that is going eastward. The figures below displays the tilt by the means of contour lines and a more subterranean three-dimensional representation of the tilt.
It is beneficial to layer the formation into discrete subdivisions, this allows a more refined approach to both understanding and simulating the reservoir. Reservoir zonation will be conducted on a facies basis and a flow unit basis. There are five common types of facies, however, only the “lithofacies” descriptor will be used in this text.
Facies
1. Lithofacies – Facies characterized by a grouping or combination of similar rock characteristics such as composition, grain size, and texture.
2. Biofacies
3. Sedimentary Facies
4. Metamorphic Facies
5. Seismic Facies
Flow Units
A flow or hydraulic unit can be defined as a stratigraphically continuous reservoir subdivision characterized by similar pore type.
Flow units are directly related to the permeability-porosity ratio (k/φ), which is known as process speed. Pore-throat aperture was used to distinguish rock types and flow units in the tight Cardium sandstone:

Where rp35 is the pore-throat (port) aperture in micro meters (μm) at 35% non-wetting phase saturation, k is permeability in mD, and φ is the fractional porosity. It is necessary to understand that flow units are not necessarily homogenous, it is possible to have both reservoir and non-reservoir quality lithologies within a flow unit.

Reservoir Geomodelling
Core & Log Interpretation
A combination of both well logs and core analysis were used to determine certain parameters of the reservoir including porosity, resistivity, permeability, water saturation, and oil saturation. Using values provided by the analysis, the team was able to determine similarities in petrophysical parameters which allowed the development of models for wells 100/09-26-047-11W5/00, 100/10-32-047-10W5/00, 102/06-32-047-10W5/00, 100/16-36-047-11W5/00, 100/10-01-048-11W5/00, 100/09-03-048-11W5/00, 100/03-06-048-11W5/00, and 100/14-06-048-10W5/00. Well Surveys and a cross log interpretation for these wells are shown in the figures below:


Special Core Analysis
A Petrographic study was conducted on the core of well 04-36-047-10W5 and provides valuable information that otherwise could not have been attained solely from the logs.
Clays have an innate ability that allows the passage of cations, a numerical value for this ion-exchange capability is called the Cation Exchange Capacity (CEC). CEC analysis is valuable as it provides information on the potential presence of swelling clays and can aid in obtaining a more accurate water saturation. Wet chemistry CEC tests were conducted for five samples from well 04-36-047-10W5. A CEC of 6.23 meq/100g was determined by averaging the CEC values for all tested samples. Based on the low CEC value, it can be concluded that the clay composition is predominantly kaolinite and illite as opposed to montmorillonite or smectite (high CEC clays) which further implies that clay swelling is a minimal concern for the sandstone in the Pembina River Member. The above conclusion is confirmed by clay species identification from X-Ray Diffraction (XRD) analysis. Estimating becomes a trivial task when compositions are available from XRD, in this case an average clay grain density of 2.657 g/cc was calculated

Simulation Grid System
The successful matching of historical reservoir production data with simulator output results depends on the level of geomodelling accuracy. The team did not have access to a predefined geological model which can be attained from a RESCUE file, alternatively, well trajectory data for various wells alongside formation top data was imported from geoSCOUT. The integration of this data allowed for the creation of contour maps.
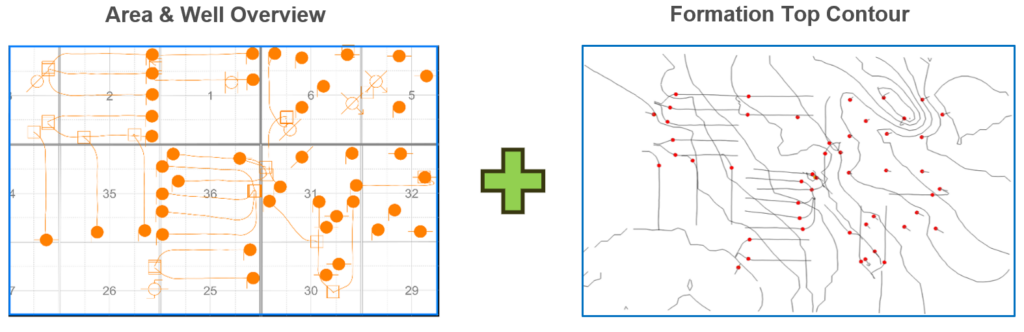
The contour maps were then utilized to generate a highly structured 3D-grid in CMG Builder and is presented in the figure below.
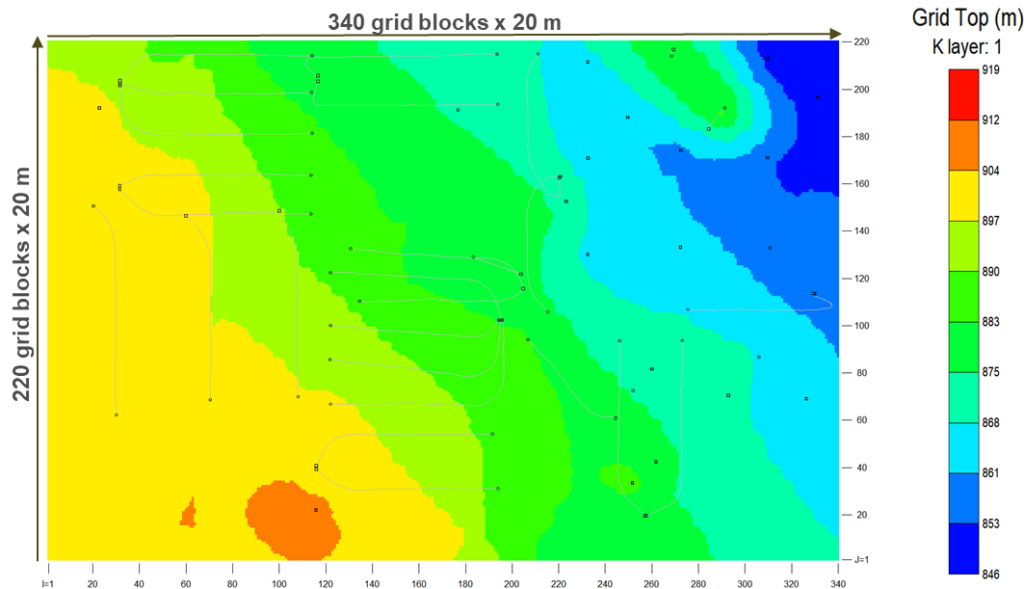
The grid depth distribution accurately represents the slight tilt that is observed in the simulation study area. The expanded model consisted of 340 by 220 gridblocks in the I and J direction with uniform 20 m spacings.

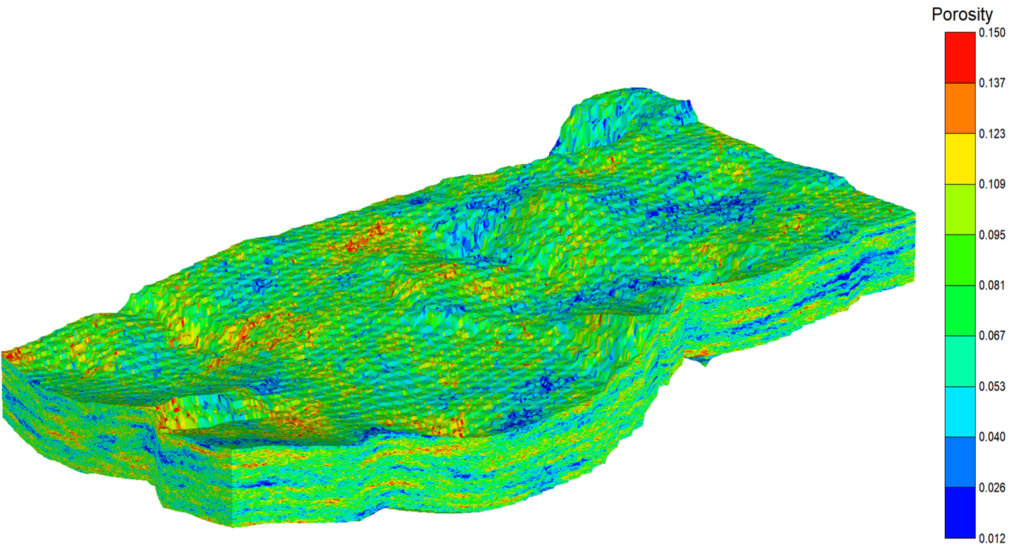
Geostatistics
The simulation study area is a prime zone for hydraulic fracturing jobs; however, the downside with such a small area is the limited availability of data. The simulation area contains of six to seven wells (only one of which had meaningful log data) while the expanded model contains dozens of wells. The wells in the expanded zone harbor a plethora of viable data such well logs, pressure tests, PVT tests, cores, and special cores. The co-authors took the approach of structuring the initial geological model as the expanded area and incorporated geostatistics to create contour maps and populate petrophysical data. By starting with the expanded model, the co-authors were able to utilize data from a total of seven wells, as opposed to only one well. The CMG Builder geostatistical simulation module was used to distribute petrophysical data accurately throughout the reservoir.

This method is a statistically valid approach and the auto-generated variograms were fine tuned in terms of nugget, sill, and range. The geostatistical gaussian simulation approach was used for porosity, permeability, and water saturation distributions while the ordinary kriging method was used to create a grid top contour map. The image below displays the resultant porosity distribution throughout the expanded study area.
With the expanded area now fully populated with petrophysical, geological, and reservoir parameters, it is possible to extract a sub-model from this zone, i.e., the simulation study area. CMG’s Builder reservoir extraction module allows for such a workflow. The figure below displays the fully extracted study simulation area which now has a more accurate representation of petrophysical parameters due to the implementation of data from nearby wells from the original expanded model.

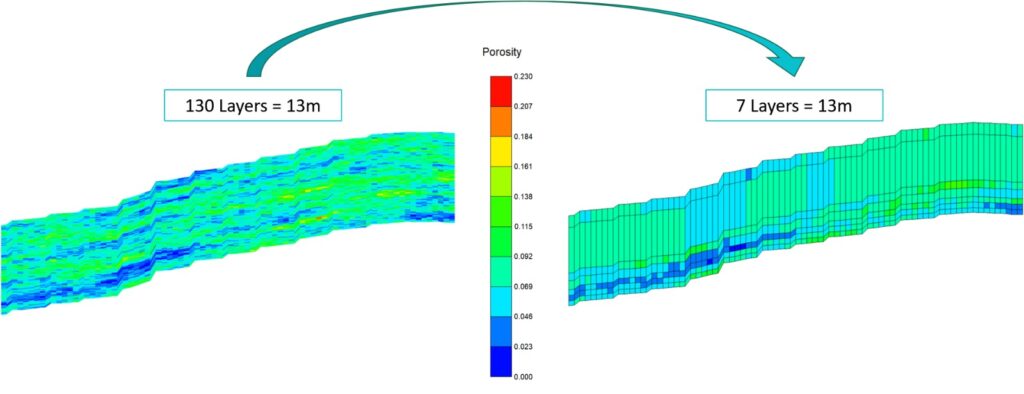
Up-layering
Although the extracted model is accurately represented, the amount of data that was originally implemented resulted in a very refined model, specifically in the vertical direction which consists of 130 layers. Well logs attained provided data points for every 0.1 m. Since the gross pay of the reservoir is 13 m, implementing a data point for every 0.1 m led to the creation of 130 layers each with a 0.1 m thickness in the vertical direction. Although accuracy is high, having 130 layers in the vertical direction is extremely undesirable for simulation purposes. Essentially, the model needed to be uplayered in the vertical direction. Uplayering the model employs a workflow which groups layers based on similar porosity values utilizing a standard deviation calculation. The team was able to uplayer the original model to seven layers in the vertical direction. The figure below displays the model uplayering process, indicating that similar porosity trends exist from the original model (Left) with the final uplayered model (Right) all while maintaining a high level of robustness.
Compositional Fluid
The compositional fluid model is developed using fractional analysis and PVT data retrieved from geoSCOUT. The team utilized CMG’s WinProp program to characterize the reservoir fluid. In WinProp, laboratory data for fluids can be imported and an EOS can be tuned to match its physical behavior. The team then supplied detailed information on the reservoir oil which contained a description of associated single carbon numbers and their fractions, saturation pressure test results, separator results, differential liberation test results, and swelling test results. All of the aforementioned data was utilized to tune the EOS with the fluid behavior.
Initialization
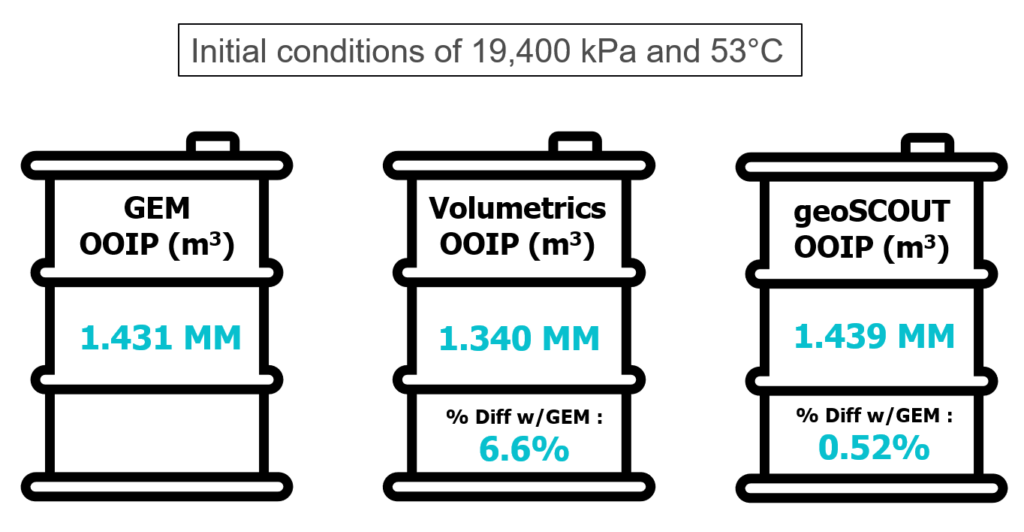
After successful initialization, Oil Originally In-Place (OOIP) was retrieved and compared with previous results from volumetrics in ENPE 511 and geoSCOUT. The figure below provides a summary of the in-place fluids as obtained from GEM at initial conditions of 19,400 kPa and 53 °C. The in-place estimates between GEM and volumetrics/geoSCOUT surpass the industry-accepted standard of a 10% difference.
Drilling & Completions
Overview
The method used to induce the hydraulic fractures was to use high pressure water into the formation. The fracturing method was done in stages where a packer was used to isolate the zone of interest and large volumes of high-pressured water was sent into the frac port to induce the fracture at the targeted location. On average, each of the 6 wells within the scope of this project had between 15-22 fracture stages respectively. Since all 6 horizontal wells have been drilled, completed and fractured it was decided by the team alongside the supervisor of this project to not engage in drilling additional wells. However, from the development scenarios, recompletions are necessary and will be discussed in subsequent sections.
Hydraulic Fracturing
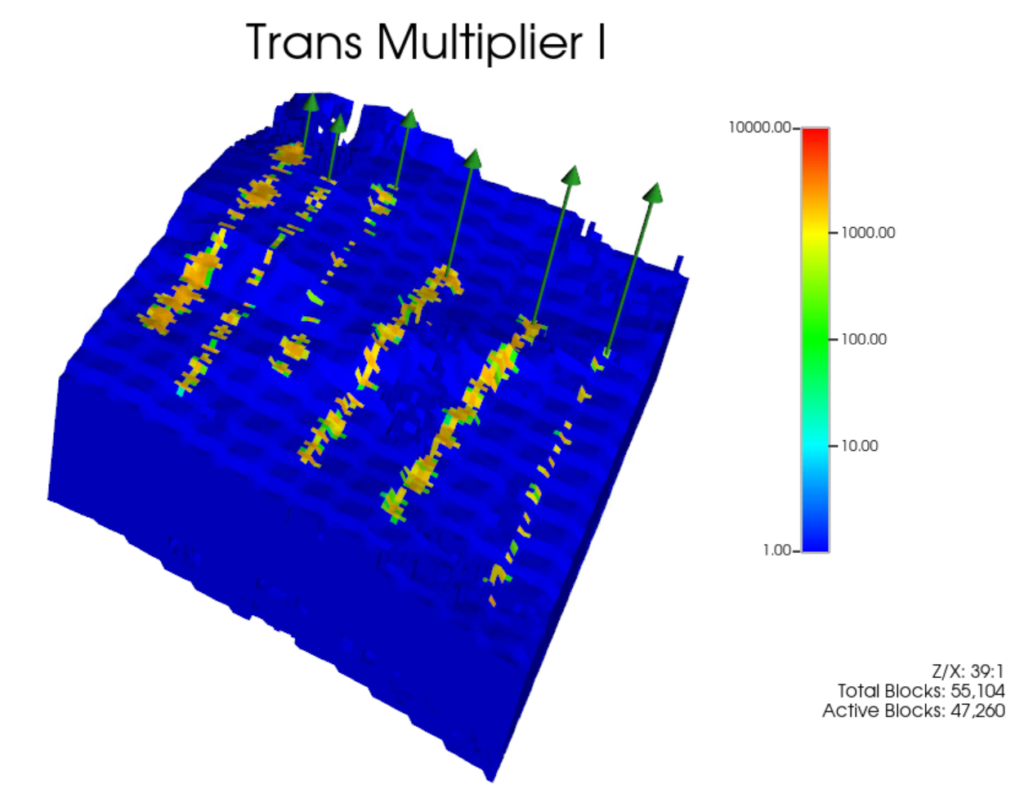
Creation of hydraulic fractures was modeled by utilizing compaction/dilation tables and geomechanics as opposed to a simple planar fracture workflow. The geomechanics data required for this advanced approach was retrieved from a nearby well that had a detailed rock mechanics test. The figures below showcase the post-fracturing results (residual transmissibility and permeability).
Reservoir Simulation
History Match
The history match was conducted by constraining the oil rate. Preliminary results indicated that the gas was underproducing, as shown in the figures below.

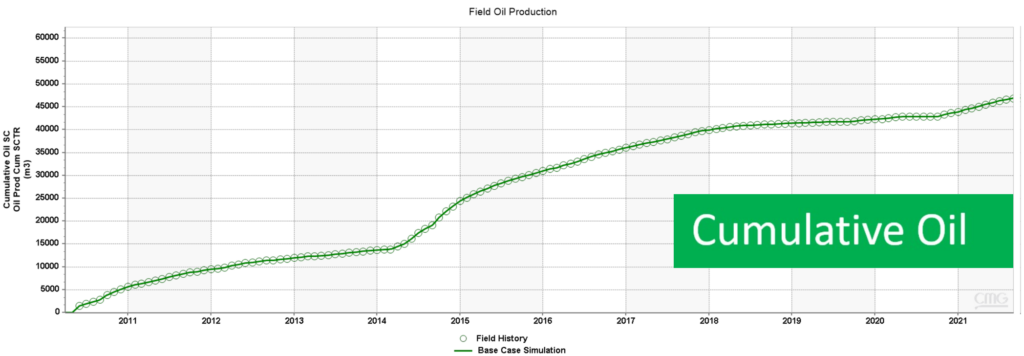
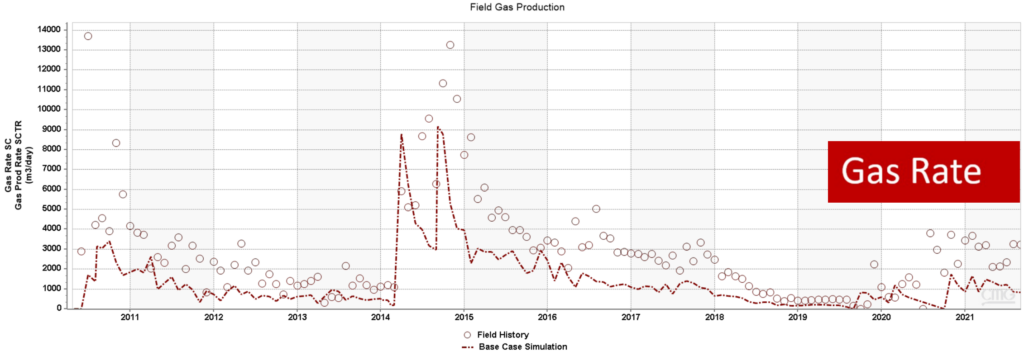
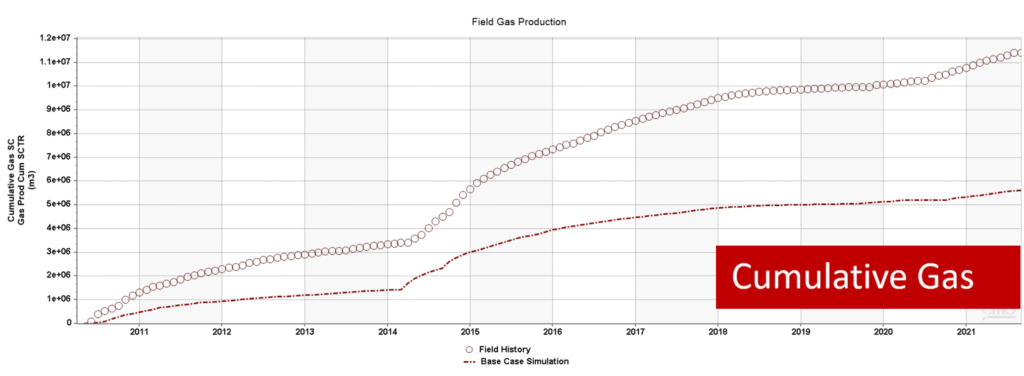
To obtain an accurate history match the team realized that the gas was underproducing and the mobility of gas needed to increase. Therefore, the team resulted in characterizing relative permeability sets for fractured and non-fractured areas within the reservoir. The optimized relative permeability sets led to an industry accepted gas match as shown in the figures below.


Base Case Forecast
The base case forecast simulation ran for a period of 10 years beginning in September 2021 and ending in September 2031. From observing the decreasing oil rates at the end of historical production, the reservoir is at a critical time period to conduct further enhanced oil recovery techniques.


Development Scenarios
Overview
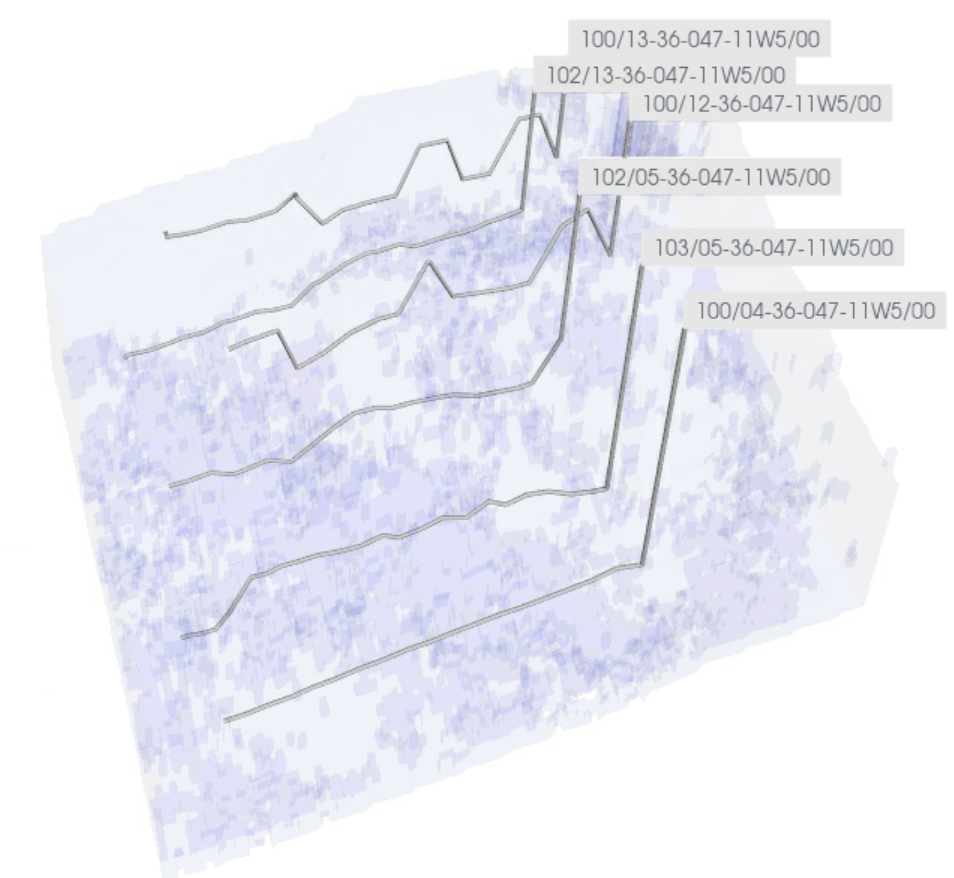
From careful analysis as well as recommendations from the teams direct supervisors, wells 103/05-36-0411W5/00 and 102/13-36-047-11W5/00 were converted into injectors for both the flooding cases as shown in the image below. For the huff-n-puff scenario all six horizontal wells will be converted to injectors periodically.

Waterflooding
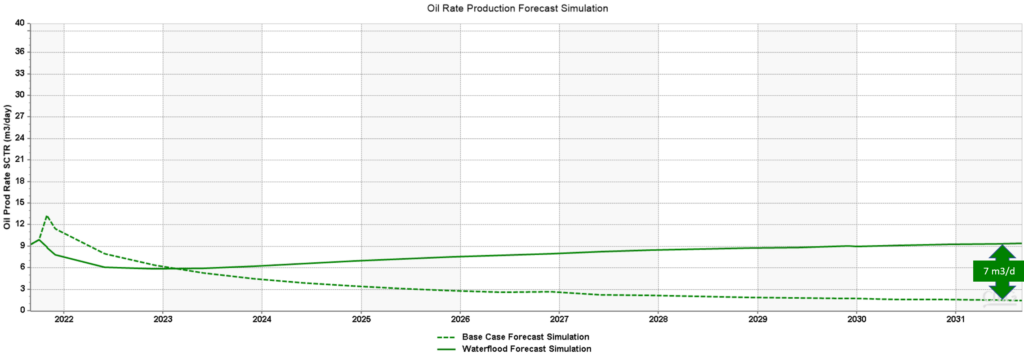
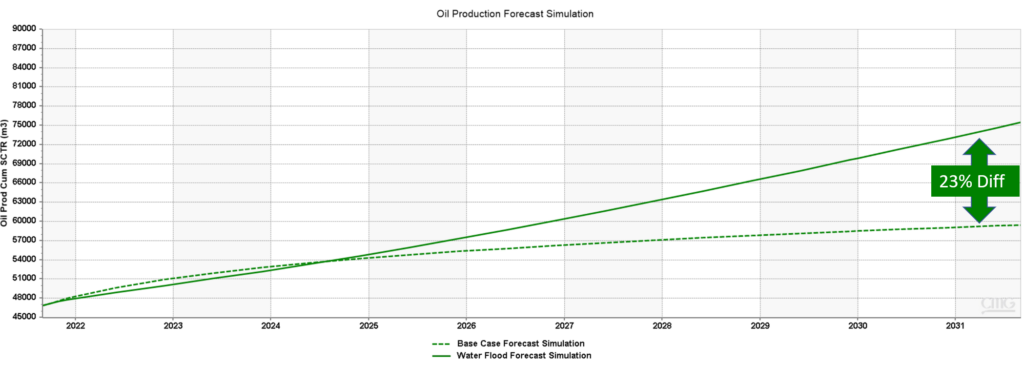
From the two figures below, the simulation was conducted for an additional ten years after historical production data ended to see the incremental increase in oil production rates and the cumulative oil produced. A water injection flow rate of 25 m3/day for both 103/05-36-0411W5/00 and 102/13-36-047-11W5/00 was commenced. This injection flowrate was determined from a similar pilot project near the target area, that was compromised of six horizontally fractured wells, with two injectors and four producers. From the comparison with the base case, the oil production rate yielded an increase in 7m3/day and the cumulative oil production yielded a positive percent difference of 23%.
Continuous CO2 Flood
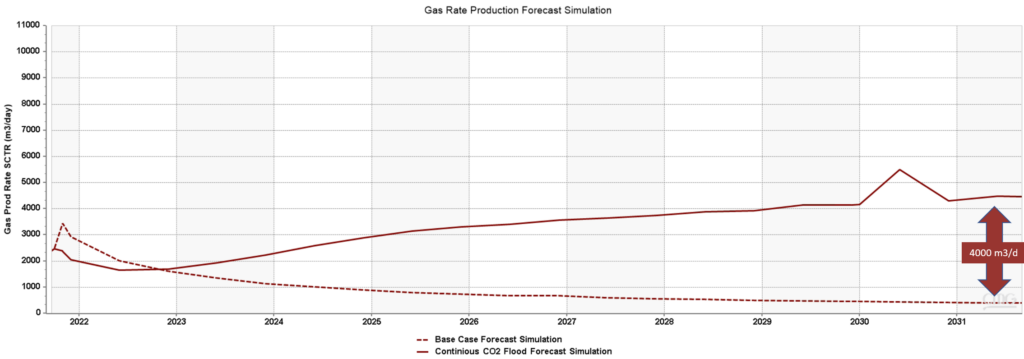
Similar to the waterflooding scenario, the figures below display the increase in incremental production rates and the overall impacts on cumulative production after ten years of the forecast simulation. The CO2 injection rate was 25 m3/day for both injection wells based off the same pilot project used for the waterflooding. In comparison to the simulated base case forecast, the continuous CO2 injection scheme resulted in an incremental oil increase of 13 m3/day and the cumulative oil production yielded a positive percent difference of 38%. As production increased drastically, the gas was inevitably bound to increase as well. From simulation results shown below the gas production rate increased by 4000 m3/day and the cumulative gas production increased by a percent difference of 45%.


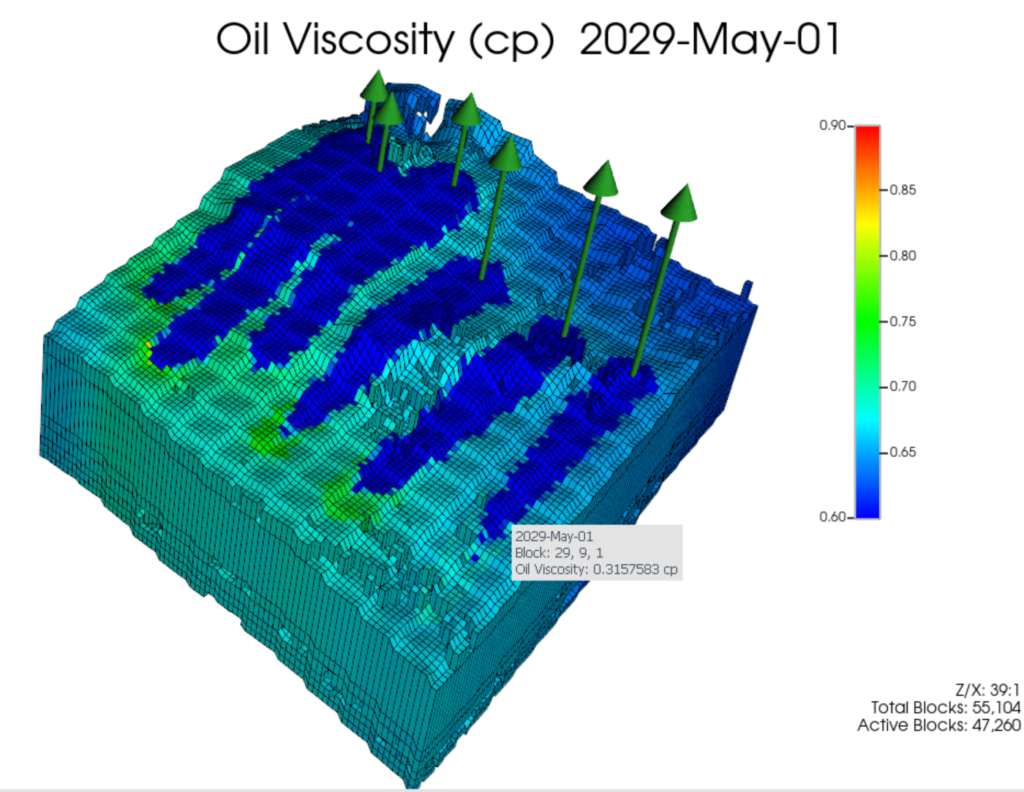
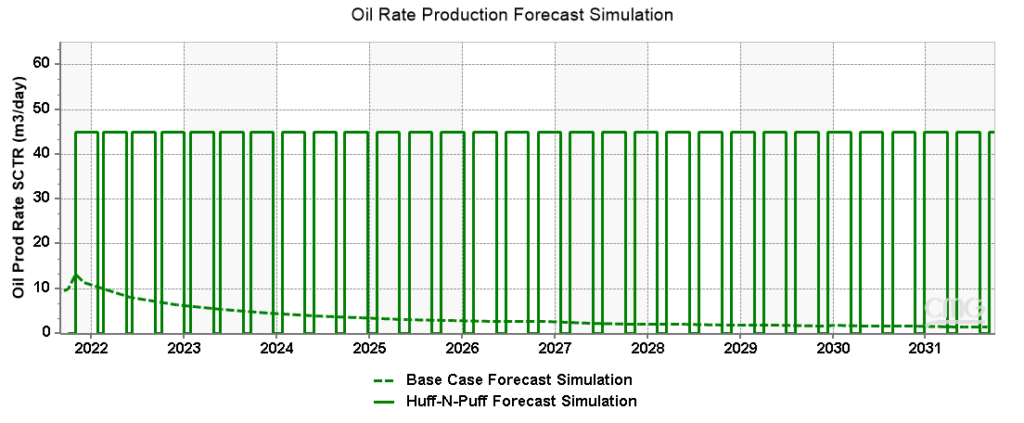
Huff-N-Puff
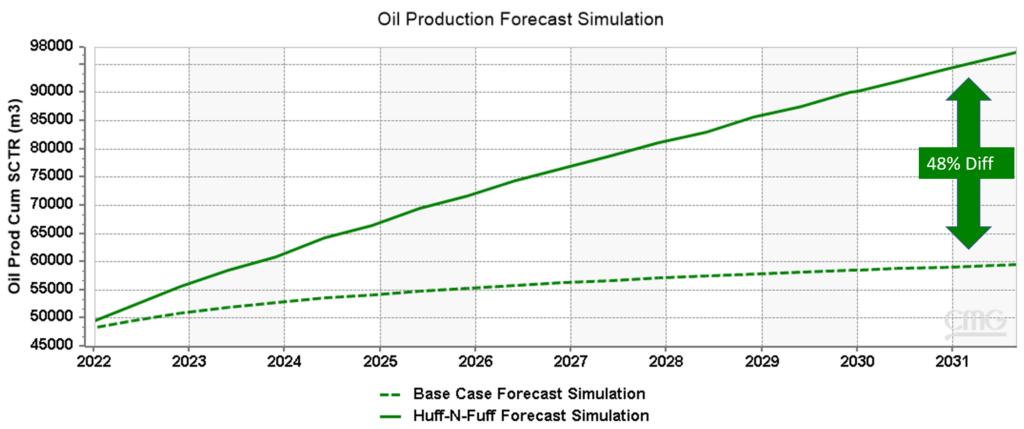
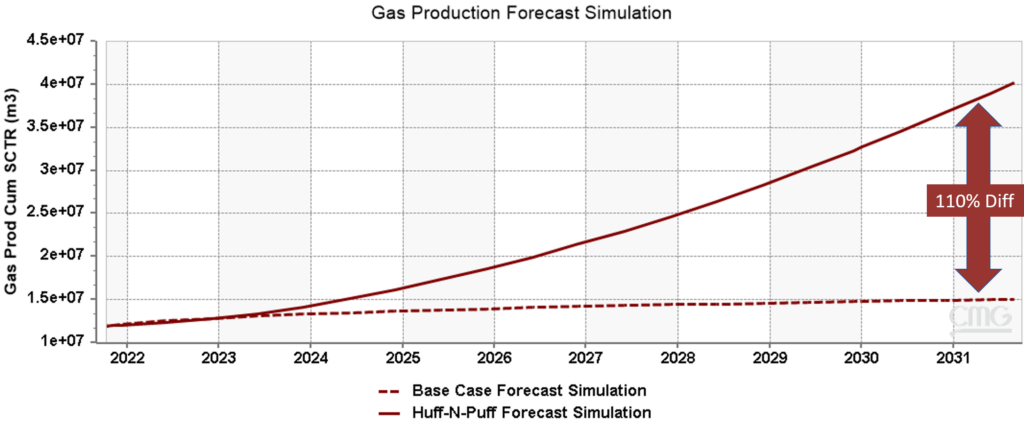
Opposed to the previous flooding process, all six producers were converted to injectors periodically. The Huff-N-Puff process can be broken down into three stages. The first stage consists of injecting CO2 into the reservoir, the second phase consists of shutting in the injectors and allowing the CO2 to diffuse into the oil which causes the oil to swell resulting in a lower oil viscosity. The last phase is opening the wells for production. In the simulated results the injection time was set to thirty days, the soaking period was set to seven days and the production period was set to ninety days. A total of twenty-eight cycles were completed within the ten-year period, which resulted in a percent difference increase in the cumulative oil production of 48% and a percent difference in the cumulative gas production of 110%.

Comparing the 3 Scenarios
When analyzing the figure below it can be seen that waterflooding was not as effective in increasing incremental oil production in comparison with both CO2 methods. This could be attributed to factors such as an unfavourable mobility ratio which could potentially lead to premature breakthrough (viscous fingering), and the unfavourable wettability as the contact angle of our reservoir implies a mixed to oil-wet wettability. Both CO2 development scenarios performed well within our reservoir as CO2 is miscible with the oil therefore resulting in a reduction in the interfacial tension, expansion of oil, and a reduction in the viscosity which ultimately led to an enhanced recovery of oil due to the increase in the oil mobility. However, the CO2 Huff-N-Puff method outperformed the continuous CO2 flood for several suspected reasons. First, the continuous CO2 EOR flood had a negative response to the high reservoir heterogeneity since the presence of hydraulic fractures and zones of high permeability created non-uniform oil displacement. The non-uniform oil displacement led to an increased chance of premature CO2 breakthrough, ultimately reducing the recovery factor. Secondly, the Huff-N-Puff scenario was able to utilize all six horizontal wells to inject CO2 into the reservoir opposed to only two wells used in the continuous flood. Lastly, an optimal soaking period was determined in the Huff-N-Puff scenario that further enhanced the reduction in the viscosity and improved the mobility of the oil.


Facilities
Overview
Surface facilities play a key role in EOR operations. For the vast majority of CO2 injection EOR schemes, the surface facilities are generally designed to separate the effluent gases (primarily CH4 and CO2) from the produced liquid stream and, importantly, to sequester the effluent CO2 for reinjection into the formation. The surface facilities will also segregate the liquid streams into separate oil and water streams for sale, re-injection, or treatment. Segregating the effluent into hydrocarbon, CO2, and water streams is necessary for profit generation and for handling biproducts, like effluent water, in a more efficient and environmentally responsible manner. Surface facilities also ensure that the various output streams meet the regulatory and end-client specifications in terms of their composition and acceptable maximum contaminant concentrations.
The surface facility can be broken down into the following components:
Slug Catchers
These units are incorporated into surface facilities when the gas flow rate is large, as in a CO2 EOR scheme, with considerable liquid surges. Featuring separate gas and liquid chambers, slug catchers provide the additional storage capacity necessary to contain the liquid surges while also dissipating the energy surges generated by high-velocity liquid slugs. In most cases, slug catchers are designed with a minimum of 25% safety factor to account for especially violent ore disruptive liquid surges.

Since most of the terms in the correlations above are unknown, like the liquid holdup (Vol) and the time TR, the co-authors made a number of assumptions to proceed with the slug catcher design. With a 25% safety factor, this translated into a final slug catcher size of 117.5 bbl, or approximately 18.8 m3.
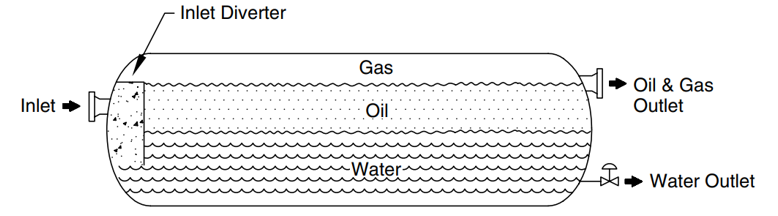
Free Water Knock Out (FWKO)
This unit type is designed to mechanically segregate the bulk of the effluent water from the oil which, together, enter the vessel as an emulsion. To do so, FWKOs utilize inlet diverters to mechanically break up the effluent emulsion into separate streams. Sometimes, FWKOs also employ quieting baffles to reduce the velocity of the effluent’s flow into the vessel, allowing more time for gravity-induced segregation to take place. It must be noted here that the liquid capacity constraint of a FWKO almost always dictates the size of this unit type since the proportion of the gaseous phase is usually rather small compared to that of the liquid phase.
Demulsifier
Specialized chemicals are used in the demulsifier to break the water-oil emulsions. Emulsion breaking chemicals are used to erode the oil film surrounding the water droplets such that the film will break upon collisions between droplets. The proper sizing of an oil-water demulsifier unit requires intensive field trials to determine the optimum combination of demulsifier size, demulsifier chemical type, and retention time that match the always changing effluent qualities. Given their inability to conduct such field trials, the co-authors sought to identify a viable demulsifier vessel design in published research and in equipment manufacturer manuals. During this research, Vessel Internal Electrostatic Coalescers (VIECs) stood out as an especially promising means of oil-water emulsion separation.
CO2 Segregation
During any CO2 injection-based EOR process, the need will always arise to separate the produced effluent gas from the injected CO2 returned to the surface before recycling the separated CO2 back into the formation. CO2 capture is carried out, in most industrial and engineering applications, with the aid of specialized amines. One such amine is diethanolamine (DEA) solvent which offers a number of advantages over analogues, especially in terms of its chemical stability and resistance to degradation. A typical DEA-based CO2 separation operation usually requires the flow gas stream to contact the DEA solution in an absorber. The DEA will then selectively absorb the CO2 before flowing into a regeneration column. Within this unit, the DEA solution is heated to release almost pure CO2. The lean DEA solution is then recycled back to the absorber where this process is repeated.

Economics
Economic Analysis
Based on the cost classification developed by the Association for Advancement of Cost Engineering International (AACE), a cost estimation followed by a thorough economic analysis was carried out by employing a Class V Capacity-factored parametric model for base-case forecast, continuous injection, and huff-n-puff.
Validated by industry standards, CAPEX estimation for each scenario included drilling, completions, facility, pipeline, construction, and transportation costs. OPEX estimation for each scenario included wellhead lease operating, central processing – facilities operating, supervision, and overhead costs.
With 20% royalty and 22% tax paid in each scenario, the following table summarizes the calculated numbers from the cost and economic analysis over 10 years for the total asset.


As evident from the above table, both continuous and huff-n-puff development scenarios are proven to be more profitable compared to the base case forecast. Positive NPV values indicate that the target yield is achieved by the investment.
Comparing the two development scenarios: as the NPV value quantifies whether the project is worth more or less than what is being paid, the Huff-N-Puff development scenario renders a much higher project worth over time when compared to the continuous scenario.
Measuring the performance of the capital investment between the two development scenarios, the Huff-N-Puff case generates a higher positive ROR value which proves that it will render a higher gain on the investment over the specified time compared to the continuous case.
The higher profitability of the Huff-N-Puff case is further established by the return on investment (ROI) calculated values which evidence that total returns exceed total costs, and the project is financially successful.
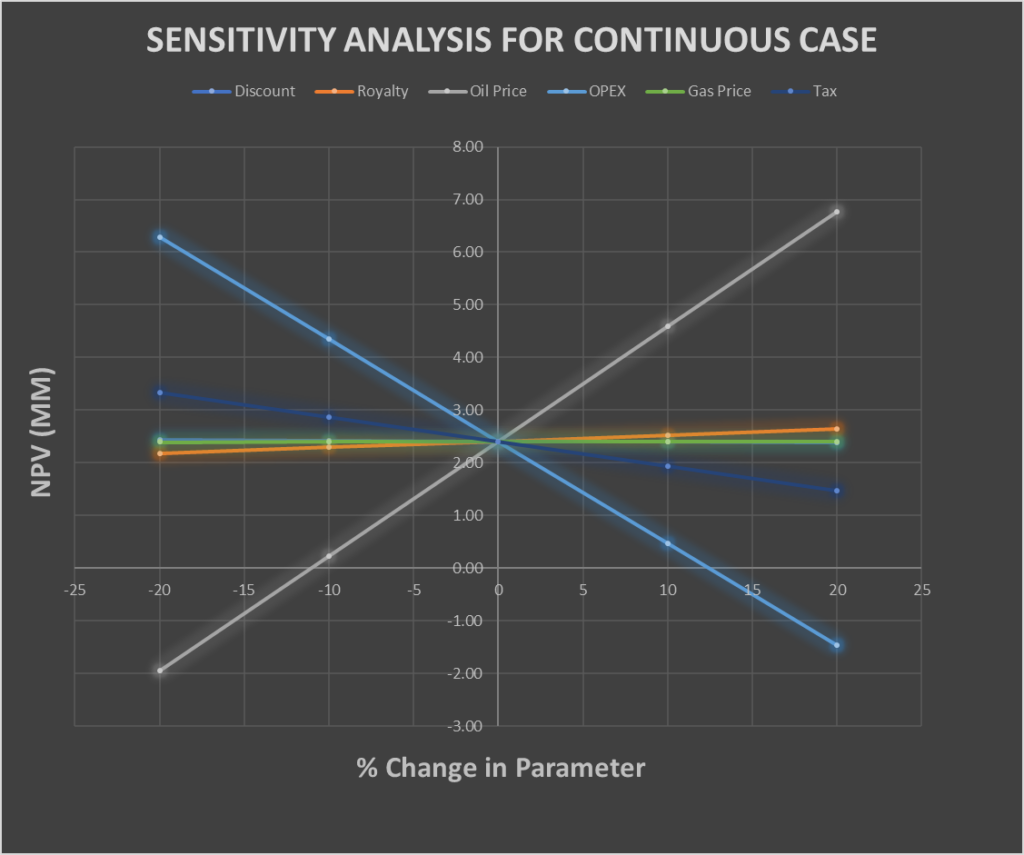

The sensitivity analyses spider plots are generated for both development scenarios. Both development cases show similar trends in terms of the sensitivity response to NPV. However, a slightly steeper slope in the Huff-N-Puff scenario for the NPV response to the oil price change indicates that the Huff-N-Puff development scenario will be more susceptible to oil price fluctuations due to unexpected global and political issues such as the COVID-19 pandemic, Russian invasion of Ukraine, etc. This is expected as the Huff-N-Puff revenue increase is primarily due to its high oil production.
On the other hand, gas price change yields negligible NPV response as a result of low gas prices. For both development scenarios, as expected, NPV response to the oil price change is most sensitive.
Another takeaway from the sensitivity analysis, low operating cost yields high NPV indicating that operating costs can be optimized to improve NPV over time. Lowering operating costs will maximize revenue and the overall NPV. One of the possible ways to lower operating costs is to streamline the management structure such that fewer intermediate decision-making layers are needed to meet the project deliverables. This will reduce the supervision, overhead, and administrative costs significantly, thereby contributing to the project’s bottom line.
Recommendation
Final Overview
From analyzing the production forecast from all three development scenarios, the CO2 Huff-N-Puff proved to be the optimal development scenario as it yielded the highest oil recovery. When compared to the base case forecast, the cumulative oil production yielded a percent difference increase of 48%. From an economics point of view the Huff-N-Puff method provided the highest net present value for the 10 year span yielding a value of $6.79 million with net revenue being $4.22 million per year. Therefore, the team will highly recommend the Huff-N-Puff development scenario to maximize production and profitability.
Special Thanks

Dr. Nancy Chen
Capstone Supervisor
Special thanks for Dr. Chen for providing continual guidance throughout both semesters. Although the topic of CO2 EOR is not covered academically, you went above and beyond and provided the team with detailed knowledge and made complex EOR topics easier to understand.

Dr. Koorosh Asghari
Capstone Supervisor
Special thanks for Dr. Asghari for sharing his immense technical knowledge with the team. Your encouragement and positive attitude helped the team strive for greatness.
Referenced Material
| [1] | M. G. Gerritsen and L. J. Durlofsky, “MODELING FLUID FLOW IN OIL RESERVOIRS,” Annual Review of Fluid Mechanics, vol. 37, pp. 211-238, 5 January 2005. |
| [2] | Computer Modelling Group, Computer Modelling Group (CMG), Calgary: Computer Modelling Group, 1978. |
| [3] | T. S.J. and P. E.H. , “Pembina Cardium CO2 Monitoring Project, Alberta, Canada—Geochemical interpretation of produced fluid compositions,” Energy Procedia, vol. 1, no. 1, p. 9, 2009. |
| [4] | V. E. and W. C. C. , “VRR < 1 Is Optimal for Heavy Oil Waterfloods,” in SPE Offshore Europe Oil and Gas Conference and Exhibition, Aberdeen, 2013. |
| [5] | J. L. J. Duhault, D. Cho and K. Manchul, “Cardium Microseismic West Central Alberta: A Case History,” Canadian Society of Exploration Geophysicists, N/A October 2012. [Online]. Available: https://csegrecorder.com/articles/view/cardium-microseismic-west-central-alberta-a-case-history. [Accessed 26 October 2021]. |
| [6] | J. R. Duda and R. Long, “Carbon Dioxide Enhanced Oil Recovery,” National Energy Technology Laboratory, Washington, 2010. |
