Project Category: Petroleum
Join our presentation
About our project
This project is centred around the development of the Wildmere VVV heavy oil reservoir. It resides within the Lloydminster formation and is being produced by Westlake Energy. Currently, there are 30 horizontal wells, 29 of which are producers, and one is an injector. Recovery has been dwindling since the 2010’s and we are looking to improve it. One of the methods that can be used to accomplish this is water-flooding, a secondary recovery method. To enhance the production performance of our pool several suspended wells will be converted to injectors based on our proposed development strategies. The effectiveness of the water-flood and polymer flood will be assessed by developing a model within CMG IMEX to produce production forecasts.
Meet our team members

Ayesha
Abid
Chemical and Petroleum Engineering

Mohammed
Al-Ruwishan
Oil & Gas Engineering

Ravin Jayasuriya
Oil & Gas Engineering

Yousaf
Raza
Chemical and Petroleum Engineering
Details about our project
Geology
Depositional History
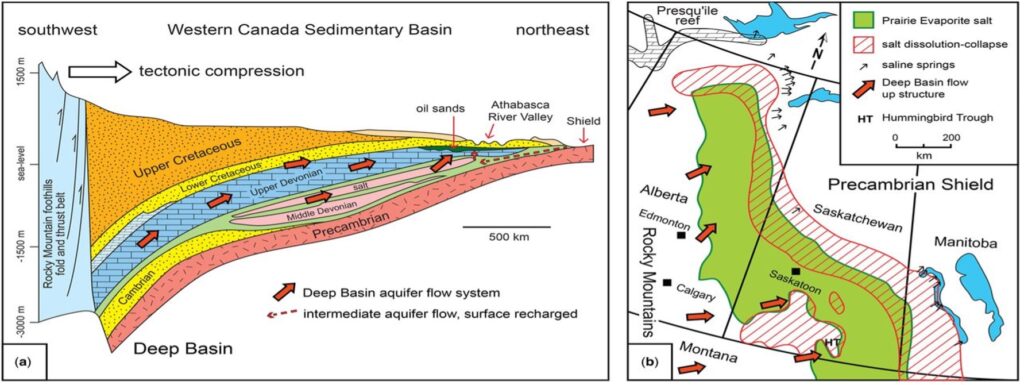
The depositional history of our pool resembles closely to that of the Manville group area as they were deposited around the same time. The sediments are mainly deposited by the alluvial fans and rivers. Deposition in the sandstone is a marine delta-front deposition. Fluvial channel sandstone siltstone shale and coal are the main features of the depositional period. The reservoirs are very fine grained, highly porous and clean. Upper deposition was later followed by the middle to the erosion. The main oil accumulation seal in the region was Lower Cretaceous reservoirs as shown in figure below.
Rock Types and Source Trap
The rock types observed within our formation consisted of shale, siltstone, coal, and lenticular sandstone. The relative sea level and the further continued basin subsidence resulted mainly in the progressive succession of these rock types. Major sediment deposition in reference to the cordilleran evolution have pushed the shoreline to the northward and transformed it into flood plains. Most of the basin found to be flooded due to the major rise in sea level.
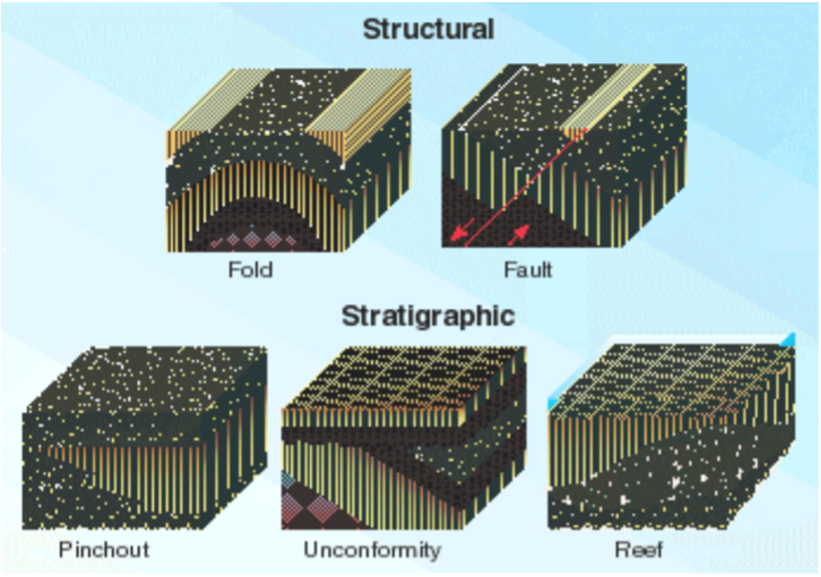
It is a fact that a large amount of oil has been trapped in a structural trap. In the Lloydminster area, the heavy oil is trapped in pinch-outs. It is mainly pre-Cretaceous sandstone structure in Lloydminster and GP basically forming on-lap style traps, whereas sparky forms the structural traps. The oil accumulations in the region have been attributed to facies-related traps. Stratigraphic and structural hydrocarbons traps are found in the region, some of which are created by sandstone.
Production History
The first well (102/06-30-047-06W4/00) was drilled in 2005, but there was no production from the pool until 2009. In 2009, a gas well (100/05-29-047-06W4/00) was put on production. In 2010, another well was drilled (100/03-29-047-06W4/00) and it was discovered to be an early oil producer. This early oil well was produced until late 2020. In 2013, an infill drilling program was implemented to develop the oil zone and the gas cap was shut in. In 2015, the production increased up to a maximum of 1600 bbl/day as a result of the infill drilling program. After the peak production rate, the pool production declined on solution gas drive. In late 2017, two more producers were added resulting in a production increase up to 251 bbl/day. This pool has no work-overs to date.
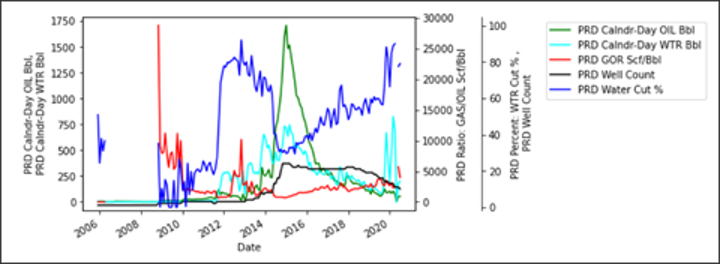
The gas-oil ratios decreased after gas cap was shut in, but gradually increased again as the pressure was drawn down during solution gas drive. A water flood was started in late 2019, however there is no early signs of production response. The pool produced moderate amounts of water at a fairly constant rate. The water cut varied as the oil production increased or declined. Constant water production rates per well are indicative of production of mobile initial water from the formation. Since the water rates per well are constant, it is concluded from the production data that there is no active aquifer for this pool.
Pressure History
The bubble point pressure for this pool was measured at 4200 psia. The pressure data for this pool is very limited, and because this is a heavy oil pool the pressures are not built up well. Therefore, the pressure history for this pool does not provide us with reliable pressure data. The figure below provides a plot of pool datum pressures recorded for this pool.
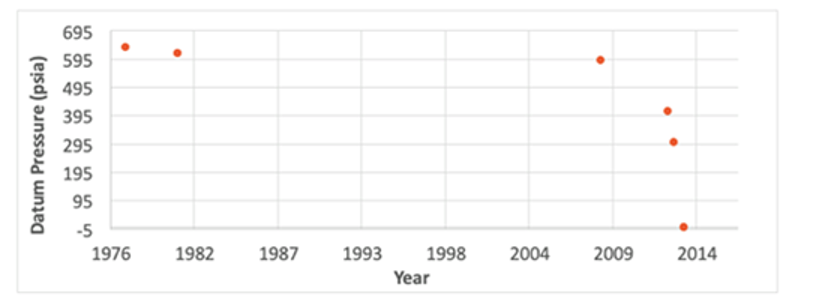
Overall, the estimated current reservoir pressure is less than 1000 kPa. The initial pressure obtained from the pressure data is 4200 kPa at the gas-oil contact – i.e. this is the bubble point pressure since the reservoir has a gas cap. An assumption was made to treat this as the initial pressure because the measurement was taken in 1981 and the production does not start until 2009 – the first well is drilled in 2005.
Reservoir Characterization
Logs Interpretation
The logs interpretation of the Llyod formation agrees with the geological history of the formation. The shales are concentrated at the bottom of the formation. As you move upwards, we see coarser material coming in with a gradational change in the rock types. We do not see any sharp changes on the gamma ray log as a decrease in shale and fines is seen as we are moving upwards. We see interbedded siltstones on top of the shales and fines. The sand sits on top of the siltstones with the presence of coal at the very top of the formation. A gas oil contact was seen in one well at an elevation of 15.7 m. There were no water zones identified from the available logs.
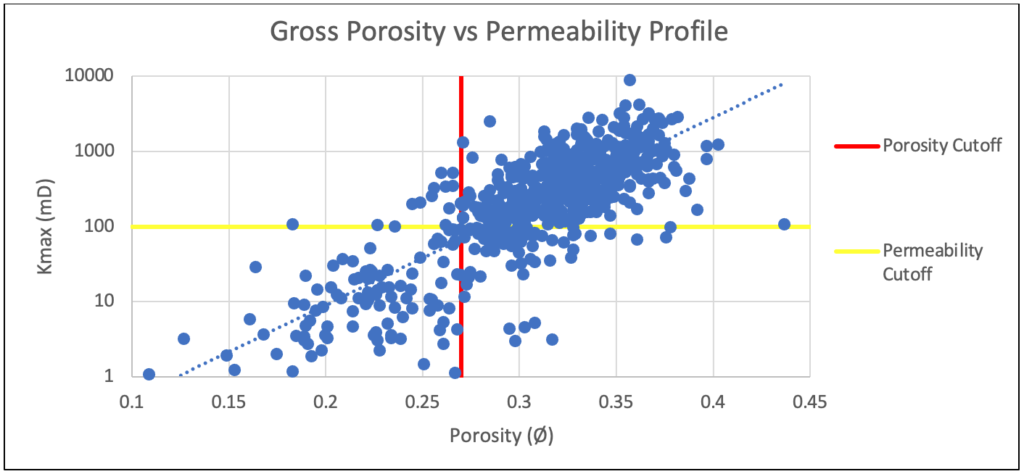
Porosity and Permeability
The average porosity of the pool was calculated based on the log interpretations of 4 wells within our pool. The average effective porosity of the pool was determined to be 32.8%. As no, core data was available for our pool, an analysis of the all the wells with available core data in the Lloydminster area within the same geological horizon were analyzed. This included wells in townships 45 and 46 with a range of 4, 5, or 6 in the fourth Meridian. The average permeability from the core data was determined to be 646 mD. The porosity and permeability cut-offs were determined as 27% and 100 mD respectively.
Relative Permeability
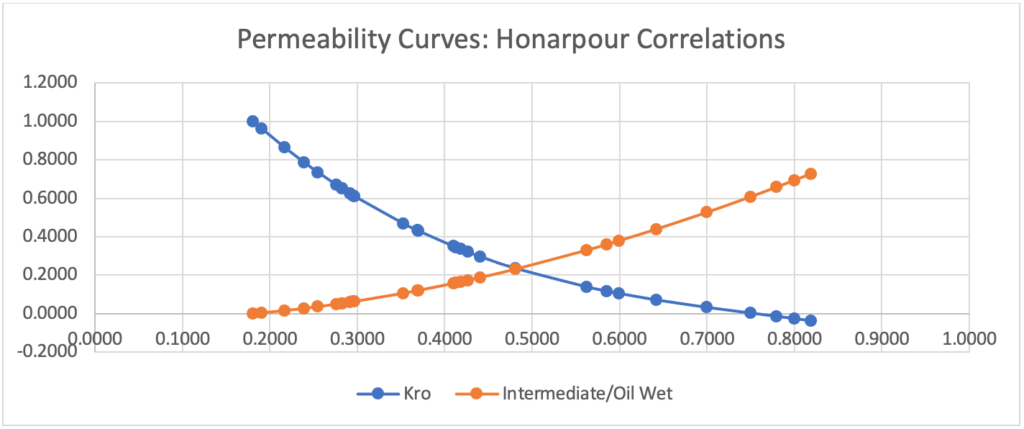
The permeability curves were developed using Honarpour correlations with the following inputs: water saturation of 18%, residual oil saturation to water of 25%, and a porosity of 32.8%. The Sorw value selected was from a correlation created by Stoian and Telford and is representative of heavy oil sands in Alberta. The Honarpour equation applies to Sandstone and Conglomerate Water-Oil Systems. Our reservoir was theorized to be intermediate/oil wet from the curves above. Correlations were used because there was no special core analysis data found. Theses curves were altered within the reservoir simulation during the history matching process.

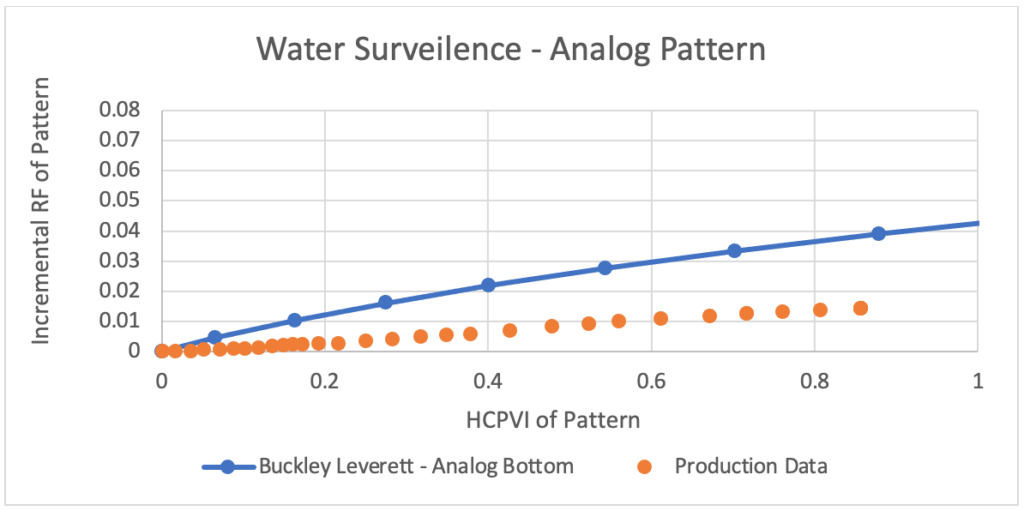
Water-flood Analysis
The producer – injector – producer 3 wells pattern currently existing in our pool was analyzed using the Buckley Leverett model. However, due to lack of data, the sweep efficiency could not be calculated. An analog pattern within the Lloyd formation in the Commingled pool was then analyzed to determine the sweep efficiency. Based on the production data, the sweep efficiency of 40% was determined.
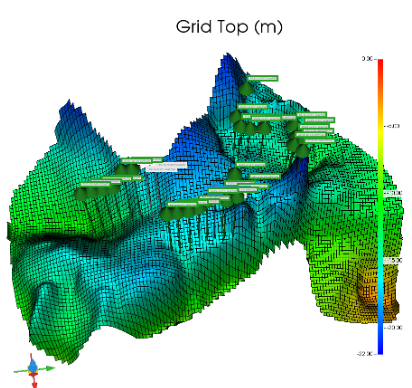
Reservoir Modelling
The reservoir model made within CMG was generated using data garnered from well logs, PVT analysis etc. Because we have a heavy oil reservoir the porosity and permeability were set at constant values throughout the entire reservoir. The map was developed using a net pay map and a structure map. Before the history matching was conducted a verification on the OOIP from the simulation was performed. The OOIP from our volumetric had a value of 10.4E6 m3 and the value from our simulation was at 10.1E6 m3. Because the values were close our reservoir was deemed to be successfully initialized and history matching was begun subsequently.
History Matching
The production plots in below show the comparison between the historical and simulated production rates for oil, water, and gas. The comparison between the historical and simulated oil rates shows a good match. However, the oil rate peaks slightly towards the end of 2020. The combined oil production from 100/02-30 and 103/02-30 results in this peak. The 103/02-30 well is located right above the injector and the 100/02-30 well is located directly below the injector. From this, it is concluded that the simulation over-estimates the oil rate in response to water injection.
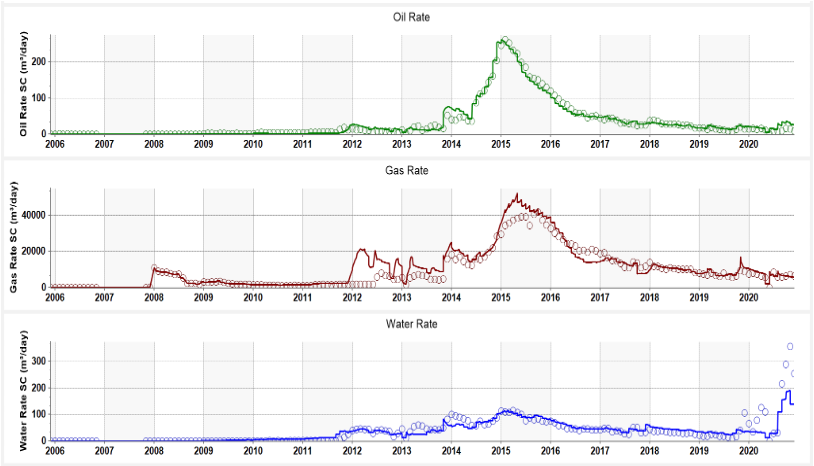
The simulated water rate near the end of the year 2020 is very low compared to the historical water production. The addition of an edge aquifer east of the 100/13-29 well is a potential strategy to match the water rate in later years of production. The early gas rate shows a perfect match. This is due to the addition of the artificial gas cap. However, there is a spike in the gas production in 2012 and around 2015. Since it was determined that the historical gas production data available for this field is not reliable, the focus of the history match was on obtaining a close match on the oil rate and water rate first. A field-wide match on the pressure is irrelevant in a heavy oil reservoir. Therefore, the match between the historical and simulated pressure readings cannot be effectively carried out.
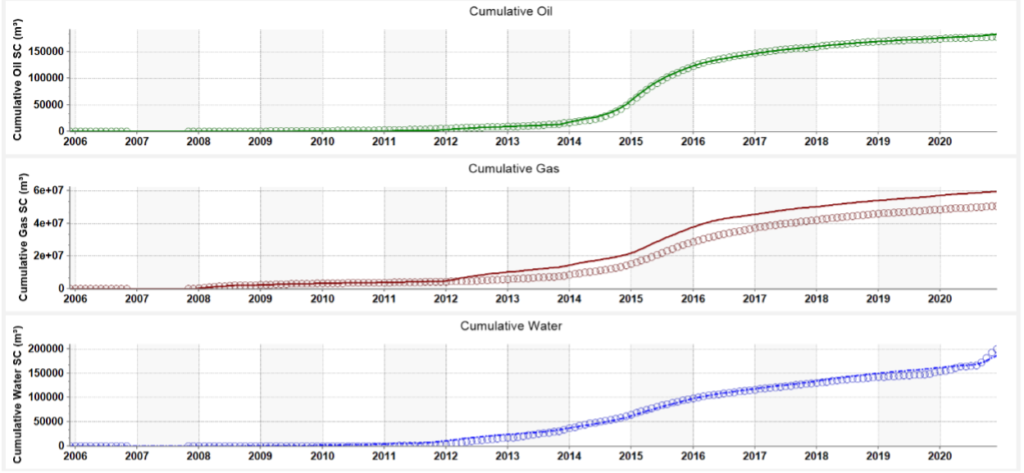
The figure below shows the comparison between the historical and simulated cumulative production for oil, gas, and water. The cumulative oil plot indicates correct material balance as there is almost an exact between the simulated and historical oil. The simulated and historical cumulative gas production shows the correct material balance between the model and historical gas production in the early years. However, in the later years (2014 and onwards) the cumulative gas production from the model is considerably higher than what is historically produced. The cumulative water plot indicates a correct material balance between the model and the historical water production as there is an almost exact match between the simulated and historical water.
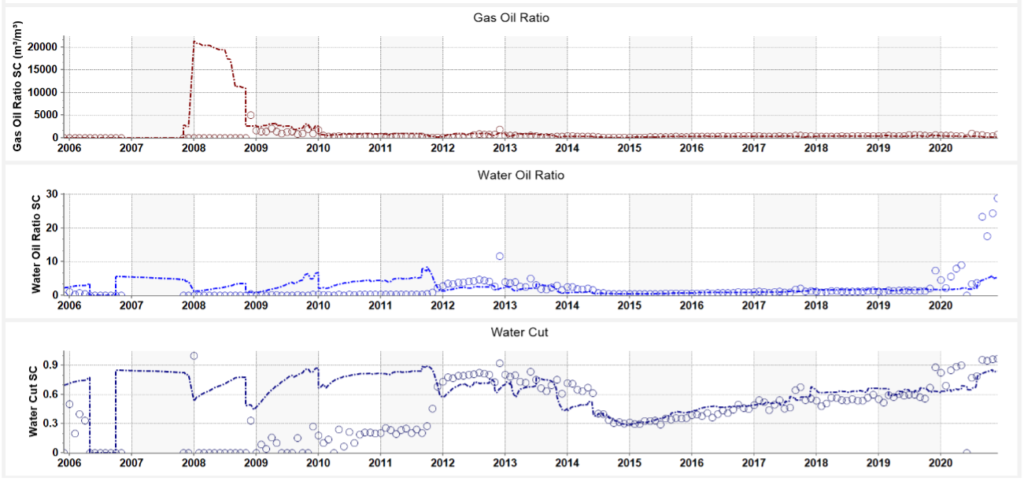
The plots in the figure below show the comparison between the historical and simulated gas-oil ratio, water-oil ratio, and water cut. The high simulated gas-oil ratio between 2008 and 2009 is attributed to the presence of a gas well. The simulated water-oil ratio and the simulated water cut is very high from 2006 to late 2011 as the oil production during this time period is almost negligible. Low simulated water production results in a very low simulated water-oil ratio in late 2020.
Development Strategy
Development Strategy 1: Water-flood
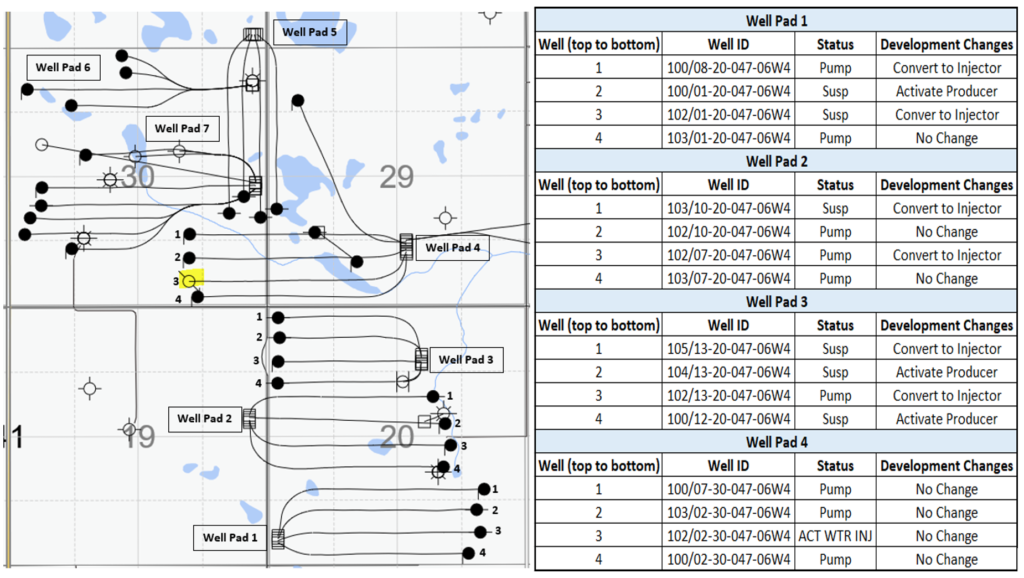
The development plan proposed consists of converting every other producer into an injector below the existing injector in the pool. The geology of the pool suggests high oil saturation in this part of the reservoir. The average net pay in this region of the pool is higher than the rest of the pool. The production data confirms that the wells within this region are most productive. 3 of the wells that are converted into injectors are currently suspended. This allows us to limit the loss of production from the pool. Suspended wells below the injector that were not converted to injectors were reactivated. This allows us to make up for the loss of production from 3 pumping wells that will also be converted. Based on the development changes to the pool, application of a water-flood was proposed. The development changes to the pool are shown below.
Development Strategy 2: Polymer-flood
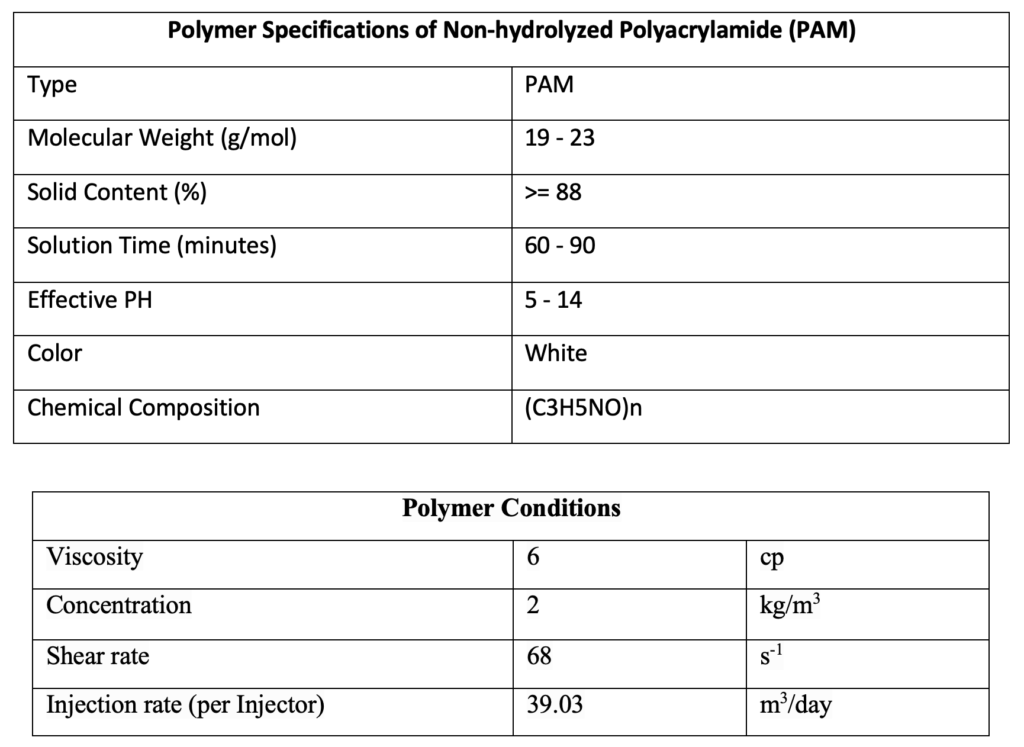
Based on the development changes to the pool, application of a polymer flood to increase the sweep efficiency of the reservoir was also proposed. With the high oil viscosity of our pool, an increased injected water viscosity was required. Once the injected water viscosity is increased, the contrast between mobility of water and oil is reduced. It was found that polymer flooding would provide a better oil recovery performance and reduce viscous fingering. Non-hydrolyzed Polyacrylamide (PAM) polymer was selected for the flooding process due to its relatively cheap price and good sustainability in water compared to other EOR polymers. Non-hydrolyzed polyacrylamide (PAM) is non-ionic and thus the effects of salinity of water can be neglected.
Forecasting
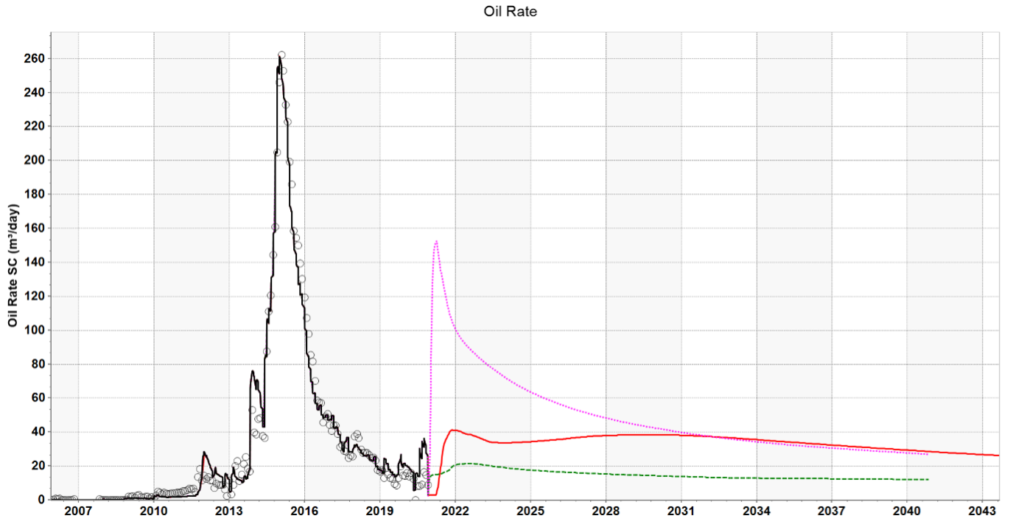
The production rates for the base case and the development strategies are forecasted up to 20 years as shown in the figure below. The resulting ultimate recovery factor from the simulation for the base case forecast is 2.79%, for the water-flooding development strategy it is 5.09%, and for the polymer development strategy it is 4.37%. However, as can be noted from the plot of oil rate plot below, the instantaneous increase in the oil rate at the time of injection is not realistic. Therefore, the results from the simulation for the water-flood development strategy are manually manipulated outside of the simulator to delay the water-flood response from two 2 month to 2 years. The resulting ultimate recovery factor from the manual delay in the water-flood response is 3.49%, which is more plausible. From this, it is concluded that the polymer flood results in the highest recovery factor. The economic analysis will be carried out to evaluate feasibility on the proposed development strategies.
Partners and mentors
Special thanks to the people who helped us with this project. Our petroleum engineering supervisor Dr. Harvey Yarranton, industry advisor Dr. Koorosh Asghari, and Mr. Blair Rogers from WestLake Energy.
Reservoir Owner

Group Academic Advisor

Dr. Harvey Yarranton
Department of Chemical
and Petroleum Engineering,
University of Calgary
Group Industry Advisor

Dr. Koorosh Asghari
Adjunct Professor at
University of Calgary