Petroleum Engineering
Join our presentation
About our project
Unlike conventional oil, heavy oil is extremely viscous, and its recovery requires changing the oil properties through heating to increase its mobility. Heavy oil reservoirs are typically shallow and have low seal pressures which cause the solution gases to leave the oil and increase the oil viscosity. A highly viscous oil cannot travel to the surface naturally or under pressure due to its physical properties. Therefore, thermal recovery methods are vital in the production of heavy oil.
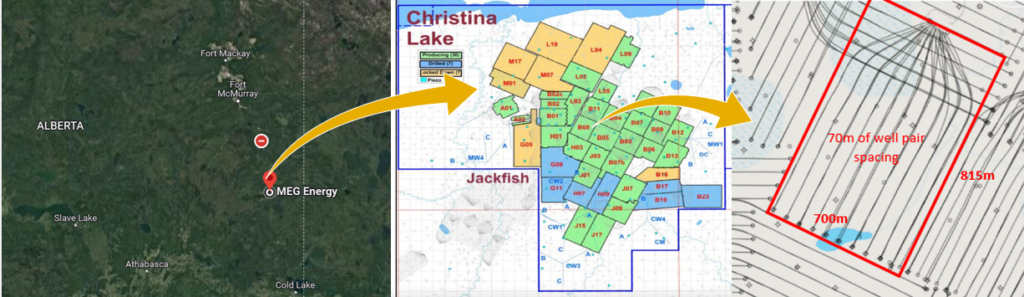
This project analyzes the performance of heavy oil production of Christina Lake project within the Athabasca Oil Sands region and suggests a development strategy towards production optimization. The Christina Lake project is located 120 km SE of Fort McMurray and operated by Cenovus Energy. Production in the area started in 2002 and now has a daily capacity of 310,000 bbl/day bitumen with a Sulphur content of 3.8%.
Meet our team members

Hannah D’Souza
Chemical Engineering with Petroleum Minor

Nada Zeineldin
Chemical Engineering with Petroleum Minor

Ramon Salazar
Chemical Engineering with Petroleum Minor

Akbar Ramzan
Chemical Engineering with Petroleum Minor

Bing Li
Oil and Gas Engineering

Nikolas Raymundo
Chemical Engineering with Petroleum Minor
GEOLOGY
Depositional History
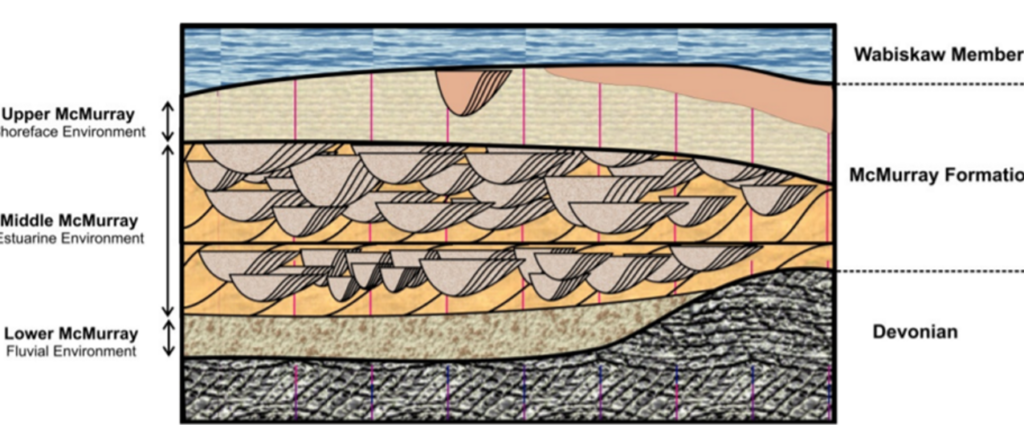
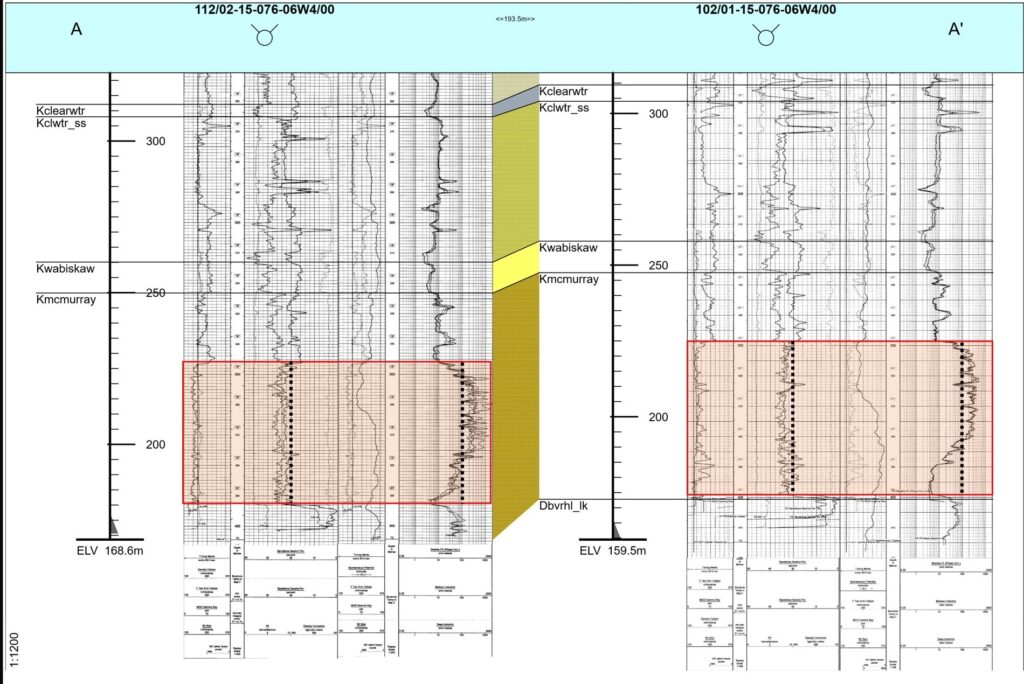
The McMurray formation is a stratigraphic unit in the western Canada sedimentary basin of the Early Cretaceous age which underlies the clearwater formation and overlies the Devonian formations.
The McMurray formation belongs to the Manville group which is subdivided into three subunits due to variation of the sediment deposit when it was first created. The formation itself is around 40 to 60m in thickness and came to be after the boreal sea level rose. In the lower McMurray formation, we have mostly bottom water and sand dominated fluvial environment, and then middle has more of a estuarine environment with smaller finning up cycles, while the upper unit mostly has a shore face environment to marine deposits. Our main focus is however the middle unit as it has the most clean sand that it’s very well saturated with bitumen.
Hydrocarbon Source
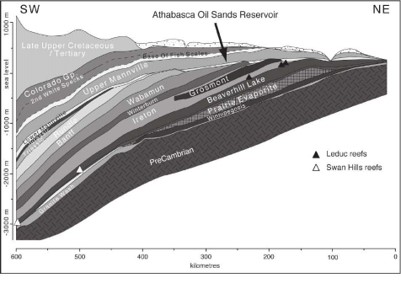
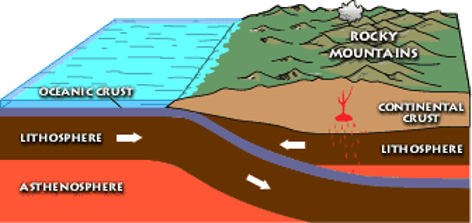
The oil sands that are in the McMurray formation are a result of the mountain building event that had created the Canadian Rockies. This event called Laramide Orgeny occurred around 80 million years ago when the pacific plate thrusted underneath the north American plate as it pushed in from the west.
As this occurred the sedimentary rock got buried underneath Alberta to large depths converting the kerogen in the organic rich shales to light oil and natural gas. The identification for the source rock is controversial but it’s characteristics is closely related to the Exshaw Formation. The oil had also migrated up dip from west to east following a pre-cretaceous unconformity that exists in the formations under Alberta. As it the oil approached the surface it underwent microbial biodegraded which caused the oil to become highly viscous and immobile.
Trapping Mechanism
The main trapping mechanism however is not a typically stratigraphic trap or structural trap as the bitumen is immobile due to it’s high viscosity. However the Wabiskaw shale that lies above the McMurray formation also acts as a seal over the hydrocarbons.
POOL HISTORY
Reservoir Characterization
Porosity & Permeability
Core data is the only direct measurement of the reservoir. Along with logs, core data is used to analyze and infer certain information such as porosity, permeability, lithology (sometimes), oil/gas/water zones, and more.
Using core analysis and logs for Fort McMurray formation, the reservoir properties are as follows:
Porosity – 0.34
Permeability – 4017 mD
Oil Saturation – 0.777
Viscosity
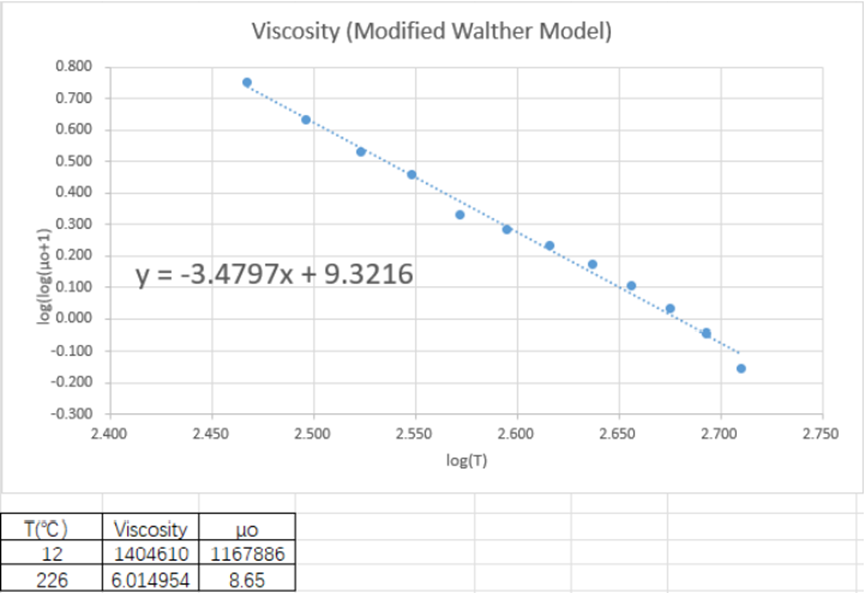
The viscosity from the modified Walther model shows that oil viscosity and temperature are close to a linear relationship on a log scale. At initial reservoir conditions, 12°C, the viscosity is found to be 1167886 mPa*s and at steam reservoir condition, 226℃, the viscosity is found to be 8.65 mPa*s.
Relative Perm
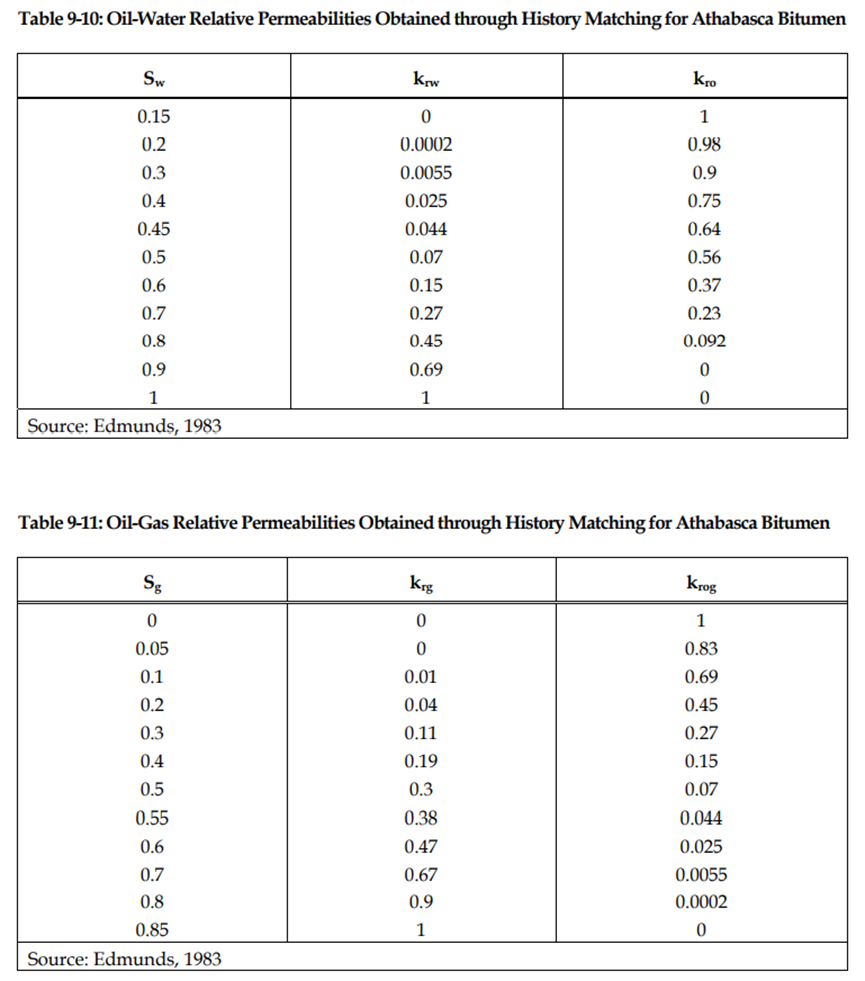
Relative permeability of rock is used to predict the flow of each fluid phase, displacement efficiency and expected recoverable reserves. A relationship graph of relative permeability and water saturation were created using data from the following tables
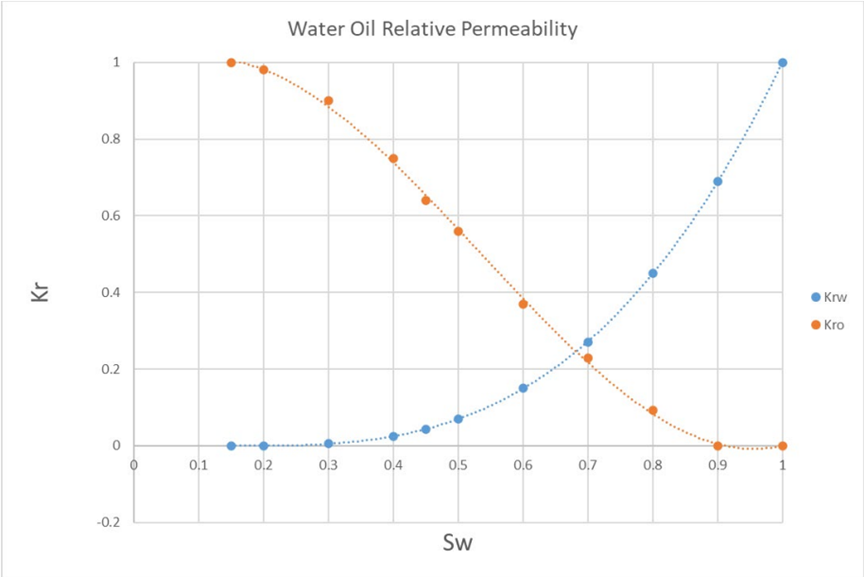
Using the graph above, irreducible water saturation is 0.15. The relationship of relative permeability and water saturation can help to decide the rock type of the reservoir. Cross point is above 50% indicates that the water-oil system is water-wet rock.
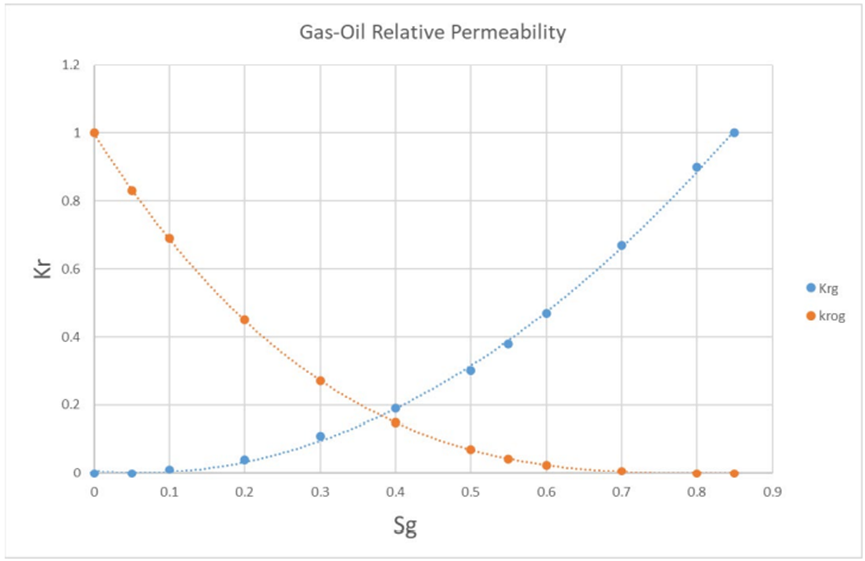
Cross point for gas-oil system is below 50%, which indicates that the rock type is oil-wet.
Historical Data
Historical Production & Injection Data
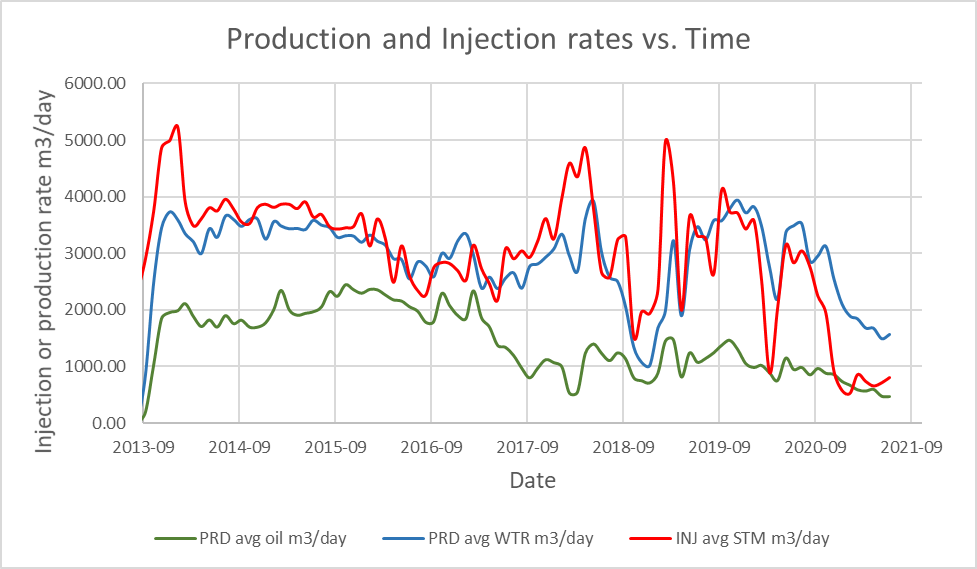
There are 10 pairs of horizontal producer and injector wells actively operating on pad B08. Steam injection through the producer and injector wells started in September 2013 to allow for the steam circulation. Steam circulation is important to achieve communication between the producer and injector wells. Pad B08 was injected with high flowrates of steam up to 5250 m3/day during the steam circulation days to speed up the start-up process which took 90 days. The average daily rate of produced oil is 1460 m3/day and the peak oil production rate is at 2346 m3/day in March 2015. The water production curve follows the same trend as the steam injection curve except that the water is produced at a lower rate which suggests that difference is condensed water left behind in the reservoir.
Pressure History
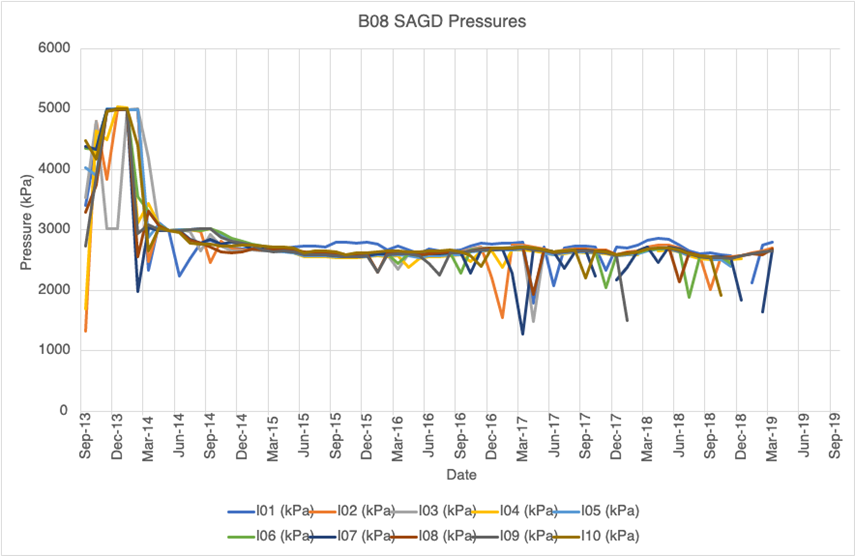
The pool was initially pressurized with saturated steam at 5000kPa and 264°C during the first 90 days of steam circulation to speed up the start-up process. After the circulation days, the pressure was artificially maintained at an average pressure of 2600 kPa which corresponds to a saturated temperature 226°C.
Steam to Oil Ratio
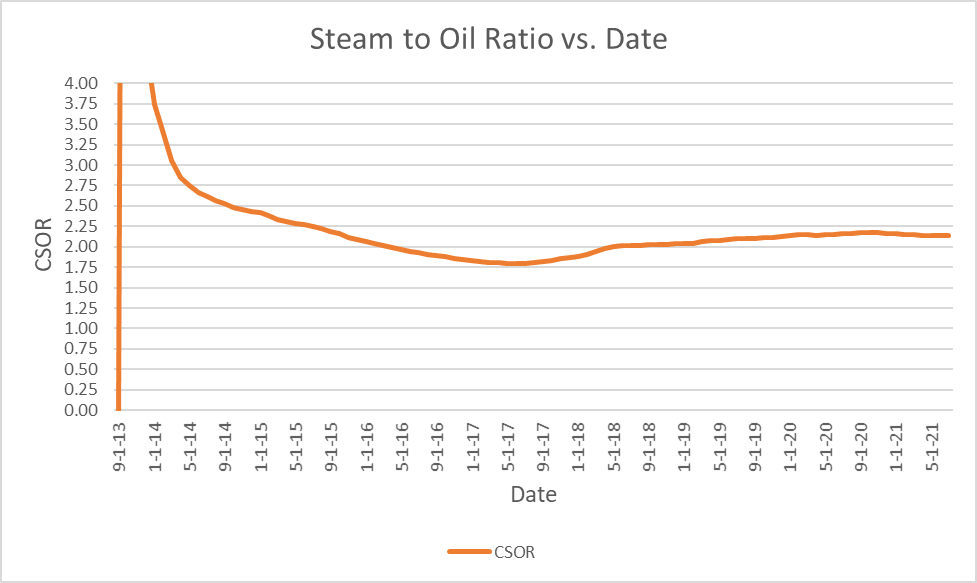
The production on pad B08 has a cumulative steam injection of 8.68E6 m3 and 4.07E6 m3 of produced oil resulting in 2.30 steam to oil ratio (SOR). The steam to oil ratio is an indicator of the SAGD operation performance. The higher the SOR ratio, the higher the costs of the steam injections. Pad B08 has been maintaining an average SOR of 2.00 which typifies a very efficient production performance.
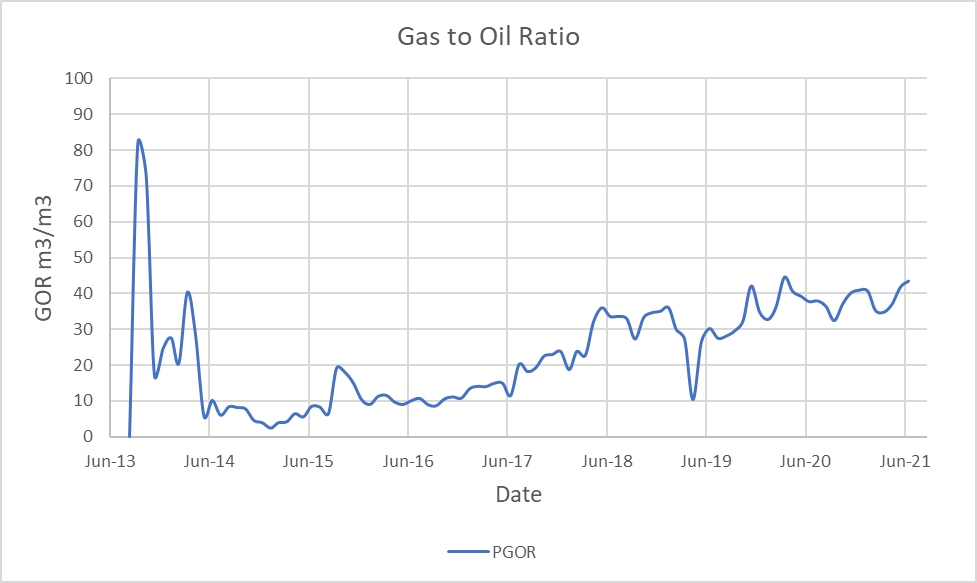
Gas to Oil Ratio
GOR is the ratio of the produced gas to the produced oil. The GOR is sensitive to the gas behavior in the reservoir gas and is related to steam injected into the reservoir. The gas volume in pad B08 is considered low resulting in minor influence on the oil viscosity. The GOR was at its highest with a value of 85 m3gas/m3oil due to well operations specific to start up and the small size of the steam chamber. As the steam chamber size progresses and the oil production continues, the gas liberates form the oil causing a gradual increase in the GOR reaching a GOR of 43 m3gas/m3oil recently.
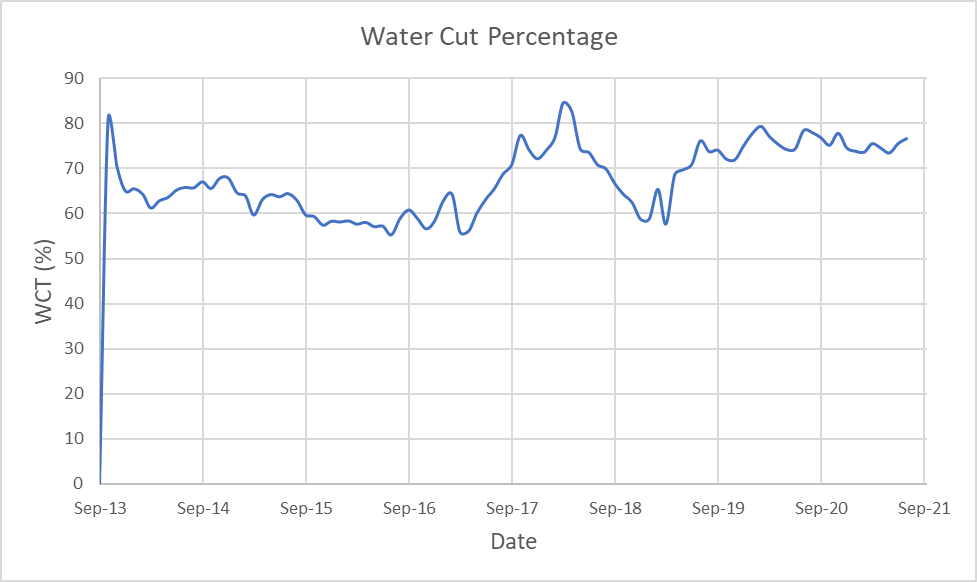
Water Cut %
Pad B08 production has a WCT ranging from 62% to 67%. The highest WCT percentage are seen during times of low oil rates which are related to the producer well failures.
Pad OOIP
The original oil in place (OOIP) is calculated using the volumetric method. The pad dimensions were estimated using geoSCOUT measuring tool whereas the gross oil pay, average porosity and initial oil saturation were obtained from logs. The volumetric method accounts for the oil expansion, however; because there is little solution gas in the pool, it is not expected to have a high oil expansion factor. The Standing correlation was used to calculate for the expansion factor. The resulting OOIP is 5.11E6m3 oil which is half a million lower than the reported value by Cenovus.
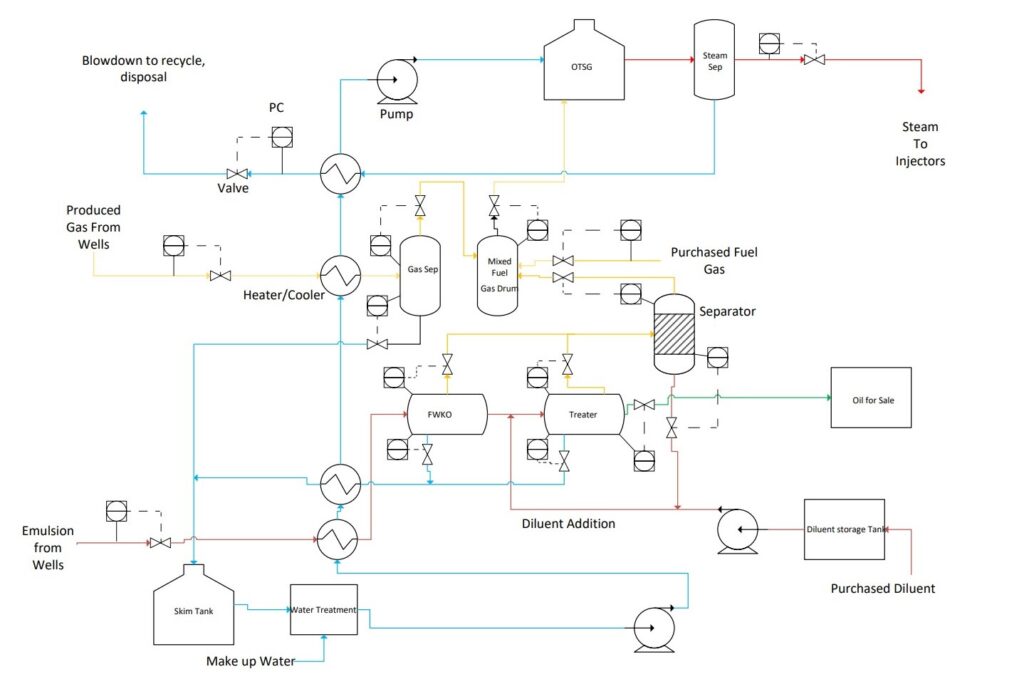
OUR FACILITIES
Our Central Processing Facility (CPF) takes in the water-bitumen emulsion from the producing wells and outputs quality diluted bitumen (dilbit) and high-pressure steam. Streams entering the CPF include produced emulsion, which is a mixture of steam condensate and bitumen, saline water, sand, and other reservoir minerals. Natural Gas is separated using pumps at the wells and come in a different stream. Exiting streams include dilbit, high pressure steam, flue gas exhausts from boilers and heaters and other solid and liquid wastes from water and bitumen treatment.
Oil-water (Emulsion) separation and oil treatment involves the separation of bitumen and water. This process includes two stages which are Free-Water Knock-Out (FWKO) and Oil treatment. The hot emulsion from FWKO is fed to the Oil treater with addition of a diluent to decrease the density of the diluted bitumen. One of the exit streams include clean oil which is sent to storage and another stream of oily water (produced water) which is then sent for water treatment. In this process, water is first de-oiled and then sent for softening. The hardness and silica of produced water is removed by flocculation and acid softening to achieve the quality of water required for steam generation. The quality of boiler feedwater is crucial for steam generation. Hardness less than 0.2 ppm, silica less than 40 ppm, and TDS less than 350 ppm are ideal conditions for boiler feedwater. In this process, a Once Through Steam Generators (OTSG) is used at 10 MPa which produces ~80% quality steam. The produced steam is then sent to a steam separator to produce 100% quality dry steam which is then injected back into the SAGD process. This is how the water used in SAGD is recycled back into the process.
SIMULATION
History Matching
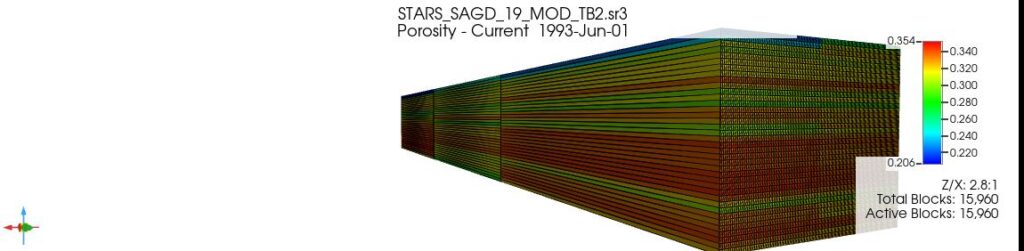
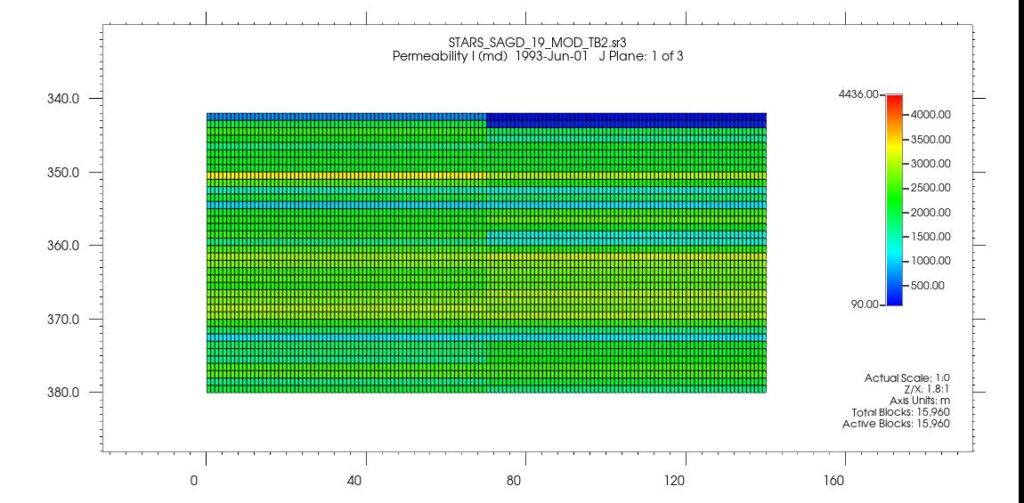
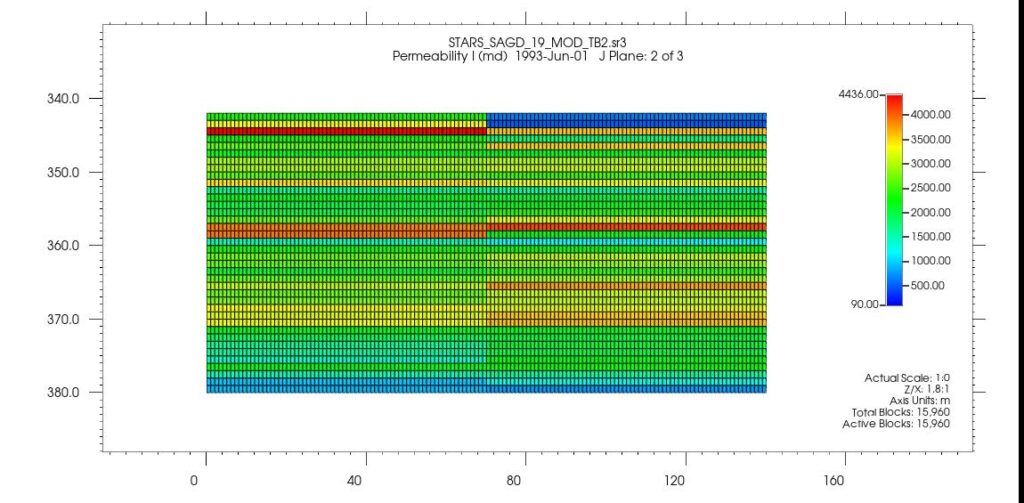
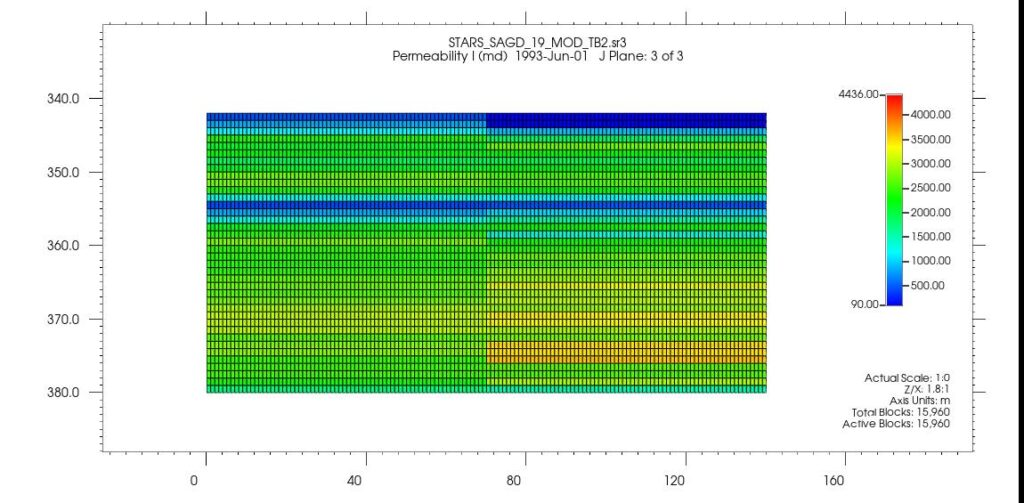
Pad B08 has history of all producer wells failure, therefore; the production and injection performance of each well pair was initially investigated to determine the two well pairs with the least operational upsets for modelling. In this case, well pairs 1 and 3 were chosen and later scaled up to the total pad size. SAGD operates on thermal energy obtained from steam, therefore; the CMG STARS simulator was used. The model grid system consists of three 267m blocks in the j-direction, 140 one meter blocks in the i-direction and 38m of pay thickness in the k-direction. A 5m vertical distance between the producer and injector wells was set. Data specific to well pairs 1 and 3 which includes porosity and permeability were obtained from logs of the surrounding vertical wells and core data of wells in the McMurray formation.
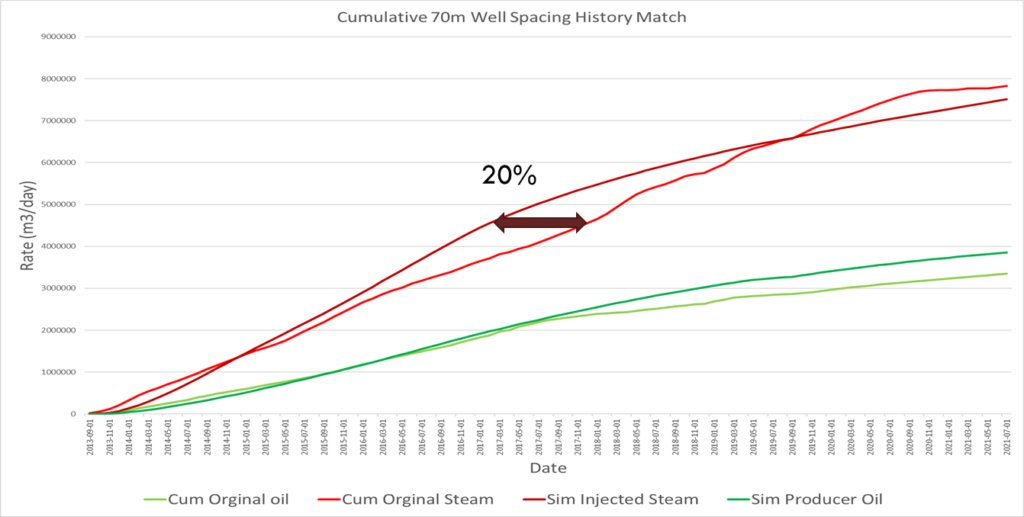
Once the simulation was initialized, we began history matching our model to the data provided by Cenovus energy. Four main changes were made to model which included changing the permeability, pseudo start-up, steam quality and including a shut-in period. The following images showcase the production and injection rates of the theoretical model compared to the history match.
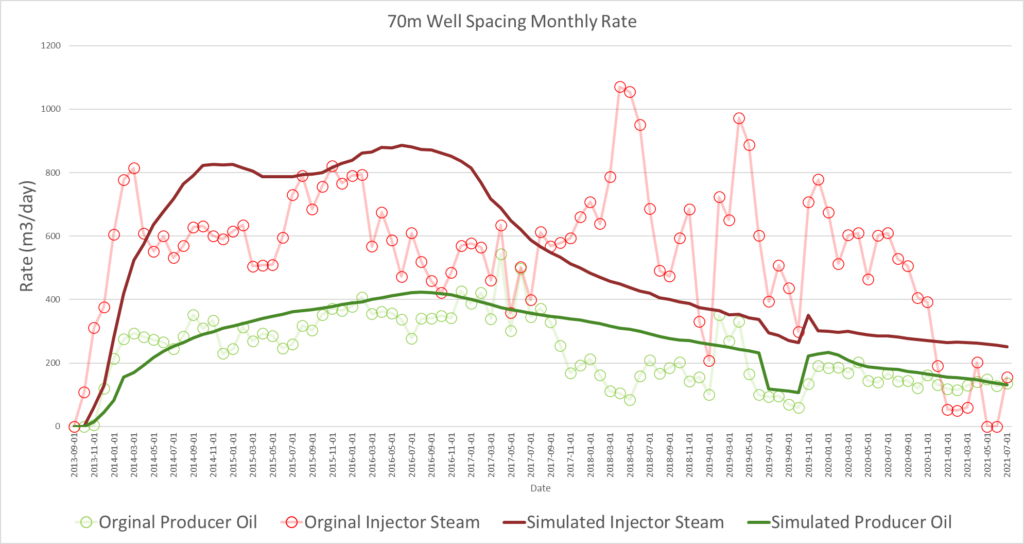
However, the simulation steam injection curve deviates after 2017 compared to history matching data. This could be due to well failures and redrills that was experienced at Pad B08 during that time which was not included in our simulation. However, when plotting the cumulative graph, the difference in steam injection is off by only 20%.
Model Porosity Profile
Model Permeability Profile
OUR PROPOSAL
Development Strategy
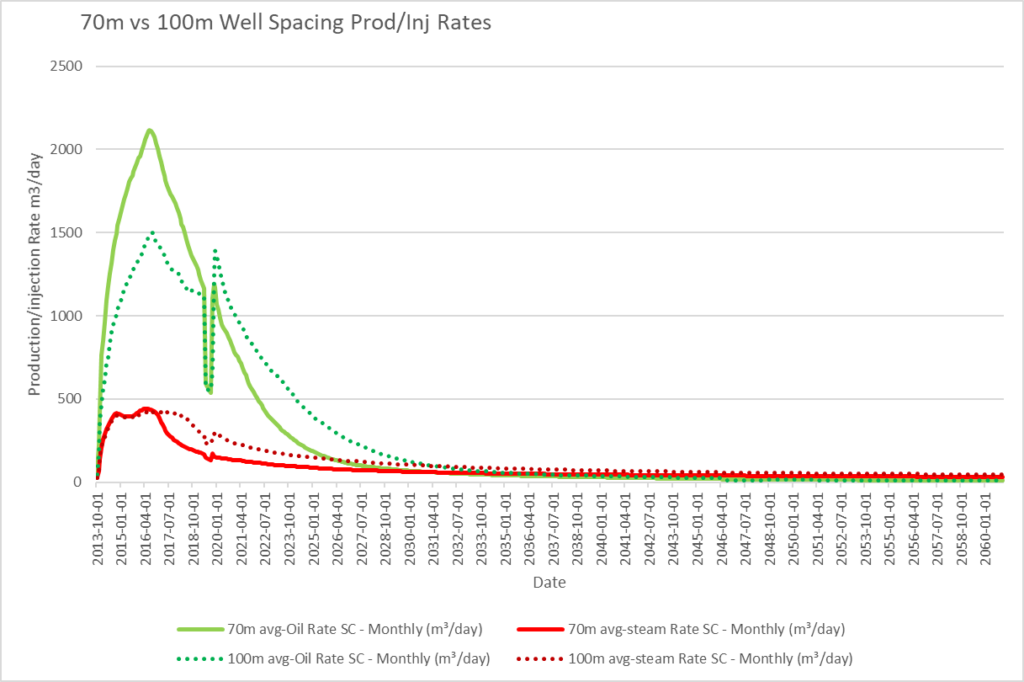
An alternative development strategy is having 100m well spacing compared to the original 70m spacing. This would require only 7 total well pairs instead of 10 while still utilizing the same dimensions of the original well pad.
When comparing the production and injection rates the 100m well Spacing has a slower production decline after 2019 resulting in a longer production lifetime.
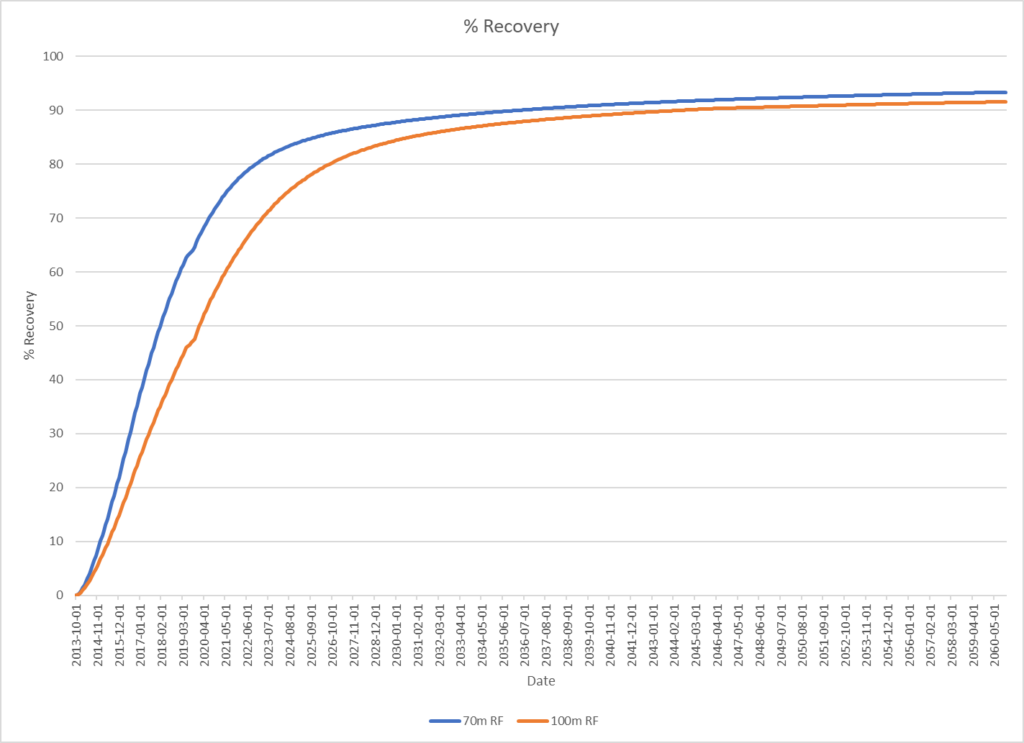
When comparing the steam chamber growth between both scenarios, the 70m well spacing has communication earlier than 100m. Having an earlier communication indicates a higher oil production from the 70m spacing.
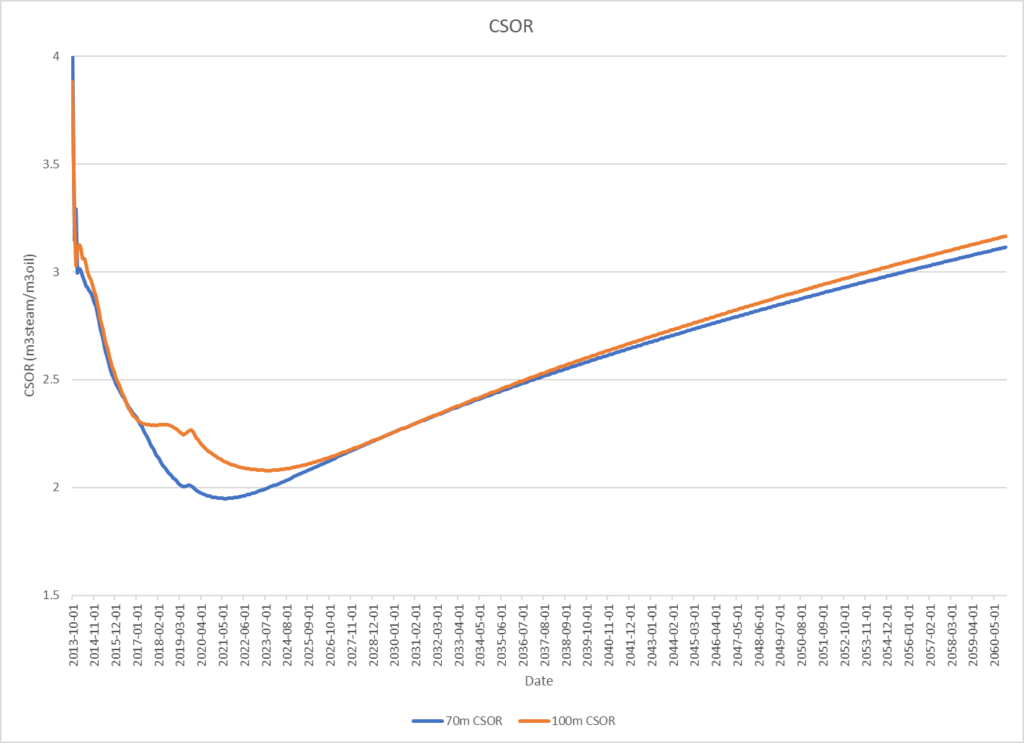
CSOR
Recovery
Economics
An economic analysis was performed on both of the proposed expansion strategies:
Scenario 1: 10 well pairs with 70m well spacing
Scenario 2: 7 well pairs with 100m well spacing
| Scenario 1 | Scenario 2 | |
| CAPEX | 211 million CAD | 141 million CAD |
| OPEX | 46 million CAD / yr | 46 million CAD / yr |
| Abandonment Date (when oil PRD = 10 m3/day) | December 2060 | October 2055 |
| Discount Rate | 10% | 10% |
| NPV | 126 million CAD | 214 million CAD |
| PayOut | 20 months | 14 months |
| IRR | 37.14% | 56.38% |
| PIR | 1.6 | 2.27 |
| Avg. Fuel Costs | 190 CAD / day | 204 CAD / day |
| Avg. Carbon Taxes | 6,522 CAD / day | 6,983 CAD / day |
The CAPEX was determined based on an industry standard value of 20,000 CAD/bbl of capacity, adjusted for the Average Stream Day Capacity of each of the 2 proposed strategies. A total OPEX of 46 million CAD / year was calculated by adjusting SAGD literature values to the conditions of our BO8 pad and is the same for either one of the plans.
Both scenarios proved to be lucrative and have comparable Fuel Costs and Carbon Tax Costs, however Scenario 2 is the most profitable with an NPV of 214 million CAD, 70% higher than that of Scenario 1. The IRR is a measure of economic stability. The fact that Scenario 2 has the higher NPV and PIR as well as the higher IRR gives further certainty to the assessment that Scenario 2 is more profitable.
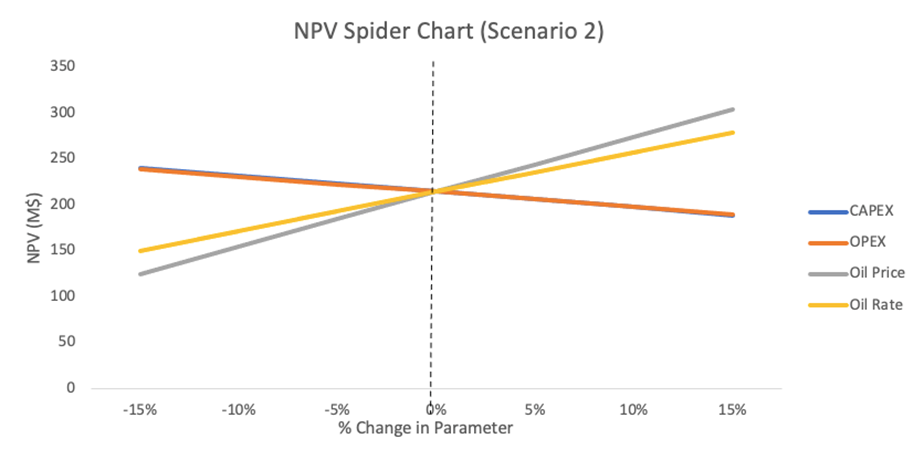
Sensitivity Analysis
Sensitivity analyses were also performed on the NPVs, from which we gather that the Oil Prices have the biggest impact on the economics of the project whereas the OPEX and CAPEX are tied for the smallest impact.
Drilling and Completions
Drilling
In SAGD wells the casing experiences changing thermal states over the life of the well. Ranging tools are a specialized class of directional drilling tools that provide distance to a nearby well. They are used for SAGD operations to drill parallel well pairs.
Three casings (surface casing, intermediate casing, and slotted liner) will be laid out. The selection of the casing material will take into consideration the operating environment conditions as well as well as the maximum amount of weight the rig is designed to hoist. J 055 is picked up for surface casing and L 80-1 is chosen for the other two. Another important consideration of the casing is the slots. With well designed slots on casing, the production and injection capacity could be maximized without compromising the mechanical integrity nor the sand control. Practically, this means optimizing the slot size and leaving enough space between each slot and between rows of slots.
Completions
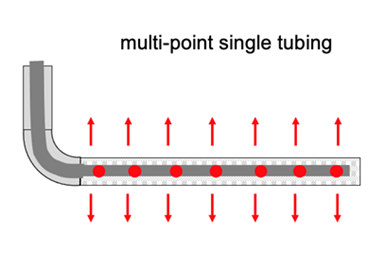
For this project, we have decided to use the multi-point steam injection method to minimize the possibility of forming a pressure gradient across the well.
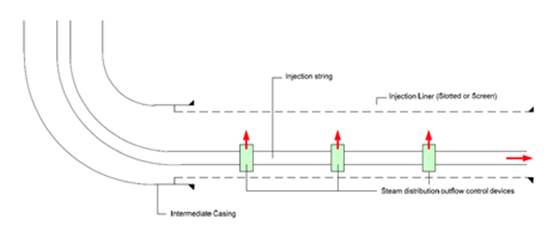
Inflow control devices are well completion technologies deployed along the length of the well-aimed at distributing the inflow evenly along the length of the well. ICDs usually consist of a choke, orifice, or valve that restricts flow and create additional pressure drop across the device to balance or equalize well bore pressure drop to create a more evenly distributed flow profile along the horizontal well. Each ICD can be designed (by adjusting the choke diameter) so that the inflow profile along the well is defined leading to a more uniform flow profile along the well. In this process, the simplest method, which is using pre-configured orifices to control steam flow was used. It is also one of the most economically feasible methods in the industry as it saves costs of using FCDs, which are more advanced methods.
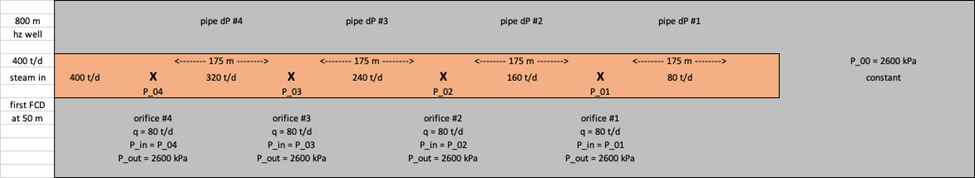
The total steam flowrate of this well-pad consisting of 10 well-pairs is 4000 t/d and for one well-pair, a steam flowrate of 400 t/d is used and distributed evenly among 5 orifices along an 800-meter horizontal well. The steam flowrate from each orifice is kept constant at 80 t/d and for this, each orifice has a slightly different diameter. For example, the very first orifice is kept the smallest to ensure that only 80 t/d was exiting it. The remaining steam is sent to orifice 2 which is slightly bigger than the first to allow 80 t/d of steam to flow through it. Similarly, orifice 3 is kept slightly bigger and orifice 4 is allowed to be the biggest for the remaining steam to flow through it.
To calculate the pressure-drop, Unwin’s Formula was used with values from steam tables, an initial pressure of 2600 kPa, a spacing between each orifice is kept as 175 meters and the diameter was calculated using a trial-and-error method.
IDEAS FOR INNOVATION
Drilling and Completions
In this project, the simplest method of steam distribution was employed. However, with advancements in technology, new and improved methods have been introduced. These methods include the usage of remotely controlled FCD’s. These FCD’s can be installed in the tubing’s and liners and can be used to control the flow of steam in the injector wells and flow of produced oil and gas in the producer wells. A good example is running Distributed Temperature Sensors (DTS) lines through the tubing connecting the FCD’s. The steam injected through each FCD flows to its associated interval. With this, operators at surface are able to choose steam injection in one or more specific well intervals, based on the temperature, pressure, and performance data to enhance steam conformance along the length of the well. In this way, steam injection into each well interval can be customized in a continuous and variable manner. This gives a higher control over steam injection. This can also help in identifying faulty injection points and prevent wastage of steam by avoiding those points. These devices have been tested at the Shell Orion SAGD field and have shown promising results. The results from the field tests demonstrate that a 20 to 40 percent reduction on cSOR and a 5 to 10 percent increase in oil recovery can be achieved by using these devices.
Environmental Impact
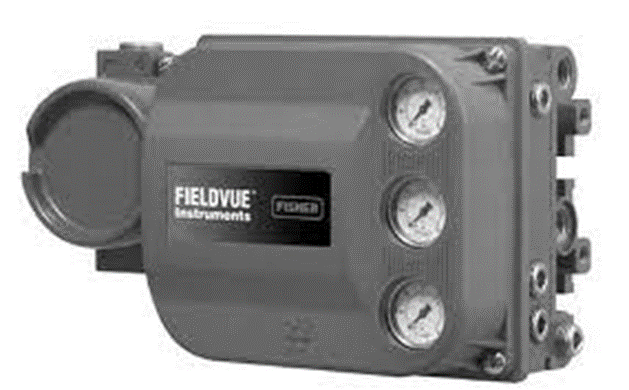
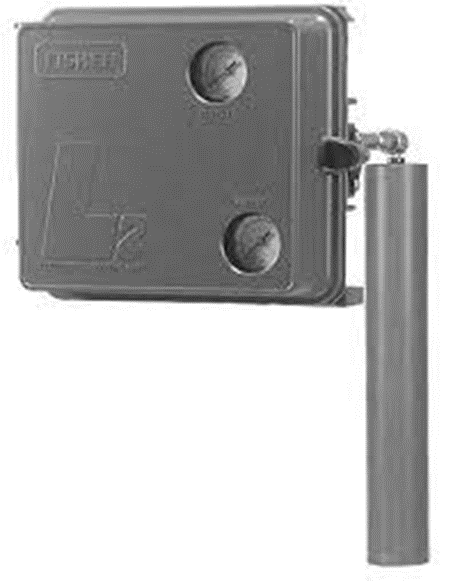
According to an environmental perspective, using low bleed (low emission) FCD’s can also help in reducing Greenhouse Gas (GHG) emissions. Usage of standard FCD’s such as pressure controllers, level controllers, transducers, and positioners contribute to higher GHG emissions whereas new and improved low bleed models can help bring these emissions down by almost 80 percent. For example, a standard Fisher 4150 pressure controller emits around 42 standard cubic feet of gas whereas, the low bleed Fisher C1 brings that number down to 6.5 standard cubic feet. The government encourages the application of these devices and for this purpose, the Government has introduced incentives such as the Carbon Offset program which allows producers to make money by reducing their emissions. Using these devices will not only help reduce our emissions, but also help in generating offsets that can bring the carbon tax down. Some examples of low bleed devices are shown below:

FAQs
HOW OUR DESIGN ADDRESSES PRACTICAL ISSUES?
With the increase in energy demand and renewables unable to keep up with that demand, the need to produce more oil and gas has given rise to looking into innovative ways of doing so. Some of the major issues involved in SAGD processes are environmental impacts such as methane emissions, usage of water for steam production and injection, and land destruction. Our solution addresses these issues by optimizing production while recycling almost 90% of the water, emissions are kept under limits by using low bleed devices, and 2% of the total project cost is also set aside for land reclamation purposes.
WHAT MAKES OUR DESIGN INNOVATIVE?
The usage of ICDs and FCDs for steam injection and bitumen production makes our design innovative by giving a better control over the flow rates of steam and bitumen. Also, using new and improved FCDs also help in addressing environmental concerns such as reducing GHG emissions, helping us meet Government Regulations while optimizing our production.
WHAT MAKES OUR DESIGN SOLUTION EFFECTIVE?
What makes our design solution effective is that the 7 wells with 100-meter spacing have a slower decline in production compared to the 10 wells with 70-meter well spacing. The 10 wells with 70-meter well-spacing also has a faster depleting rate which means that we are producing faster and will run out faster as well. Hence, our solution gives us a stable production rate for a longer period of time making it the most effective.
FEASIBILITY OF OUR DESIGN SOLUTION?
Our proposed solution is feasible both economically and environmentally. Environmentally, since we are employing low bleed FCDs, emissions from our site are reduced. This helps keep carbon emissions well below limits designated by the Government and regulated by the AER. Economically, our proposed solution of 7 well-pairs with 100-meter spacings shows an NPV that is 70% higher than that of 10 well-pairs with 70-meter spacings.
Aknowledgements
We want to thank our mentors for their guidance throughout the development of this project. Thank you especially to Mr. Boyle, Dr. Chen, and Dr. Yarranton for their constant advice, support, and academic perspective.

Tim Boyle
Industry Advisor
University of Calgary
Dr. Nancy Chen
Chemical and Petroleum Engineering Professor
University of Calgary

Dr. Harvey Yarranton
Chemical and Petroleum Engineering Professor
University of Calgary
