Project Category: Petroleum Engineering
Meet The Team

Madushi Chooramun
Bachelor of Science in Petroleum Engineering

Ziryan Seddek
Bachelor of Science in Petroleum Engineering

Jesse Hunjan
Bachelor of Science in Chemical Engineering

Fady Sobhy
Bachelor of Science in Chemical Engineering
About the Rainbow Keg River “B” Pool
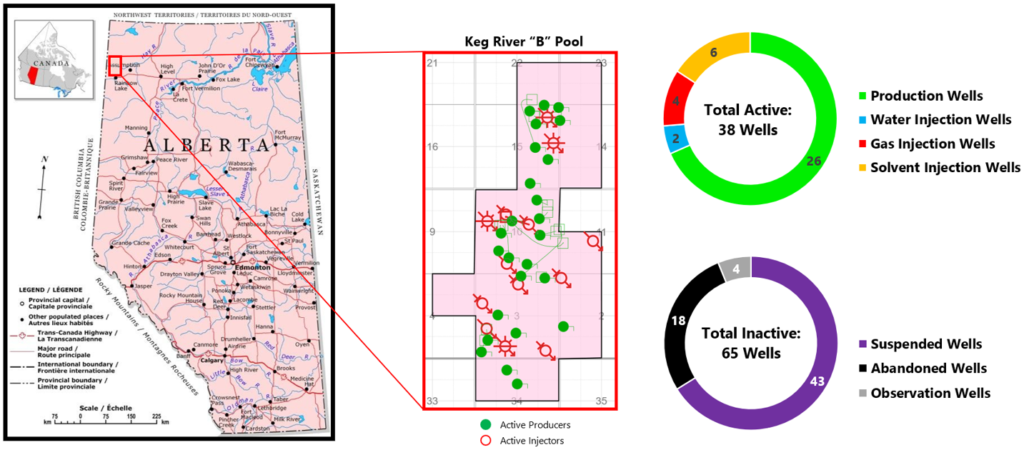
The Rainbow Keg River “B” Pool is a double-dome shaped reservoir found in Northern Alberta, near Grand Prairie. It has recently been acquired by Cenovus Energy from the original owner – Husky Energy. This carbonate reef formation produces light crude oil that is easily transported via pipelines to refineries, primarily in Edmonton, and is famously known as one of the pioneer locations for horizontal well drilling and development. The Keg River “B” Pool is an extremely challenging play to characterize, simulate, and develop. This challenge can be attributed to 55 years of production history, 103 total wells, and 3 distinct recovery schemes.
Pool Background
Geology
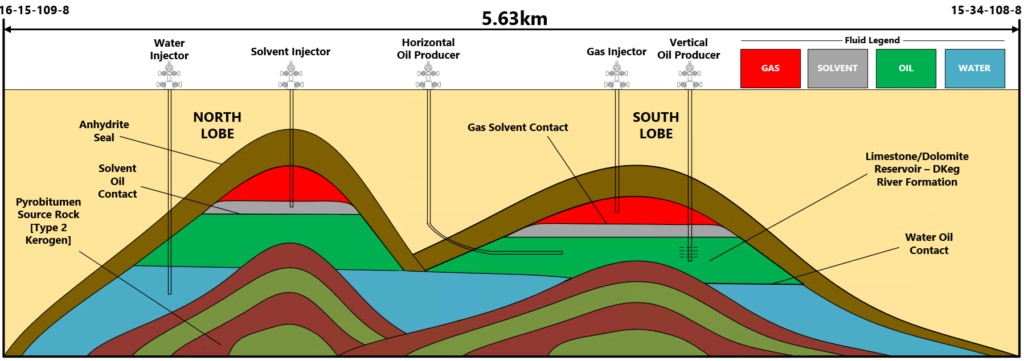
The Keg River “B” Pool exhibits a distinct double anticline petroleum trap – or double dome. The main producing formation is the DKeg river formation, which when coupled with the anhydrite seal rock, creates the trapping mechanism of the total petroleum system. Conductivity between the two traps is possible at large sub-surface depths. A strong source rock, comprising of pyrobitumen generated from type 2 kerogen, is responsible for the generation of light crude oil. This crude oil has migrated to the porous and permeable DKeg river formation, where it has accumulated within the formation, closed off by the double anticline petroleum trap. The reservoir is an unpredictable mixture of limestone and dolomite rock and consists of heterogeneous vugular porosity and directional permeability. Various recovery processes have been implemented throughout the history of our pool: water injection, miscible solvent injection, and immiscible gas injection, listed in order of occurrence. The figure above illustrates a detailed geological cross-section of the Keg River “B” Pool. The dimensional location of this cross-section is indicated by the townships listed on top corners of the figure. Further information regarding the various recovery processes is presented under the Production & Injection History section.
Petrophysics
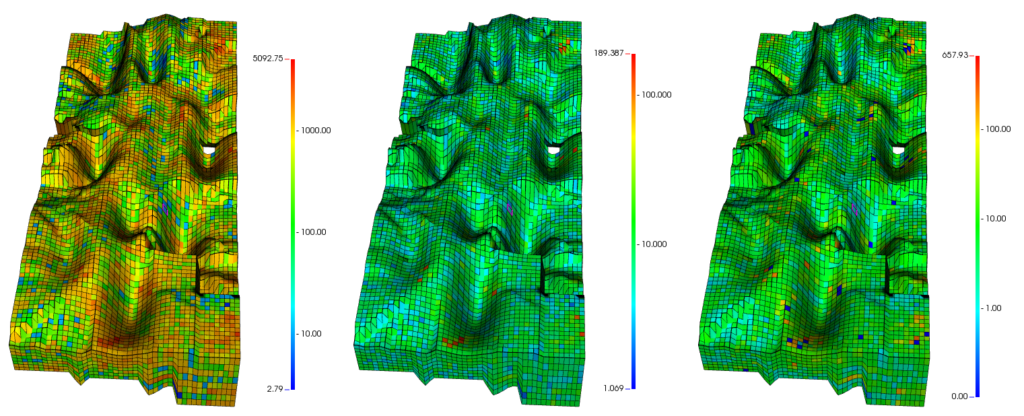
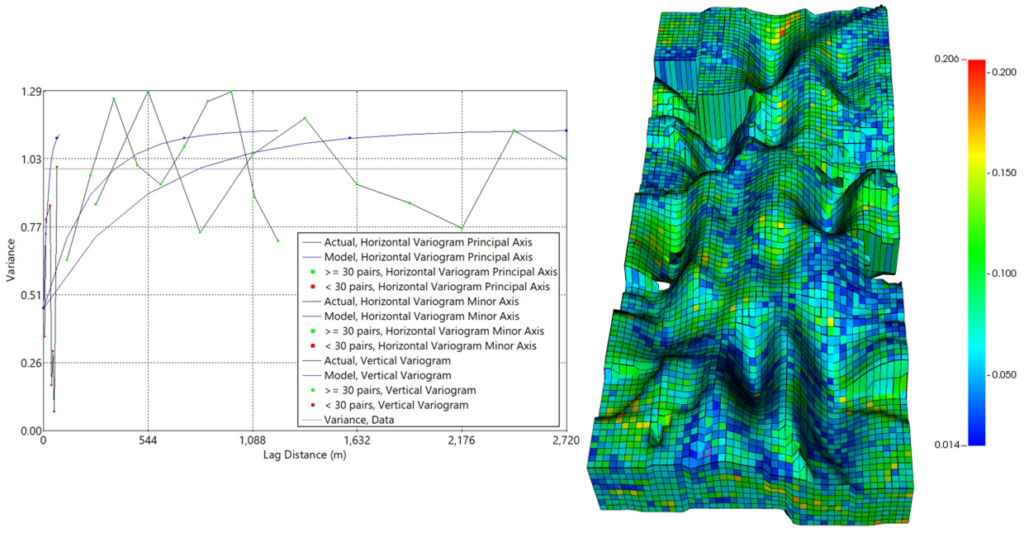
Carbonate reservoirs can be difficult to characterize in terms of petrophysics, largely due to high heterogeneity. Using a combination of log and core analyses of digitized wireline data (LAS files), a geostatistical simulation was performed to generate accurate models of porosity and directional permeability. A combination of bi-directional Gaussian and Spherical simulations were used to populate a reservoir grid with these important petrophysical parameters. A strong understanding of the Keg River “B” Pool’s directional permeability has enabled us to accurately simulate and forecast production. An accurate porosity model has led to successful initialization in terms of the Keg River “B” Pool’s original oil in place (OOIP). This precise initialization is displayed in the figure below, which compares the simulation determined OOIP to previously calculated values using material balance and volumetrics techniques.

Petrophysics Figures
Production & Injection History
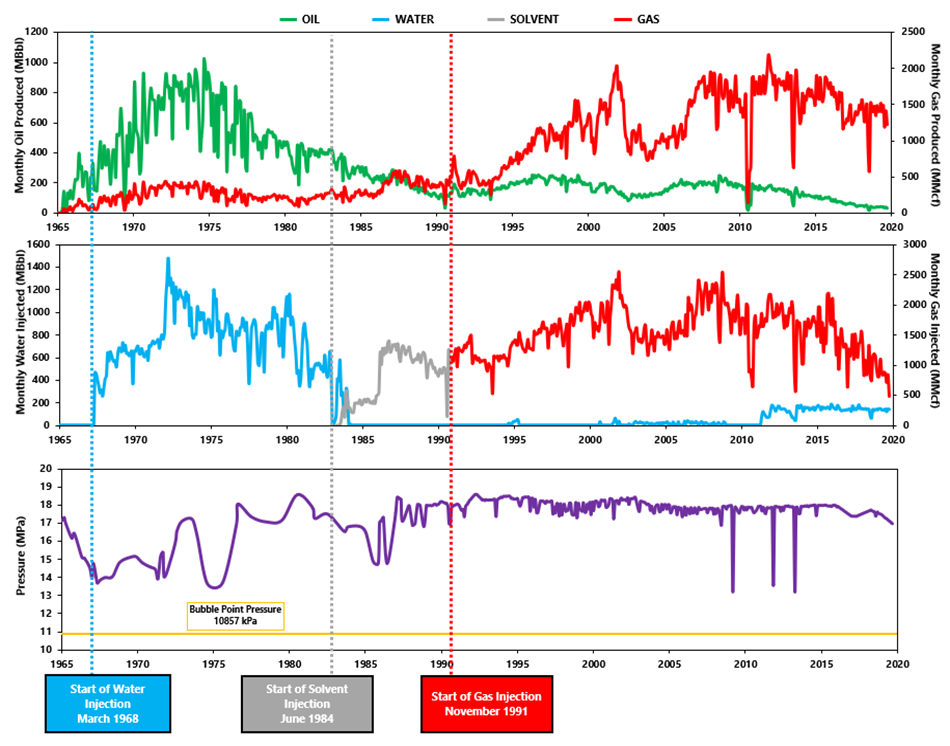
Oil production began in November 1965 and produced under primary depletion, with no significant aquifer influx, for approximately 2 ½ years. In that time frame, pressure dropped rapidly from the original reservoir pressure of 17.2 MPa to 13.6 MPa (still above the oil bubble point pressure, hence, no primary gas cap). In March 1968, a secondary recovery, pressure-maintenance scheme was implemented by injecting water into the “B” pool aquifer, displacing the oil upwards. The waterflood successfully increased the reservoir pressure back to the discovery value. This continued until the start of the 1980’s, when a segregation drive mechanism was implemented through the injection of solvent and chase gas. The solvent was injected in the South Lobe in June 1984. The chase gas was injected in the North Lobe in November 1991 and the South Lobe in July 1992. The injection of chase gas drove the solvent and oil banks uniformly downward through the reservoir, back to the initial Oil-Water contact (OWC). The tertiary recovery process also helped maintain the reservoir pressure close to the initial pressure. These 3 recovery processes are highlighted in the figure above.
Problems & Innovative Design Solutions
Formation Acidization
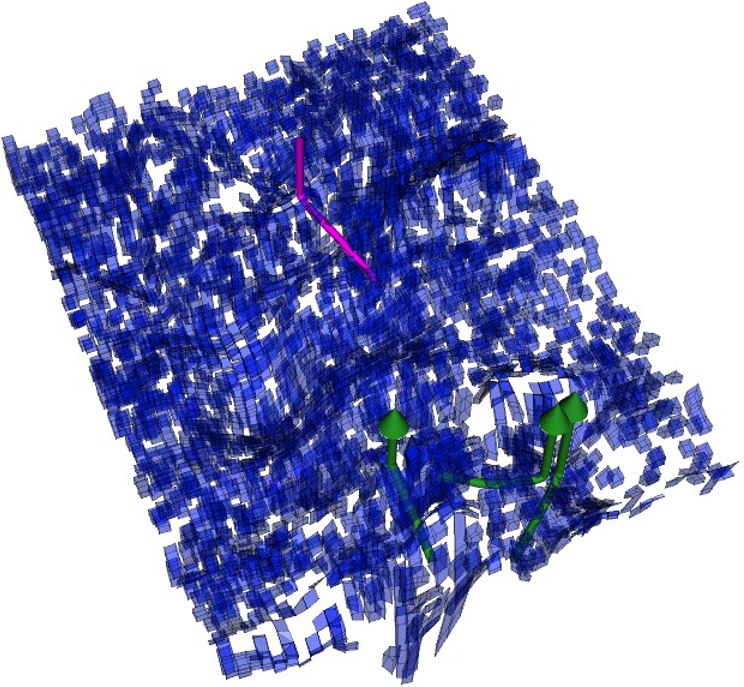
The Keg River “B” pool exhibits lower permeability in the North-South (J) direction and significantly higher permeability in the East-West (I) direction; this variance in permeability is likely due to geo-mechanic stresses. In Alberta, the maximum/principal stress is induced by the westward mountain ranges and lies normal to the J direction of our reservoir. This results in the presence of tighter rock in the J direction. The figure above shows only the model grid blocks which exhibit J-direction permeability less than or equal to 1mD. The 4 horizontal production wells, which were drilled and completed over the last 10 years, have a high presence of these low permeability zones surrounding the horizontal wellbore.
As the DKeg River formation is carbonate rock, primarily composed of dolomite and limestone lithology, formation acidization is the optimum design to enhance production from these wells. Currently, these 4 horizontal wells contribute substantially to the overall pool production, therefore, a near wellbore acidization will greatly increase short-term production from these wells.
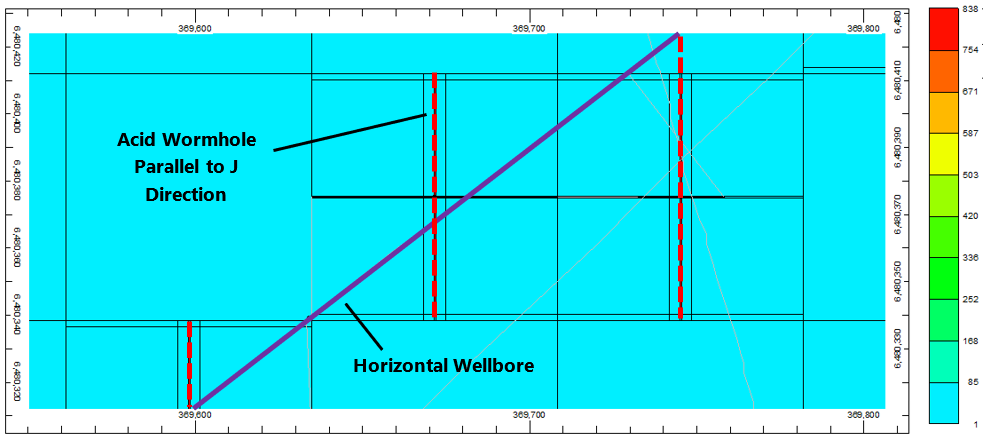
Acid wormholes are induced parallel to the J direction, increasing permeability along this path from 1mD to +838mD. The half-length of each wormhole was restricted to a maximum of 1.5 grid blocks to contain acidization within the near wellbore region. This was done to prevent the accidental accessing of nearby water accumulations which would result in uneconomic conditions if produced.
Vertical Well Recompletions
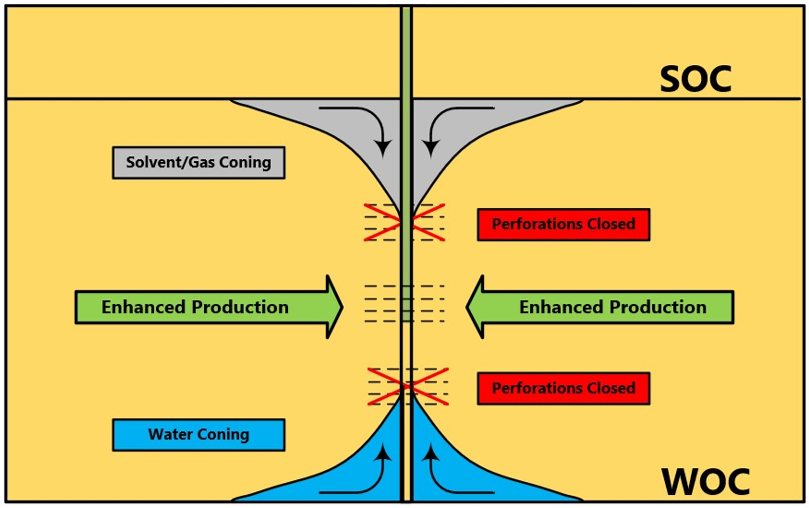
A negative by-product of the various active recovery and injection schemes is highly variable movement of the reserve oil bank throughout the reservoir. This oil bank is located between the Solvent-Oil Contact (SOC) and Water-Oil Contact (WOC), as shown in the figure below. As the solvent bank and bottom aquifer move towards perforations, water and solvent will begin to cone-in towards the open perforations. This coning of water and gas overrides and hijacks open perforations, severely reducing the oil production rate from these wells.
A well recompletion workover plan has been designed to offset coning of water and gas, which has been determined to be significant in 9 vertical and deviated wells throughout the Keg River “B” Pool. Perforations open within the coning interval of water and gas are to be cemented, and new perforations will be shot within the virgin oil bank. By reducing coning of water and solvent, while accessing untapped intervals of the available reserves, enhanced production is expected. This workover plan was analytically modeled using the Kuo and DesBrisay coning correlation and is discussed in the Vertical Well Recompletions Forecast section. A schematic of the coning problem and solution is shown below.
Surface Facilities
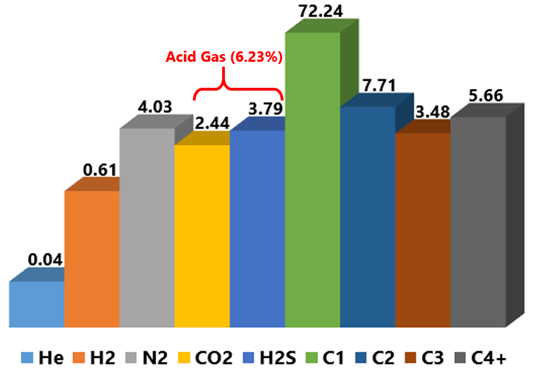
The third and final major development problem identified by our team, is the high and potentially lethal concentration of hydrogen sulfide within the native reservoir’s natural gas. Acid gas, comprising of hydrogen sulfide and carbon dioxide, accounts for 6.23% of the total natural gas mols, as seen in the figure below. Hydrogen sulfide accounts for majority of the acid gas present within the reservoir and can cause severe corrosion of piping infrastructure and can harm field personnel – if left untreated. With the implementation of acidization and well recompletions, a significant increase in gas production is expected to accompany the rise in oil production from the reservoir – motivating the design of surface processes capable of handling high volumes of produced gas while simultaneously sweetening produced gas through the removal of hydrogen sulfide and carbon dioxide.
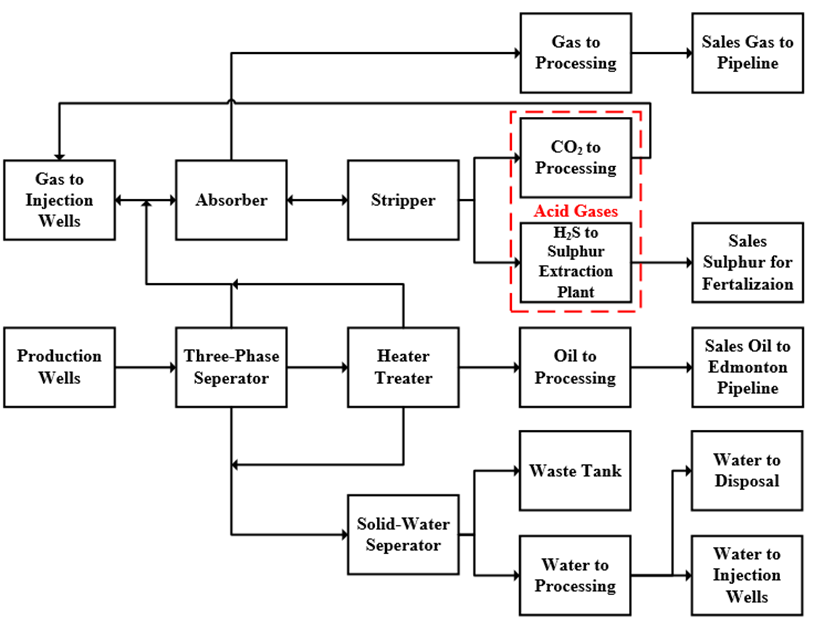
We have designed 3 generic surface facilities units including a 3-phase horizontal separator, horizontal heater treater, and a solids water separator. The main purpose of these three units is to separate the production stream into oil, water, and gas phases to then treat the oil and water for the downstream processes outlined in the block flow diagram below.
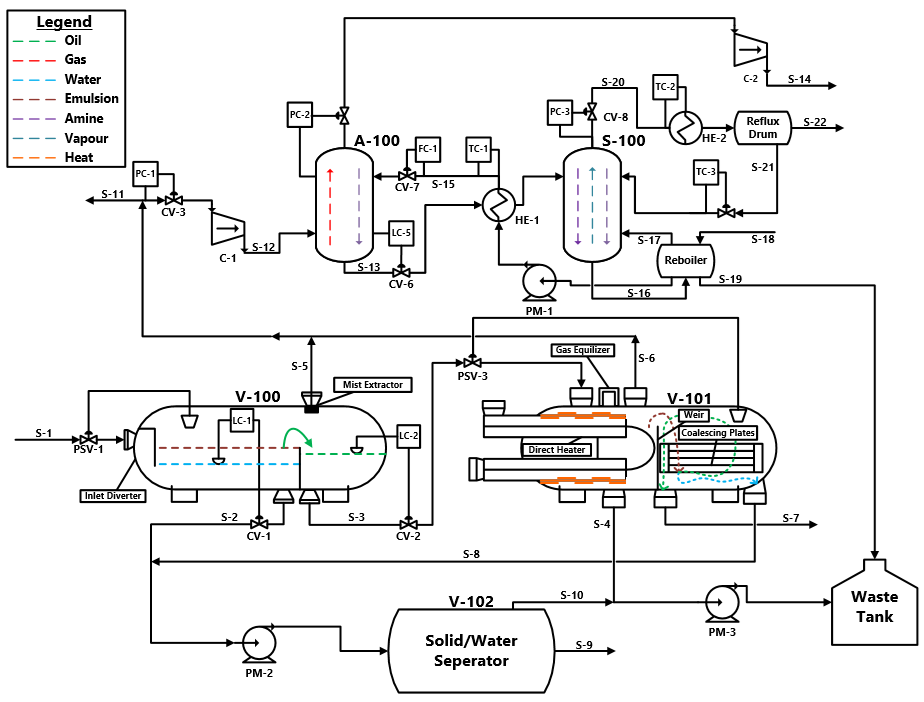
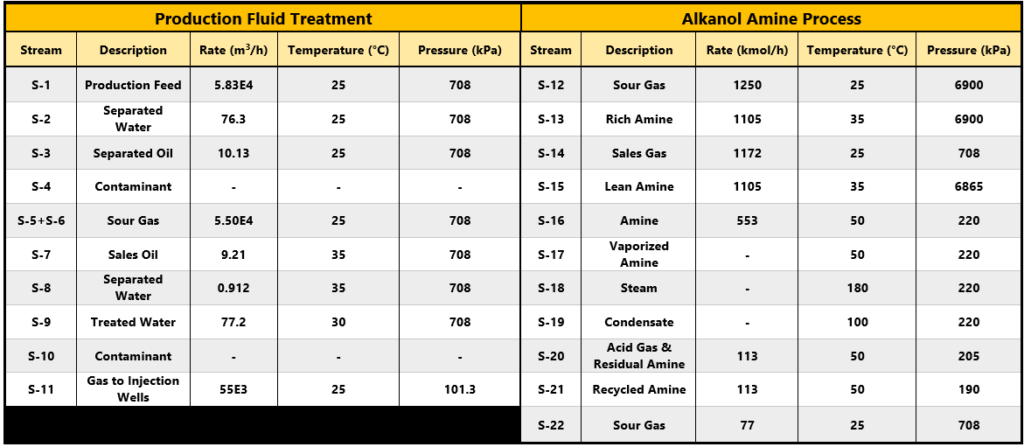
Both the formation acidization and well recompletions development scenarios require a high volume of gas to be injected. Simultaneously, a high volume of gas is produced from the reservoir during these scenarios. To accommodate this injection requirement, 99% of the produced sour gas is reinjected into the formation (S-11) – creating an efficient recycle process. To sweeten the sour gas that is not reinjected (S-12), an extensive alkanol amine process has been designed. The selected absorbate is diethanolamine (DEA) and is continuously recycled throughout the gas sweetening process using an absorption (A-100) – regeneration (S-100) column pairing. To promote absorption and prevent the roll-up effect, sour gas is flowed upwards through the absorption column counter-current to the DEA solvent. The gas exiting the top of the absorption column is considered sweetened and can then be compressed and sold. After absorption, it is important to regenerate the DEA solvent to allow for continuous absorption operations. To promote de-sorbtion of acid gas (hydrogen sulfide and carbon dioxide) from the DEA solvent, the inlet stream to the stripper (S-100) is heated prematurely. Vaporized DEA, generated from a reboiler, is used to continuously heat the regeneration column. Lean DEA exits the bottom of the regeneration unit and is recycled to the absorption unit for continuous gas sweetening. Hydrogen sulfide and carbon dioxide exit the top of the regeneration column within the vaporized DEA stream. These acid gases are liberated from this mixture, with carbon dioxide being sent to re-injection and hydrogen sulfide sent to a sulfur extraction and storage plant. A summary of stream labels, flow rates, and operational conditions are listed in the table below. The total surface facilities program, as shown in the process flow diagram below, was quoted to cost $1.14 Million by OilPro Oilfield Production Equipment Ltd.
Proof of Concepts & Designs
History Matching Results
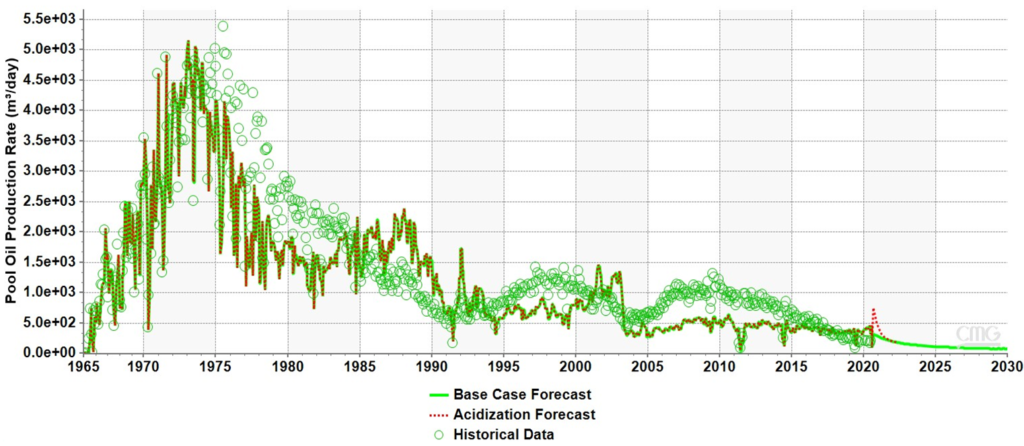
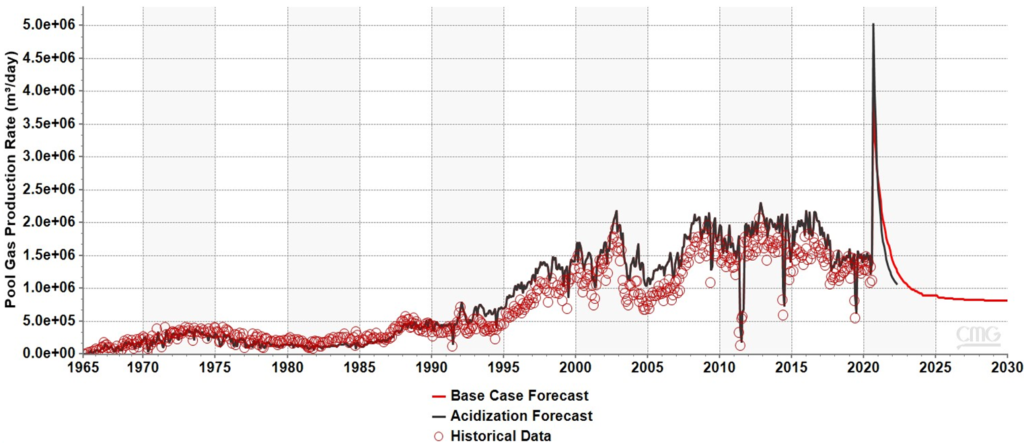
A flagship accomplishment of our team’s design of enhancements to the Keg River “B” Pool is the successful history matching of historical reservoir data in terms of oil production, gas production, gas injection, and water injection rates, in addition to significant progress in matching historical reservoir pressure. This is a significant accomplishment due to the shear volume of data that needed to be matched, as we have over 55 years of production, injection, and development history and 103 total wells contributing to this data. This history matching process was extremely tedious as many parameter combinations had to be tested and over 100 reservoir simulations were run to achieve a strong and representative match. CMOST AI, a Computer Modelling Group (CMG) module was used to determine highly sensitive petrophysical and production parameters that when manipulated, have the greatest effect on the simulated result. Using these parameters allowed us to efficiently history match our reservoir, ensuring that forecasted and simulated results are accurate and representative – effectively validating our acidization development design. The result of the acidization simulation can be seen in the oil rate figure below, but it is overwhelmed by the extensive production history. A detailed graph of the acidization simulation is displayed in the Economics section. The simulated gas production rate shows a significant spike, as a large quantity of oil is to be produced in a short amount of time. It is important to note that some of this produced gas is attributable to the high gas injection rate.
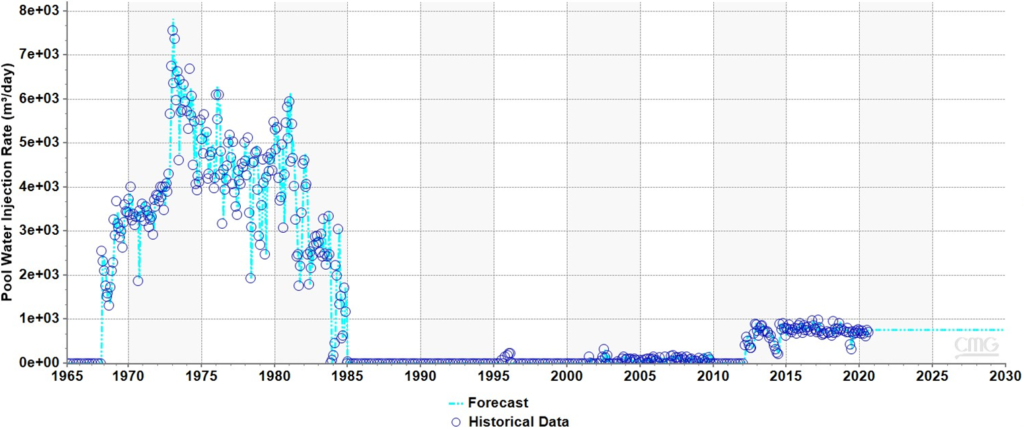
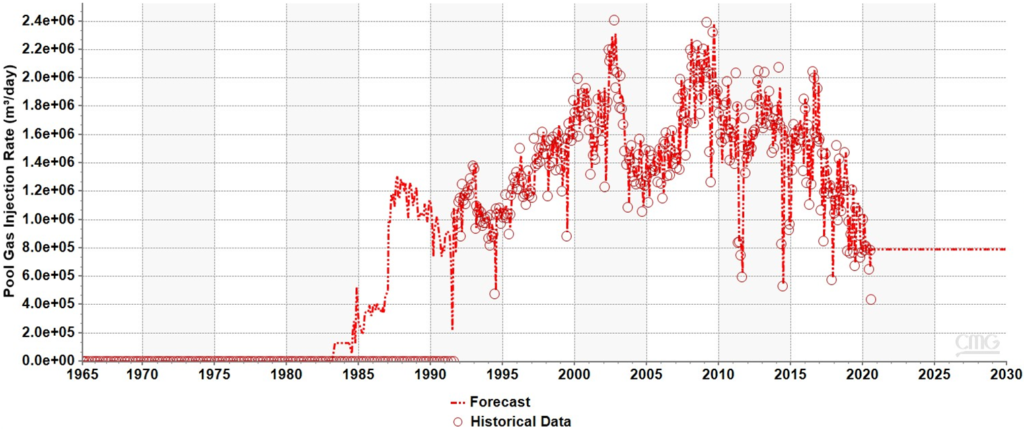
The figures above display a successful history match in terms of water and gas injection rates. The injection rates of water and gas are held constant from the August 2020 value throughout the acidization development scenario, to maintain reservoir pressure and allow for maximum oil recovery via our design. The acidization forecast injection portfolio will be applied for the well recompletions scenario. The simulated base case, acidization, and well recompletions forecasts all maintain the August 2020 water and gas injection profiles.
Vertical Well Recompletions Forecast
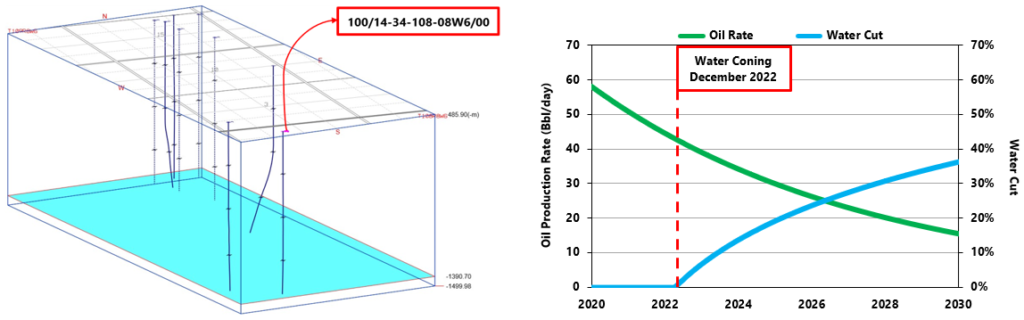
To determine the feasibility and results of our well recompletions design, an analytical coning model was used to forecast production from the subject wells. Although this design could have been simulated in CMG, as was done for formation acidization, the Kuo and DesBrisay analytical correlation is highly applicable to carbonate reservoirs with double anticline architecture – thus, this was deemed to be the most efficient forecasting approach. The figure displayed above illustrates the 9 vertical and deviated wells which are currently experiencing significant water and gas coning. By closing the perforations causing this coning, and reperforating within the oil bank, mathematical modelling displays lucrative results. The plot above displays the analytical forecast for the indicated well. Through this recompletion design, water coning at the production well will not be experienced until December 2022, resulting in a significant increase in oil production rate. The effect of gas coning is also minimized, by placing perforations towards the middle of the oil bank. Mobilized oil due to miscibility with the solvent will effectively be produced from the well, while minimizing the production of immiscible chase gas. This forecasting method was applied to each of the 9 subject wells and a grouped forecast was developed for this design, which is shown in the Economics section.
Economics
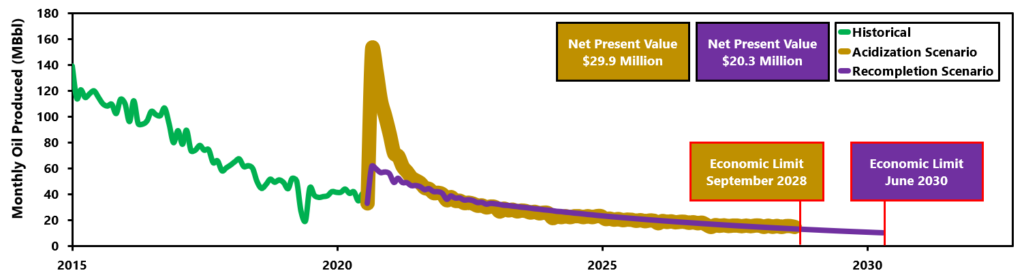
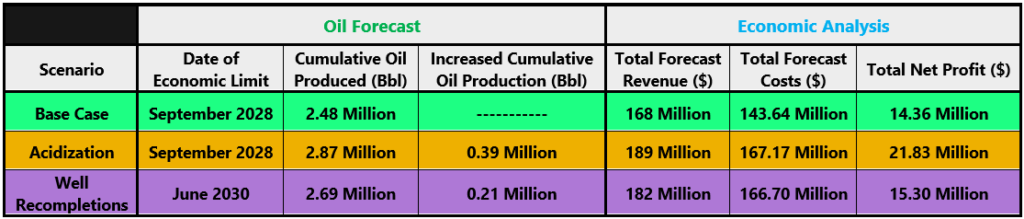
Both the acidization and well recompletions design development scenarios proved to be financially lucrative. The acidization forecast shown below was simulated by CMG. The acidization design reaches its economic limit in September of 2028, and in August 2020 had a project Net Present Value (NPV) of $29.9 Million. The treatment cost (CAPEX) of the acidization design was estimated to be $331.9k, based on the price of the emulsified acid gel, volume of acid used, cost of pumping, pump horsepower, and a fixed field contingency cost. The well recompletions forecast show below was determined using the analytical correlation discussed in the Vertical Well Recompletions Forecast section. The well recompletions design reaches its economic limit in June 2030, and in August 2020 had a project NPV of $20.3 Million. The total recompletion cost (CAPEX) per well, based on Alberta Energy Regulator (AER) estimates, were between $500k and $700k. Due to variation in the number of perforations and length between the 9 wells, a conservative cost of $666k per well was used, summing to $6 Million to recomplete all 9 wells. The table below summarizes the cumulative oil production forecasts, revenue generated, associated costs (OPEX, CAPEX, Abandonment, etc.), and total net profit calculated for each development scenario.
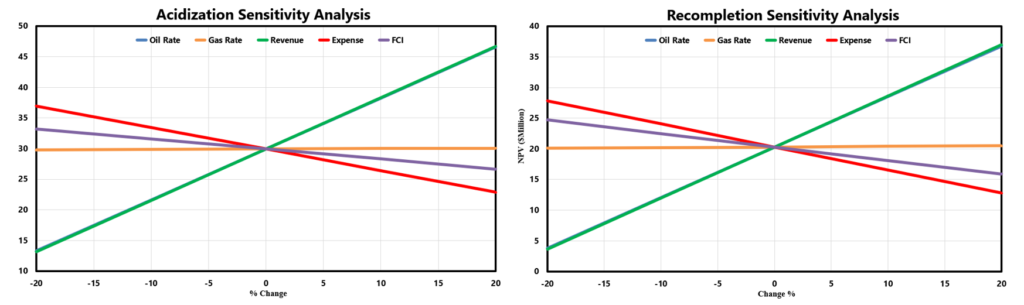
The sensitivity analyses spider plots, for both design development scenarios, are shown below. Both design development scenarios follow similar trends when economic parameters are varied, thus, they have similar sensitivities in terms of the NPV economic indicator. For both scenarios, the revenue and oil rate sensitivity lines overlap, as gas rate is a negligible contribution to the revenue of the pool. This is primarily due to low gas prices and reinjection of 99% of produced reservoir gas. Ultimately, for both cases, the NPV of the project is the most sensitive to variance in oil production rate, which was expected. Internal Rate of Return (IRR) is the interest value at which the NPV of a project becomes zero and is a metric of economic stability. The IRR for the acidization case is 95% versus 56% for the well recompletions scenario. This indicates that the acidization scenario is more economically stable and certain relative to the well recompletions design.
Design Conclusions & Recommendations
- Formation acidization is a cost effective and efficient means of increasing oil production from the 4 currently producing horizontal wells and is considered the optimum/primary development scenario.
- Vertical well recompletions via reperforation is an effective way to reduce/mitigate water and gas coning, while enhancing oil production from the 9 vertical and deviated wells, with reasonable associated costs.
- The designed surface facilities will successfully treat the production fluid stream, while enabling a high quantity of water and sour gas to be reinjected into the formation. Advanced gas treatment facilities using diethanolamine are capable of removing virtually all acid gas (hydrogen sulfide and carbon dioxide) from production gas to treat it for sale.
- The symbiotic implementation of both designs: formation acidization and vertical well recompletions, would result in significantly increased oil recovery, profitability, and overall value. Due to the large uncertainty associated with the simultaneous and combined modelling of these two designs (interference), it has been distinctly excluded from our analyses; however, we are confident that the combination of both designs would yield lucrative results, per the individual scenario modelling, simulation, and economic analyses. The designed surface facilities would be capable of processing the combined fluid influx from these two developments.
Supervisors & Mentors
Thanks to…
Our project supervisors Dr. Koorosh Asghari and Dr. Hemanta Sarma, and industry contacts Faye Byard (Cenovus Energy), Ali Kasraian (CMG), and Olav Cramer (OilPro Oilfield Production Equipment Ltd.). We appreciate the guidance and advice received from all supervisors, mentors, and contacts as we have worked to complete our Capstone design project. We extend thanks and gratitude to our family and friends for their continued and unwavering support, in our pursuit of this academic endeavor.
Sincerely,
The Keg River “B” Team
