Project Category: Petroleum
Join our presentation
Join us on ZOOM from 9:30 am to 2:00 pm on April 5th, 2022
Meet our team members

Oil and Gas Engineering Major

Chemical Engineering Major
Petroleum Engineering Minor

Oil and Gas Engineering Major

Chemical Engineering Major
Petroleum Engineering Minor

Oil and Gas Engineering Major
About our Project
Our project is on the waterflood optimization of Steelman Units 2 and 3 which produce from the Midale formation. The Midale formation is located near Weyburn, Saskatchewan in the Weyburn field which covers a total area of 210,000,000 m2 (210 km2 ). Steelman units 1, 2, 3, 4, 5, and 6 all produce from the Midale formation, however due to the size of the formation our project is focused on units 2 and 3. Steelman units 2 and 3 have a total surface area of 50,500,000 m2 (50.5 km2), and are located on the western end of the Midale formation. Production began in 1955, and the total oil production to date is 47,400,000 m3 for the entire Midale formation and 15,200,000 m3 from units 2 and 3. The objective of our project is to analyze the current production in the Steelman units 2 and 3 and implement simulated development plans to further increase the recovery factor within the pool.
The History of Steelman Units 2 and 3
Geology
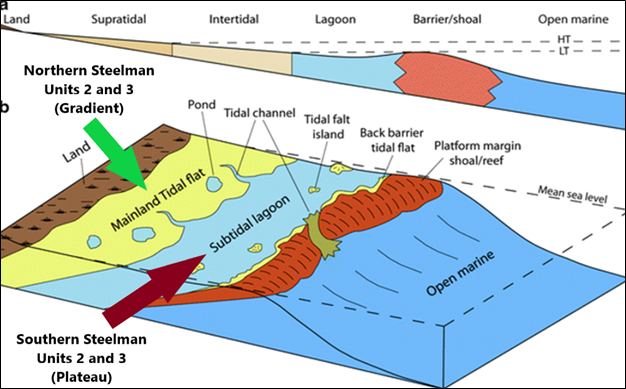
The Midale beds formed in the Mississippian Charles formation, during a transgression-regression sequence. Marine sediment was deposited in a confined arid tidal-flat area (figure below), on a low-relief carbonate shelf. A supratidal mudflat depositional environment in a semiarid to arid climate, enabled evaporite-saline minerals to accumulate throughout the flats. The accumulation of deposits slowly created a gradual gradient between the land and intertidal zone.
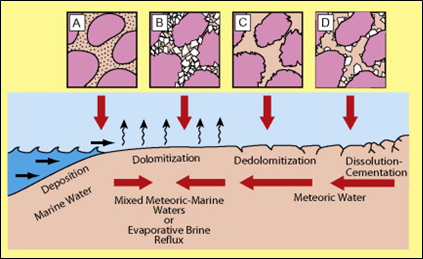
Upon deposition, the Midale formation initially matured into a Limestone matrix with pores and vuggs randomly dispersed throughout. Later in the diagenesis process an influx of seawater contaminated the limestone matrix, and induced a chemical reaction that would permanently change the composition of the formation. The dolomitization process occurs when sea water transports magnesium into the grain matrix, causing the magnesium to react with the rock and replace the existing calcium. This process simply converts lime stone to dolomite, and can be examined in the following figure. This simple change in composition will significantly alter the permeability and porosity of the existing limestone, creating additional void space in the new dolomite. This reaction primarily occurred on the surface of the Midale formation, creating a sub formational dolomite layer, distinguished at the ‘Marly’. Below the ‘Marly’, the original limestone layer can be identified as the ‘Vuggy’.
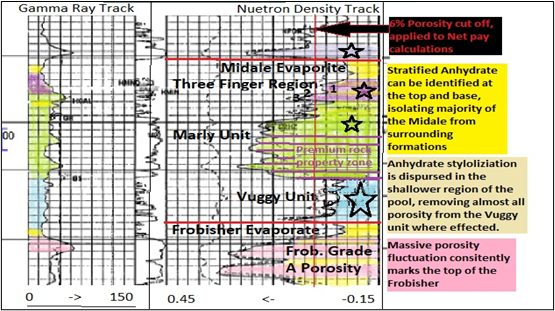
This relationship between these matrix’s can be identified across the pool, with various key features highlighting the distinct trends. The following figure presents the critical distinguishing factors between each of these sub formations.
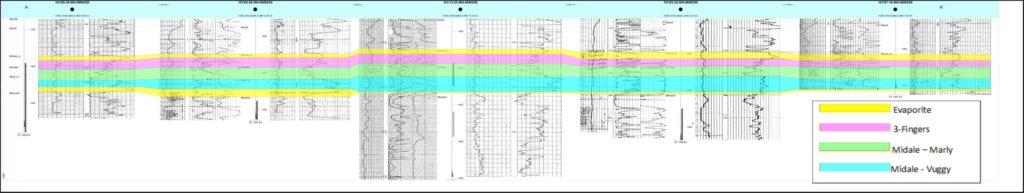
The relationship between these two sub formations has been examined all over Steelman units 2 and 3. The connectivity and consistency of the ‘Marly’ in the South end of the pool, has promoted the application of horizontal wells. In addition, a natural plateau forms in the South, enabling a superior migration in oil from waterflooding. A natural gradient can be noted across the northern region of the pool. This makes this sub formation more ambiguous, and heavily reduces the flow capabilities. This can be observed in the following figure, as we move from north to south, or shallow to deep (left to right).
Aquifer
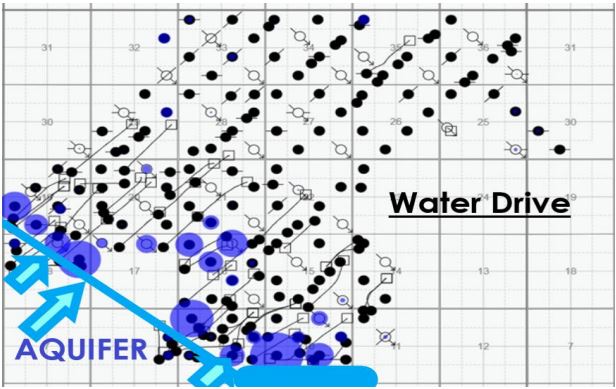
The Midale formation has a direct contact with an aquifer in the south and south-west parts of the pool. Due to water influx from the aquifer, the pressure within the reservoir was maintained above bubble point pressure for a longer period of time. The impact from the aquifer can be seen in the early water production of southern wells before waterflooding has been implemented.
Waterflood Surveillance
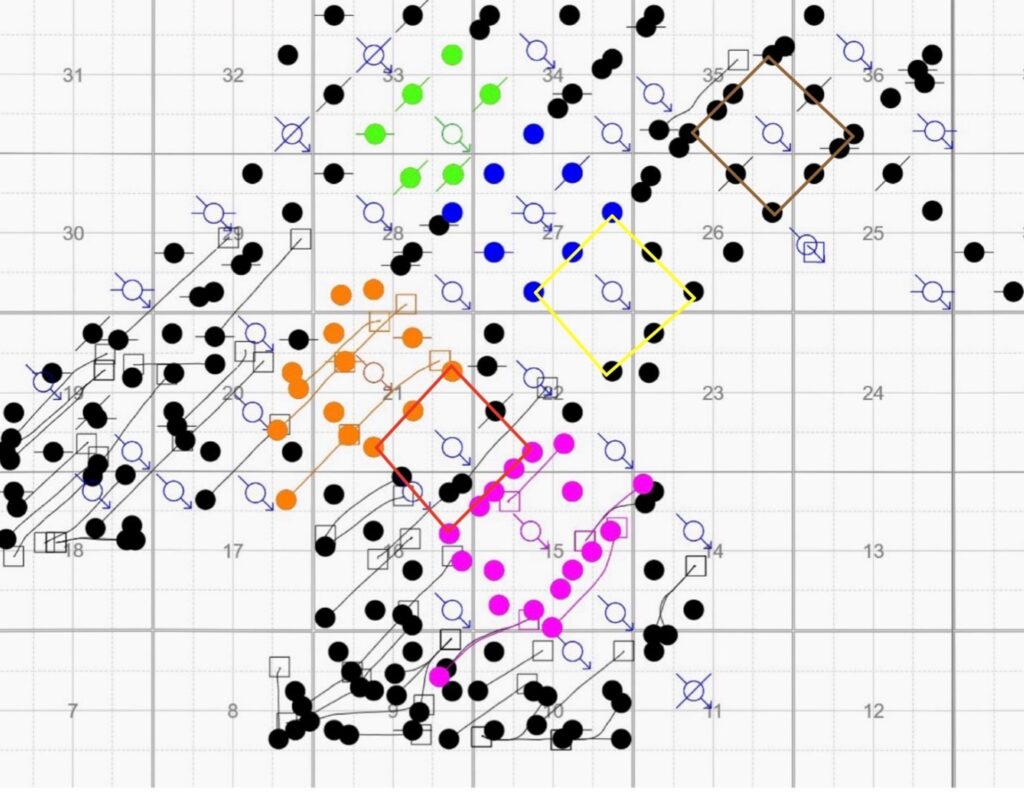
It is very important to design and forecast a new waterflood, but it is equally important to test and report the existing ones. Seven injection patterns based on no-flow boundaries were chosen for our study. These seven patterns were named based on the injector number: 11_27 (N blue), 01_33 (N green), 01_27 (N Yellow), 01_35 (N Brown), 11_15 (S purple), 11_21 (S orange), and 01_21 (S Red). The four patterns on the northern side have consistent inverted nine-spot patterns while the southern ones have irregular patterns.
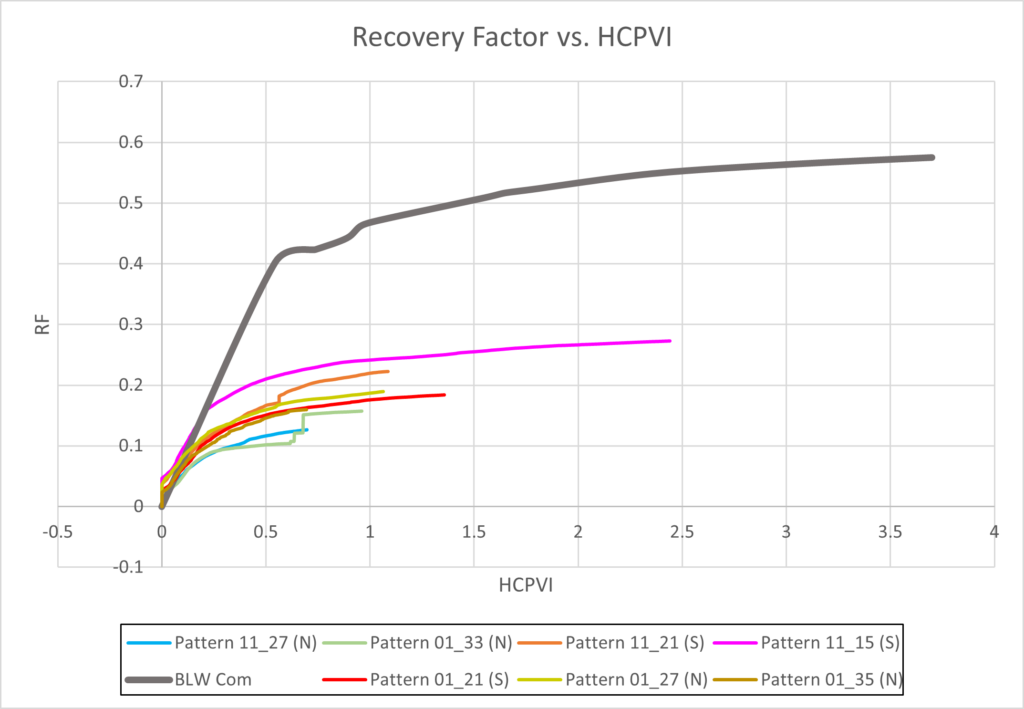
To understand how the existing waterflood is performing, a recovery factor (RF) versus hydrocarbon pore volume injected (HCPVI) plot had to be developed and compared to the Buckley-Leverette waterflood.
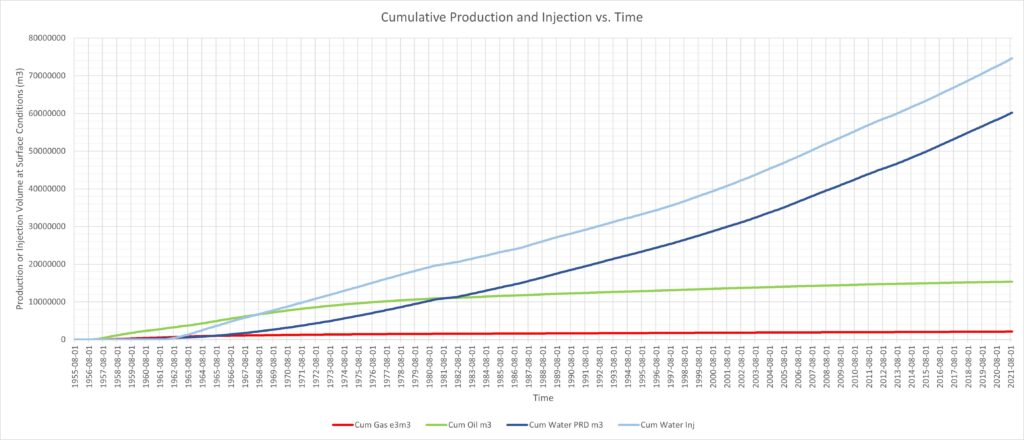
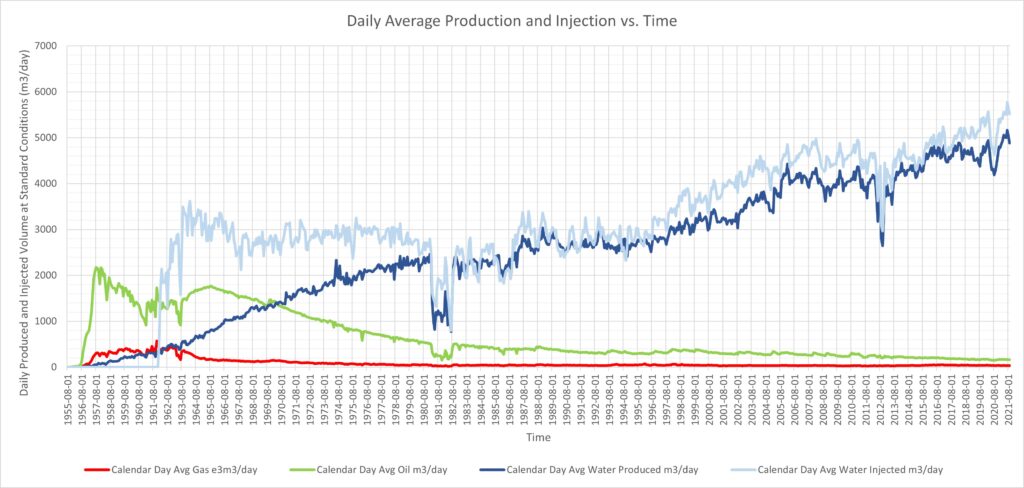
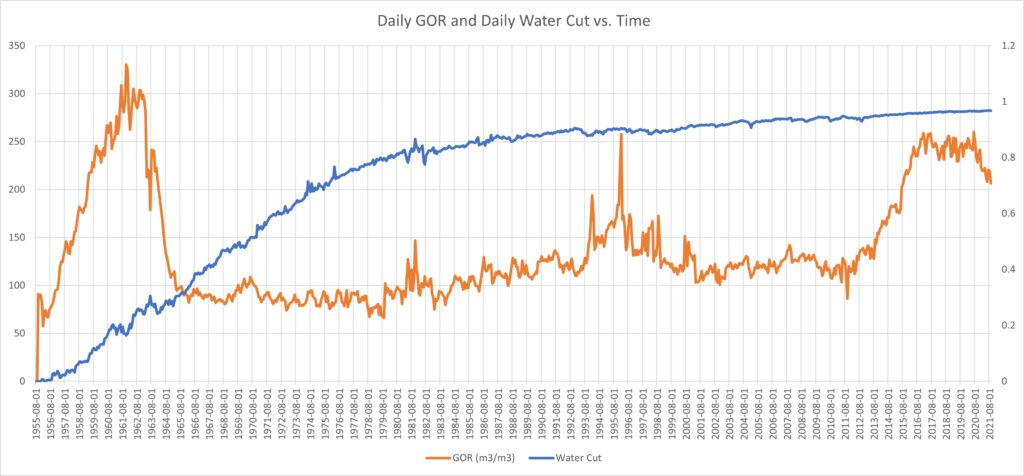
Production History
Production from Steelman units 2 and 3 began in August of 1955 with an initial pressure of approximately 12,000 kPa. In March of 1957 the gas-oil ratio (GOR) begins increasing indicating that the reservoir pressure has decreased below bubble point pressure. Water injection was implemented in January of 1962 with the main purpose of increasing the pressure in the reservoir back to bubble point pressure. The GOR values in April of 1965 are similar to those at initial production and so it can be assumed that the reservoir has reached bubble point pressure at this date. There are currently 127 active production wells, 26 injection wells, and 67 suspended or abandoned wells. Out of the 127 production wells 54 are horizontal wells and 73 are vertical wells.
Simulations
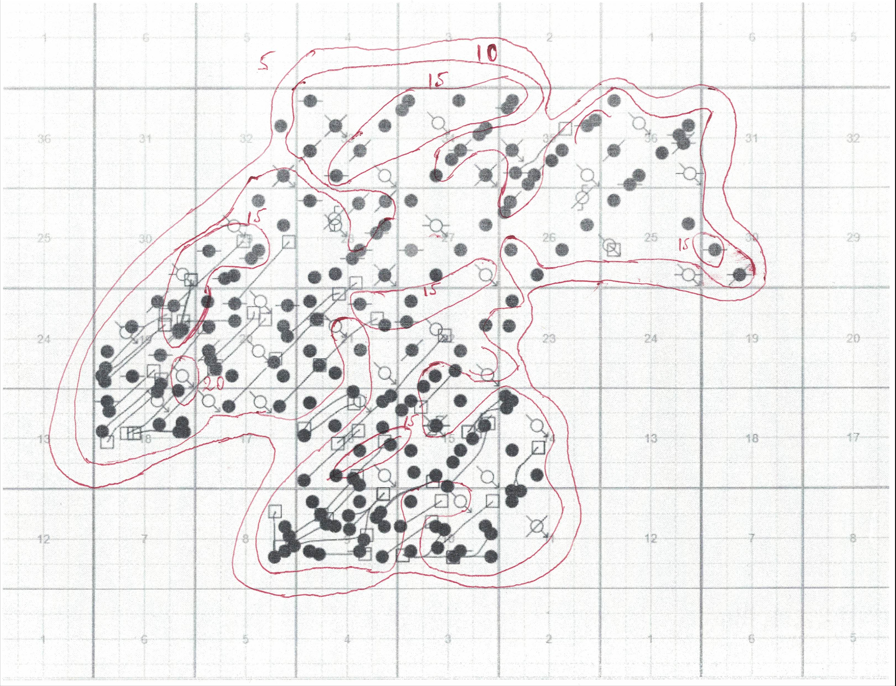
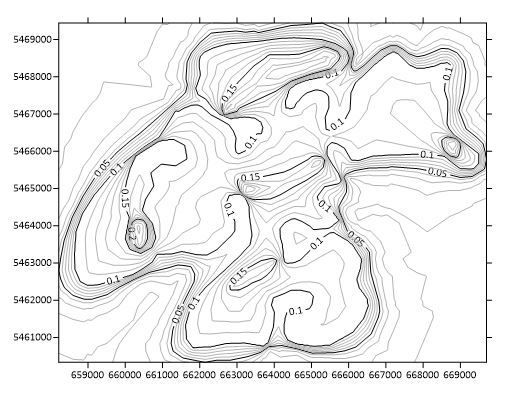
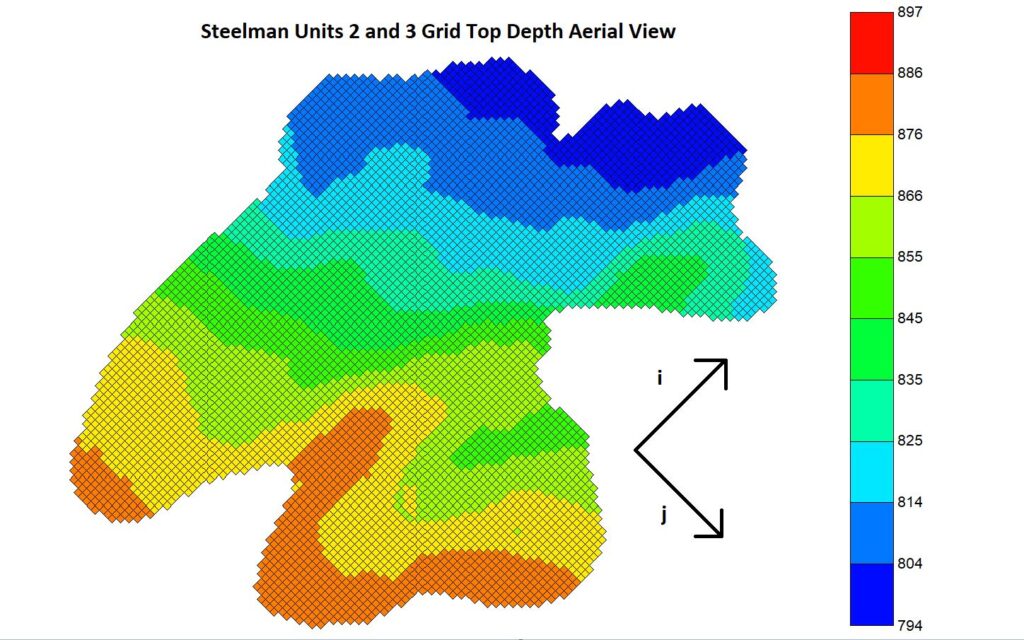
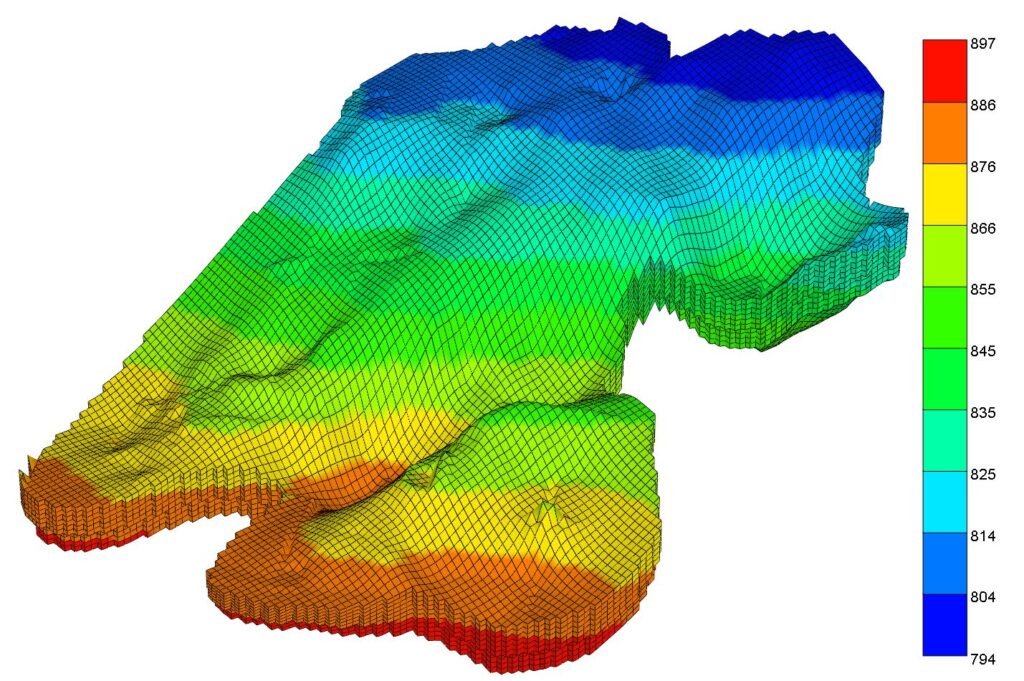
Digitized Maps
Using log and core data accessed through GeoScout, our team was able to determine and create gross pay, net pay, porosity distribution, and structure maps. These maps were later digitized using Surfer software for reservoir model initialization in CMG Builder.
Simulation Parameters
For our project we selected a grid size of 120i x 100j x 10k to ensure that each well within the reservoir was separated by at least 2 grid blocks. Using a grid of this size resulted in each grid block representing a 100m x 100m area. Due to the presence of natural fractures inside the reservoir that have north-east to south-west directionality, the reservoir simulation model was rotated 45 degrees and permeability values in the i-direction were increased.
Calculated and Simulated Volumetric Values
The volumetric approach was used to determine the estimated Original Oil in Place (OOIP) with average porosity of 14.41%, average initial water saturation of 35% and bulk volume of reservoir of 56.7*107 m3, resulting in 53,100,000 m3 of oil inside the porous space. The OOIP obtained from the CMG reservoir simulation was equal to 48,000,000 m3 which has a percent error of 9.6% when compared to the value obtained from the volumetric approach.
Development Strategies
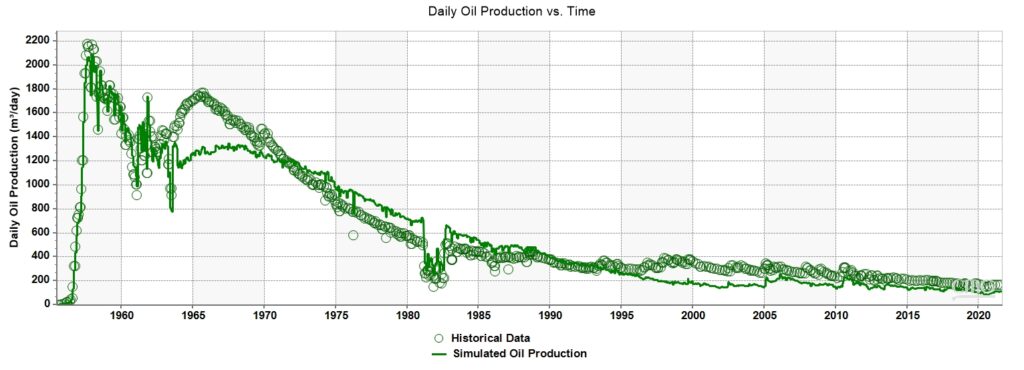
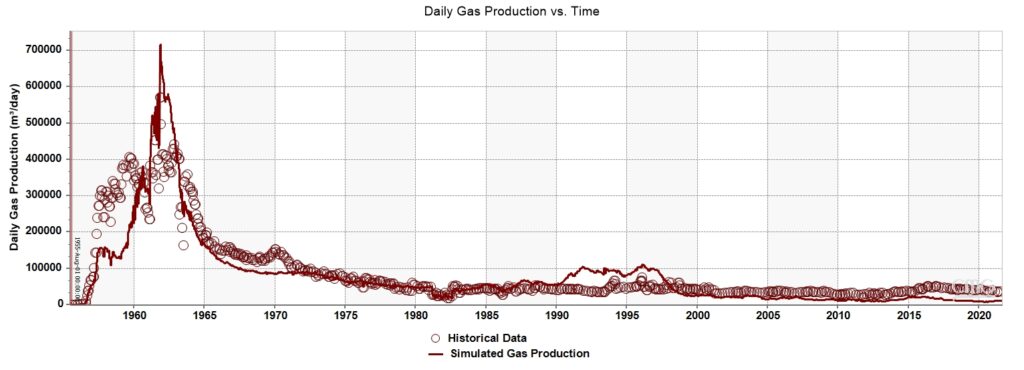
In order to validate our simulation results for any potential development plans, we first need to ensure that a proper history match is conducted.
History Matching
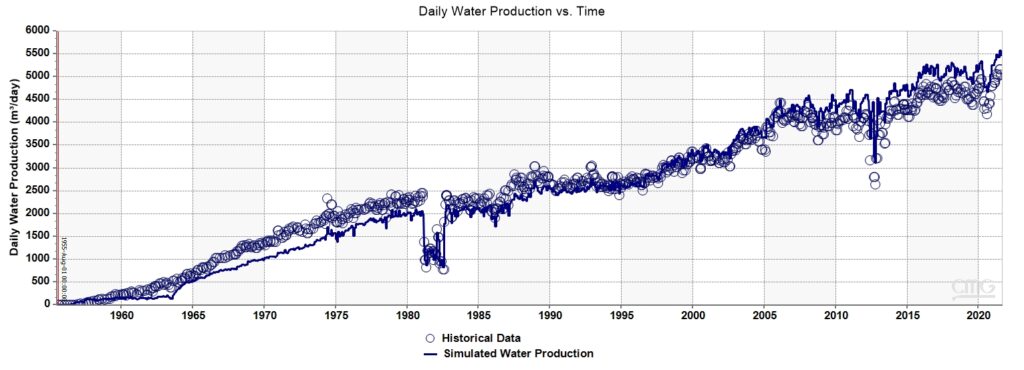
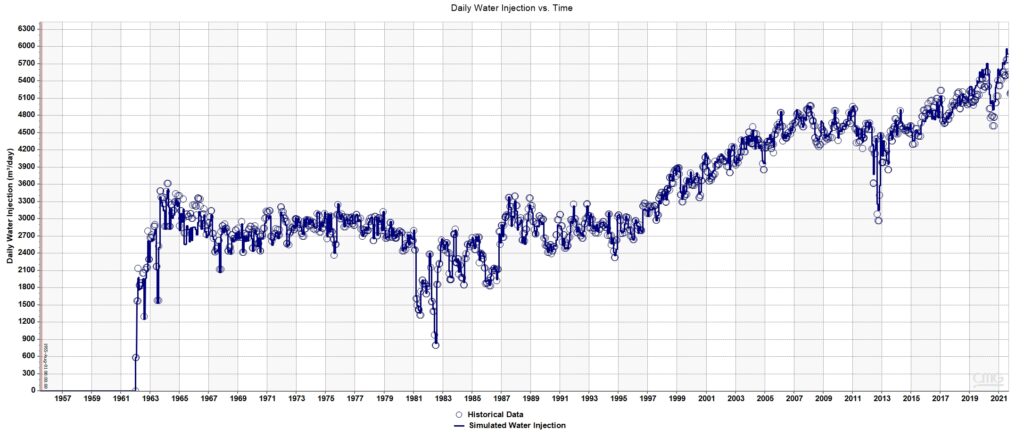
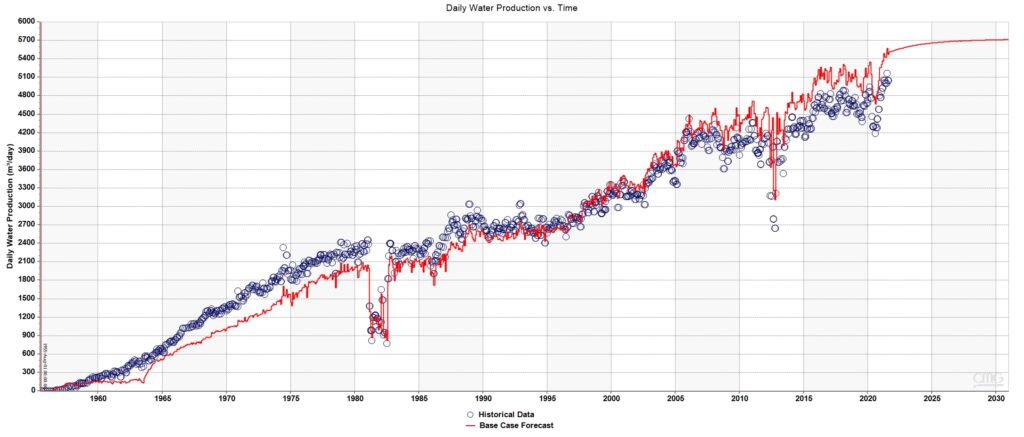
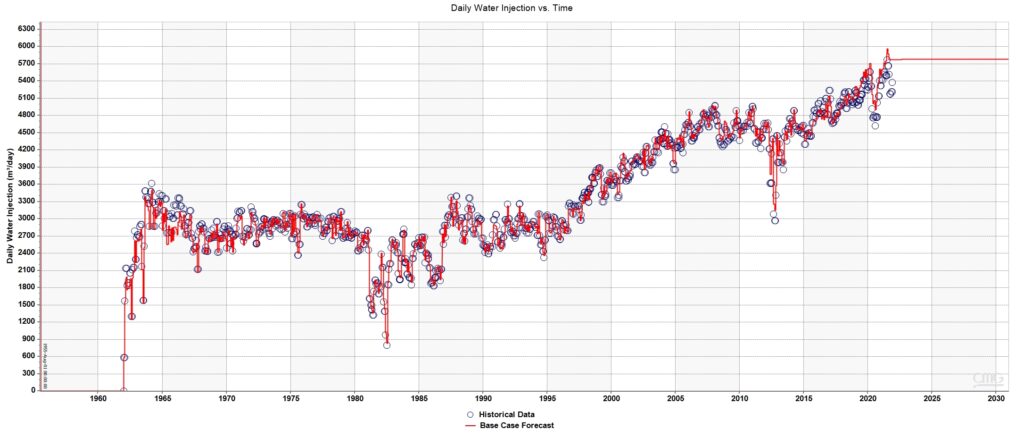
History matching is a challenging process, and it is no secret that it becomes even more difficult as the size of the project increases. For our project, we first matched daily water injection rates while under a maximum bottom hole pressure constraint. To achieve the historical daily water injection rates, we had to increase the absolute permeability of the reservoir in all directions. Next, we adjusted the relative permeability curves in both rock formations (Marly and Vuggy) such that the daily rates of oil production, gas production, and both the production and injection rates of water were all similar to that of historical data.
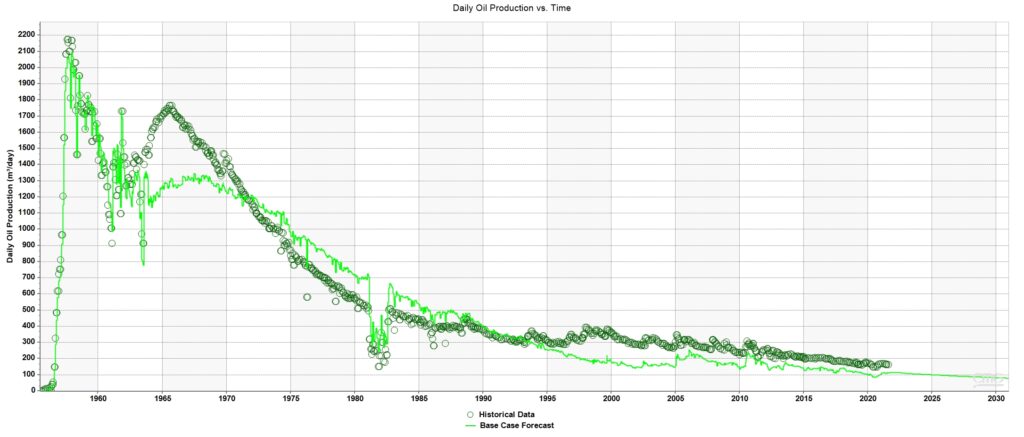
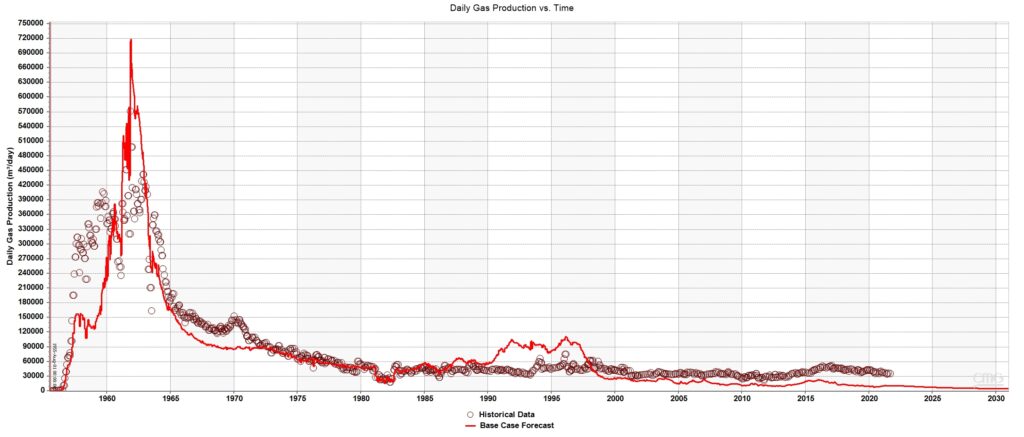
Base Case Forecast
For our base case forecast all wells were constrained based on the simulated bottom hole pressure at the last date of historical data. The production and injection rates determined from our base case forecast are used for determining the economic value of our development strategies.
Converting five Production Wells to Injection Wells
The 5 wells we chose for production to injection well conversion were determined based on the oil and water saturation of the reservoir at the end of historical data. The objective is to increase the oil production while minimizing both capital and operating costs. For our well conversion development plan we had considered 2. Case 1 had 1 production well between each converted injection well while case 2 had no production wells between each injection well.
After considering both cases, we found that the production gained from Case 2 was greater than Case 1. The daily production rates of oil and gas for Case 2 can be seen in the following graphs. Both the horizontal and vertical axis for Case 2 had to be adjusted due to the relatively small difference in production rates.
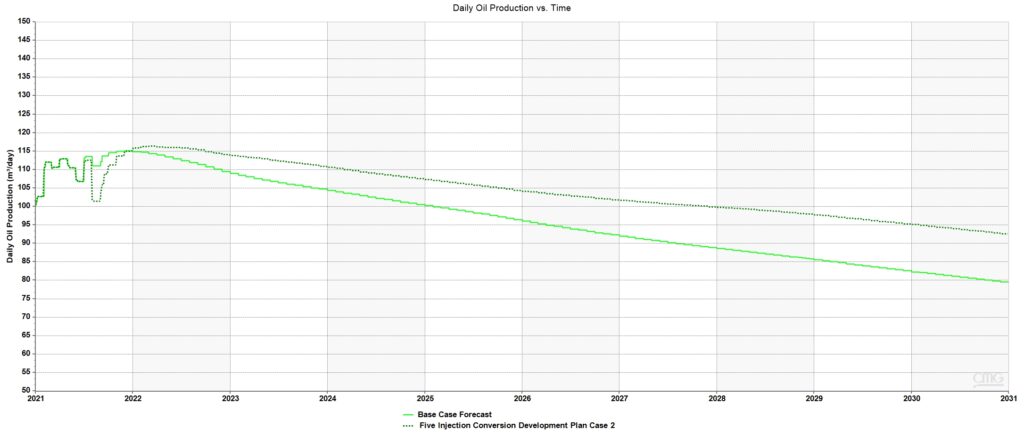
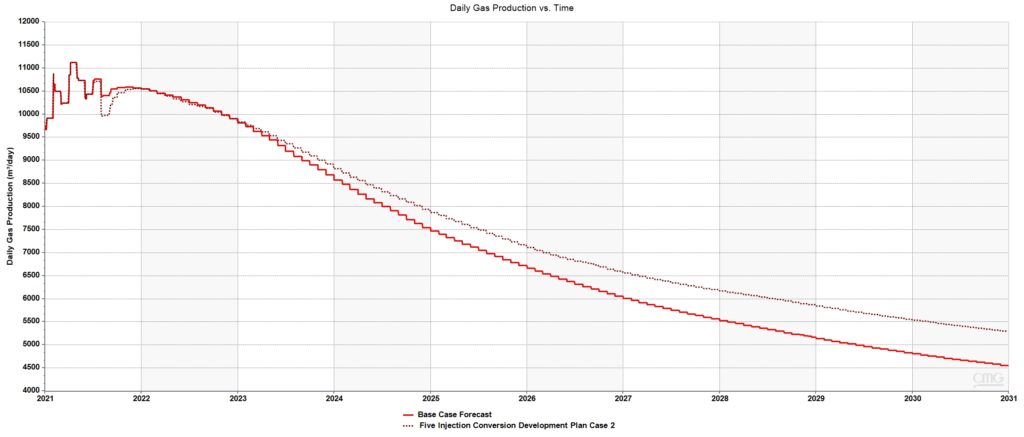
A few key things to note from the Daily production rate plots is the initial decrease in both oil and gas production due to the shutting in of wells production that are being converted. The production rates then increase back to those predicted from the base case forecast and continue to decline from that point at a slower rate than the base case forecast. The economic results of Case 2 can be found in the economic analysis section.
Addition of two Horizontal Wells and two Production to Injection Conversions
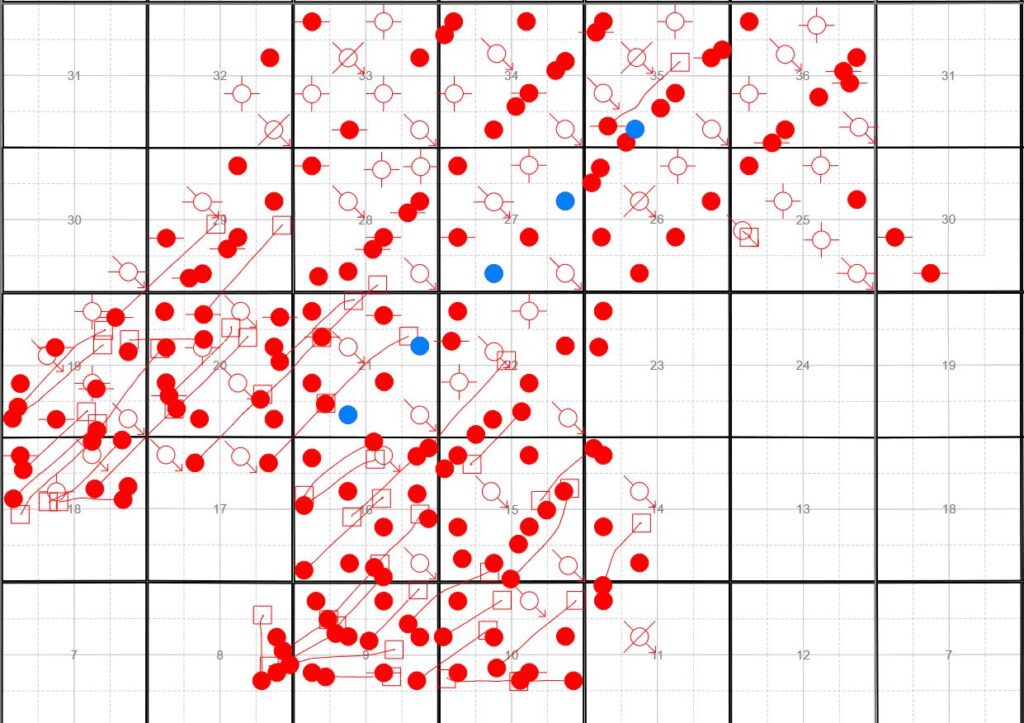
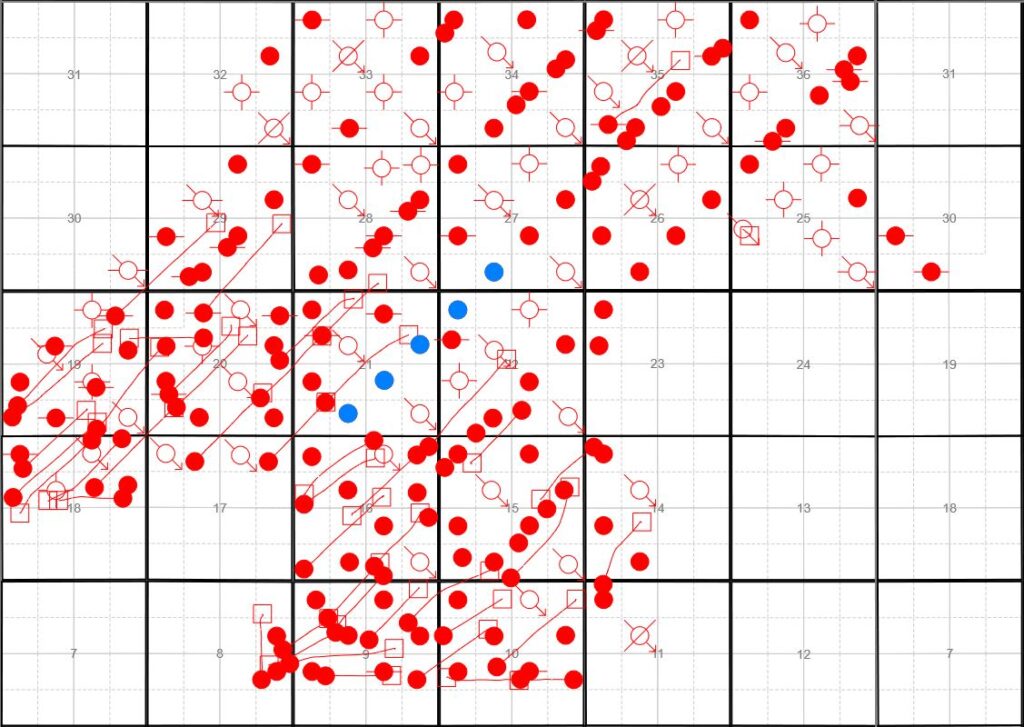
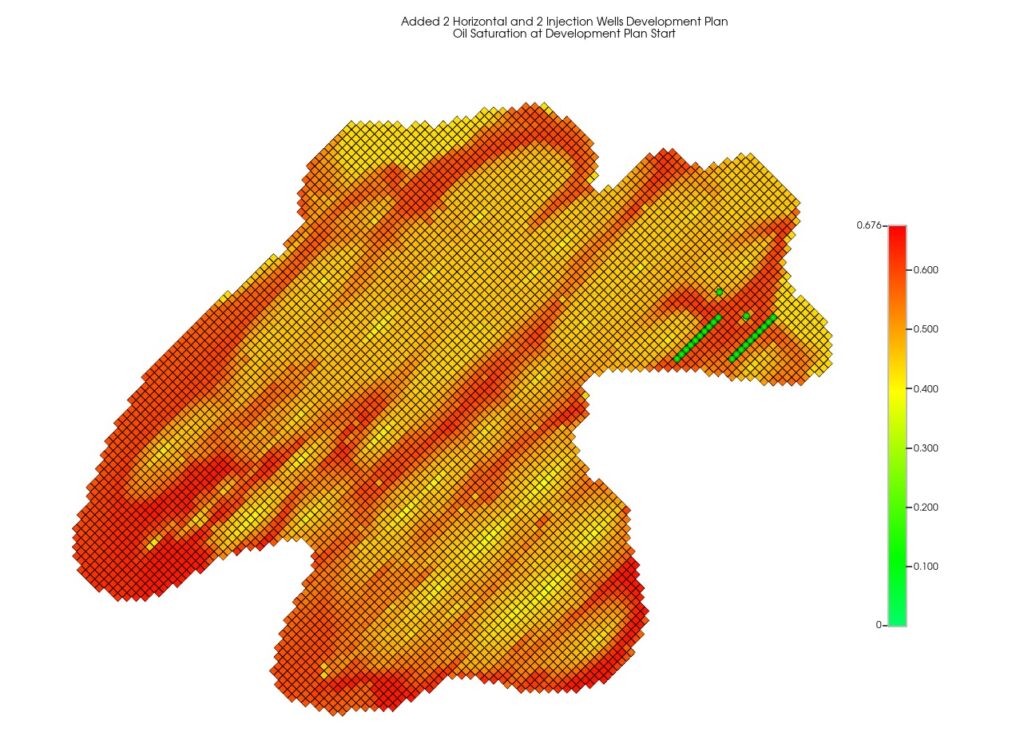
Early on in our analysis of Steelman units 2 and 3 we noted that generally, horizontal wells were only implemented in the southern portion of this formation. We had decided that we would like to explore the option of implementing horizontal wells in the northern portion of our formation due to the success of the horizontal wells in the south. The two horizontal wells we added have surface hole locations in LSD 02 and 04 of section 25. The two wells have been named ’02-25 Horizontal’ and ’04-25 Horizontal’ based on their surface hole locations. ’02-25 Horizontal’ is directly East of ’04-25 Horizontal’. Due to the production from the two horizontal wells causing a major decrease in reservoir pressure, we also re-opened one previously shut in injection well and converted one production well to injection well. The re-opened and converted injection wells can be seen in the following image as well as the two horizontal wells ’02-25 Horizontal’ and ’04-25 Horizontal’
’02-25 Horizontal’ was drilled to depth of 1433m with a horizontal length of 900m and ’04-25 Horizontal’ was drilled to a depth of 1439 with a horizontal length of 1000m. The increase in oil production was observed as a vertical spike initially and declined slowly while still remaining above the base case forecast in 2031.
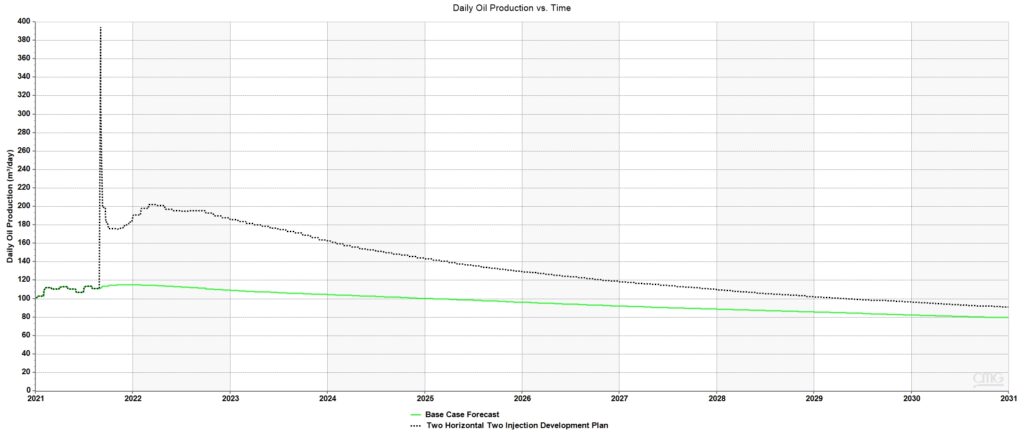
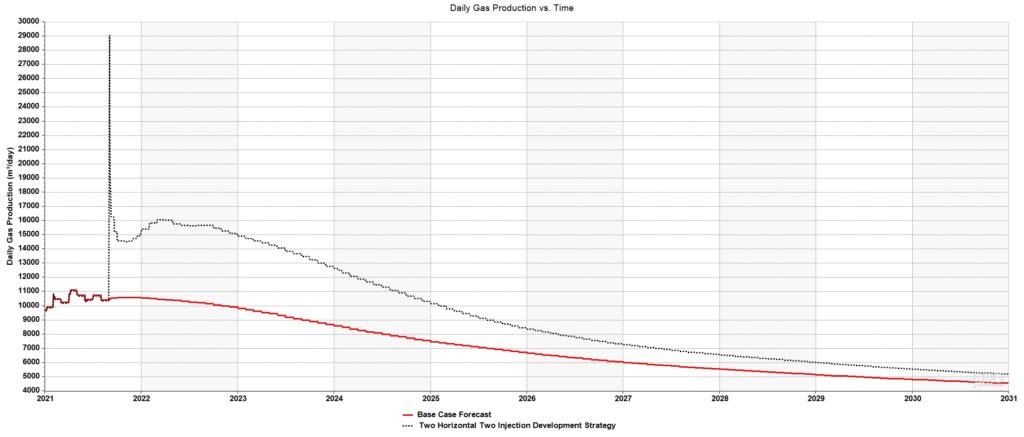
The economic results of the two horizontal two injector development plan can be found in the economic analysis section.
Drilling and Completions
Process
For our project, we are selecting horizontal wells with open hole completions. The surface hole will be drilled to a depth of 206 mTVD such that it satisfies the 200m surface depth requirements put in place by the AER to protect sources of sub surface drinking water. A 349 mm tri cone tooth bit will be used since the formation closer to the surface is softer. A surface casing of 244.5 mm in diameter, with a linear density of 48.07 kg/m3 and grade of H-40 ST&C will be run from the surface to the surface casing depth. The bottom will be tagged with casing to confirm the tally is correct; this will allow for easy installation of cementing head.
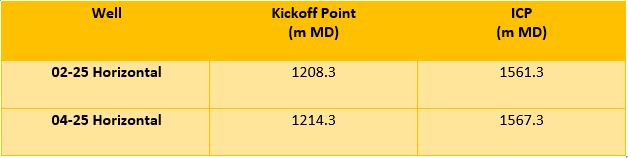
The surface casing will be cemented in place with an estimated tonnage of 19. The mud used to drill the surface hole has an approximate density of 1700 kg/m3 . A downhole pressure of 2008 kPa was calculated using the depth and density. A Gel Chem slurry with additives was used to prevent mud rings, and losses to the formation. The volume of mud required was estimated to be twice the volume of the hole. The excess mud will be stored in the tank at the surface. A pressure gradient of 15 kPa/m was used according to AER’s Directive 010 while calculating the collapse pressure for all sections of the casing. All the design factors comply with AER’s Directive. For the intermediate/build section, a main hole of 222 mm will be drilled from 206 m to the kickoff point of the horizontal well. A PDC (Polycrystalline diamond compact) drill bit and directional BHA will be used for these sections. The PDC provides the ability to increase rate of penetration and durability which increases the lifespan of the bit. The motor is set at 2.25 degrees to drill to ICP (intermediate casing point). The pump pressure must be monitored to watch for mud rings and packing off as ROP will be high. Floc clear H20 at an approximate density of 1000 – 1010 kg/m3 is used as a drilling fluid. The cement used from 0-1200 mMD is Titanium with a density of 1400kg/m3, while the cement used from 1200m to the intermediate casing point is T.A.C with a density of 1600 kg/m3 . The lateral section will be drilled with a 159 mm PDC bit and completed with an open hole. An inhibited polymer will be used as a drilling fluid to prevent clay swelling and help with hole stability. A table showing the kickoff point and ICP measured depths can be seen below.
Economic Analysis
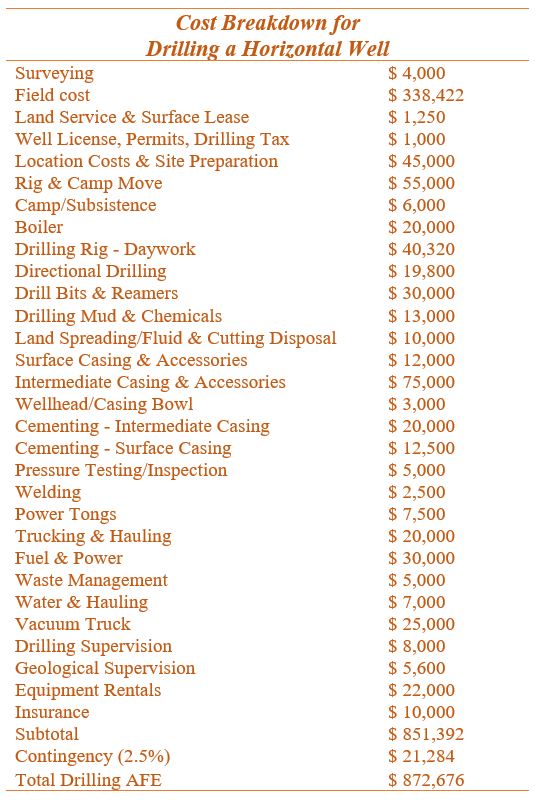
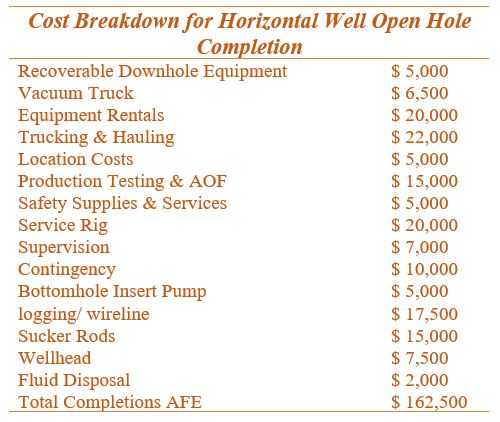
The costs were estimated using Whitecap’s historical data in the Weyburn area. The drilling, completion, and producer to injector conversion costs are estimated to be $872,676, $162,500, and $267,750 respectively. The complete breakdown of costs can be found in the tables below.

Facilities Upgrade Program
Upgrading the Multi-Well Proration Battery
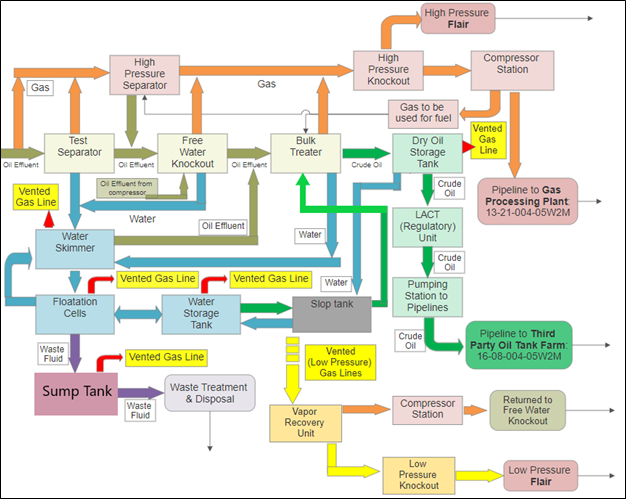
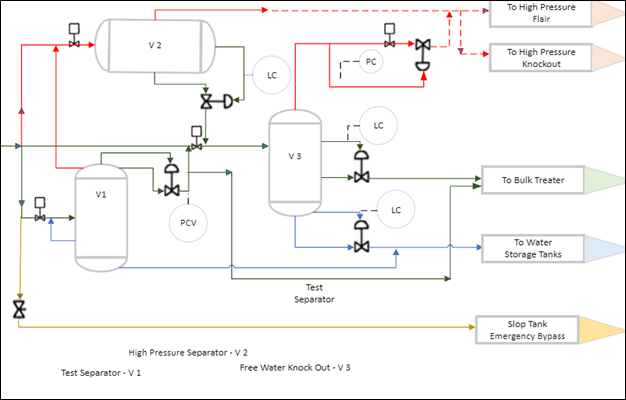
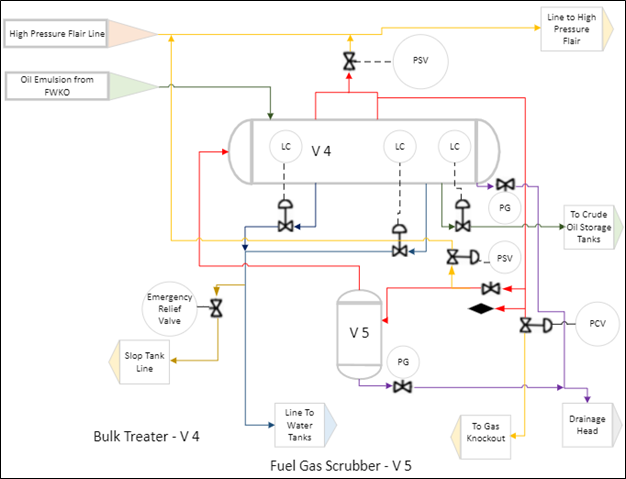
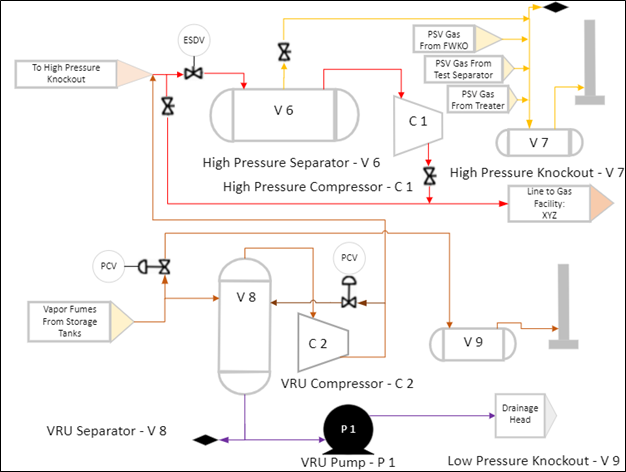
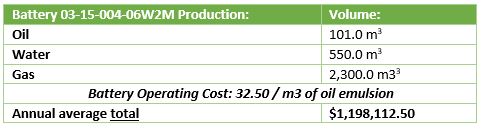
The largest surface multi well oil battery (03-15-004-06W2M) is located in the South West region of Steelman Units 2 and 3, and currently processes an average of (635 BBL) 101 m3 of crude oil a day. This facility is also responsible for treating, storing, and injecting almost (3500 BBL) 550 m3 of water daily. This facility was originally constructed in 1961, at the beginning of the waterflooding era. Modification has since been made, to accommodate for the additional production induced from the application of horizontal wells. The overall design of this battery facility is still applicable, while maintaining the ability to process a very high magnitude of oil emulsion. The primary short comings of this facility arise from the overall efficiency of the processes. Older separation facilities will require additional energy, as heat and pressure and typically not conserved as effectively. Adding additional smaller units will reduce the load on larger units, like the bulk separator, and create less energy intensive process. Enhanced recycling will optimize the purity, and minimize the resonance time of the crude. An enhancement in purity and overall capabilities, while minimizing environmental impact, makes this a considerable strategy.
Economics of Upgrading Facilities
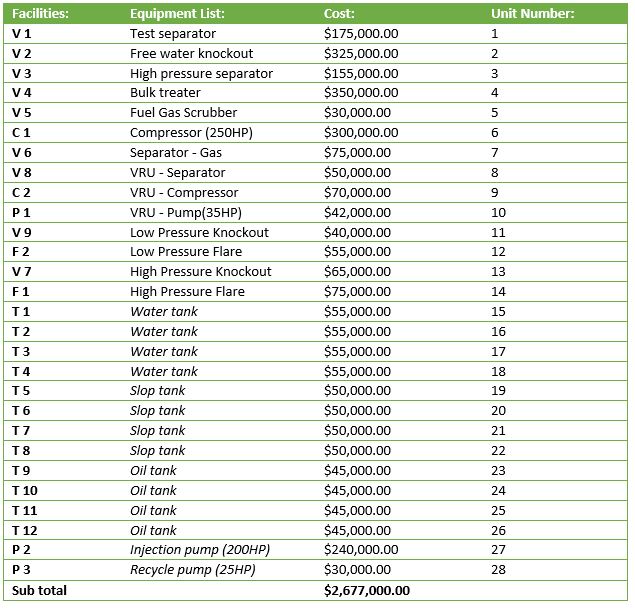
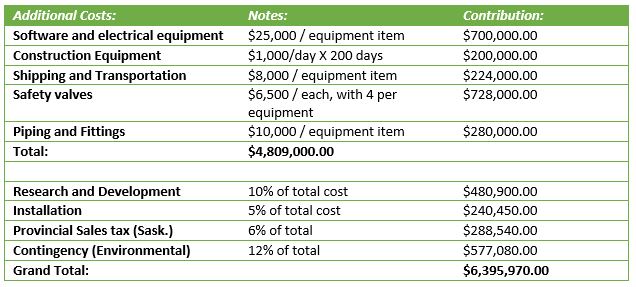
Upon performing an economic analysis of this potential strategy, it can be concluded that this is not a viable program to optimize Steelman Units 2 and 3. The key equipment that would be required to upgrade this oil battery facility are highlighted in the Tables bellow. A modest investment of approximately $6.4 million, is required to properly implement the proposed facility. It is estimated that a new facility can reduce energy requirements by 25%, based off of historic data applied to other oil battery facilities. The only revenue obtained from this investment would result from the approximate 25% reduction in operating costs for this facility. If this facility typically costs $1.2 million to operate each year, it would take 22 years to pay off or break even on this investment. This payout is considered to be not economically favorable.
Economic Analysis
Economic Calculations
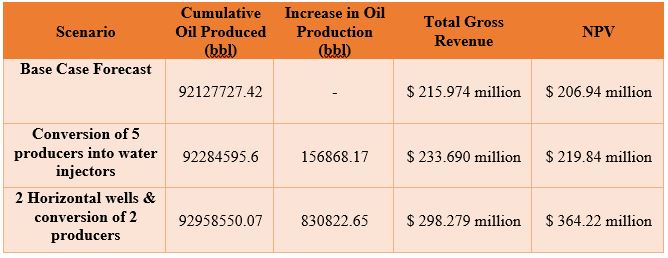
Based on the simulated values up to year of 2031, economic analysis on base case and development strategies was conducted, and results were summarized in the table below. The Net Present Value (NPV) of base case forecast was determined to be $206.94 million with the discount rate of 15%, and the recovery factor of 27.58%. It can be stated that both developments strategies yielded to be profitable, however the increased oil production is low. Adding 2 horizontal wells and converting 2 low production wells has the highest NPV of $364.22 million with the capital cost of $9.43 million and increased oil production of 830,823 barrels while converting 5 low performing production wells into injection wells, results in only 156,868 barrels of extra oil produced.
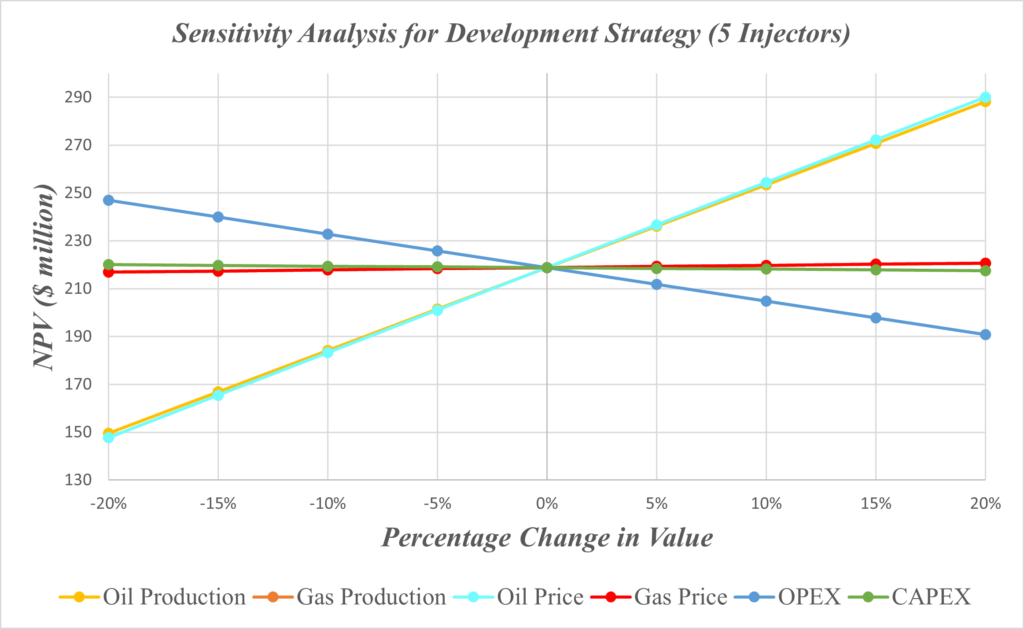
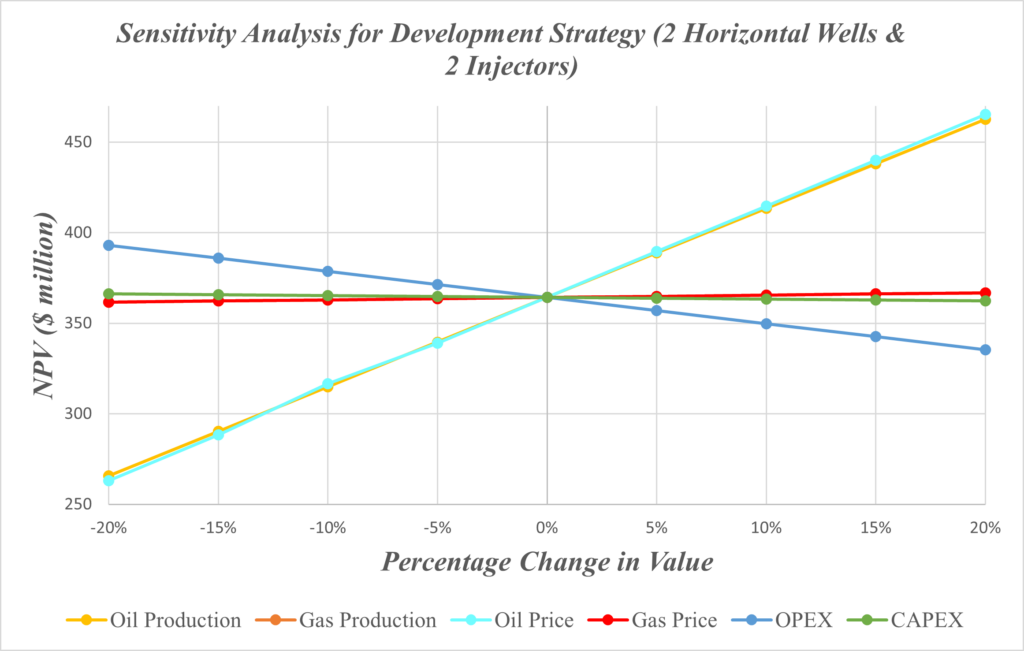
Sensitivity Analysis
The sensitivity analysis was done for both development scenarios using spider diagram which shows the effect of changing a certain parameter on the NPV of the project. The two parameters that have the most impact on the economics of the project are oil production rate and current price of oil. Gas production, gas price and CAPEX have the least impact on the project.
Recommendations and Closing Remarks
Given the forecasted production and economic analysis of each development strategy, our team suggests proceeding with drilling 2 additional horizontal wells and converting two low performing producing wells into injectors in north-east part, section 25. Section 25 has a higher oil saturation compared to other zones across the Midale formation, hence it is a great spot for drilling extra horizontal wells targeting upper formation layer (Marly layer) to increase oil production. Due to imperfect history match results, the proposed strategy will be further investigated and analyzed to ensure the validity of the output results.
Special Thanks
We want to thank Dr. Harvey Yarranton and Dr. Michael Aikman for their guidance on this project.
We would also like to thank Whitecap for providing us with valuable data and information.

Department of Chemical & Petroleum Engineering

Reservoir Engineering Expert, Upstream Technology Center, Abu Dhabi National Oil Company

Pool Operator
