Project Category: Petroleum – Conventional Secondary Recovery

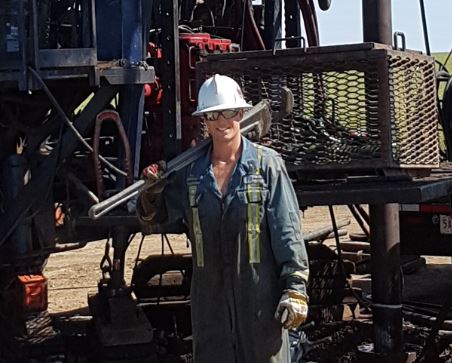
Prairie Pump Jacks Ldt. Fobisher, SK
About Our Project
Location: Swift Current, SK
Ownership: Whitecap Resources Inc.
Formation: Roseray
On October 29th, 1952 the first well was completed in the Swift Current Roseray formation by Husky Energy. Husky Energy had found an enormous oil reservoir, holding over 60 million barrels of oil. Development of the pool quickly began and core samples and logs collected over time defined the pool. Data analysis revealed the reservoir to be a conventional, clean sandstone reservoir with areas of shale. As production continued, the decision was made in September of 1956 to start secondary recovery by water flood. Water cuts in producers gradually increased over the next few years and in 2016 Husky sold the pool to Whitecap Resources. Recently drilled wells by Whitecap have proven that strategically placed wells can continue to see profitable returns in the 69-year-old formation. Our group has modeled the formation in CMG and proposed new development plans. The development plans have been simulated in the model, in hopes of finding a profitable development strategy for the Success Roseray formation.
Meet our amazing team.

Fernando Alonso
Chemical and Petroleum Engineering

Joshua Wiens
Chemical and Petroleum Engineering

Leo Larochelle
Chemical and Petroleum Engineering

Jeff Sutherland
Chemical and Petroleum Engineering
John Savage
Chemical and Petroleum Engineering
Partners and Mentors
Special thanks to our partner and mentors who have helped to provide answers to complex engineering problems.
Reservoir Owner

Group Academic Advisor

Dr. Harvey Yarranton
Department of Chemical and Petroleum Engineering, University of Calgary.
Group Industry Advisor

Dr. Michael Aikman
Trindade Reservoir Services Inc.
Development Plan Overview
Problem
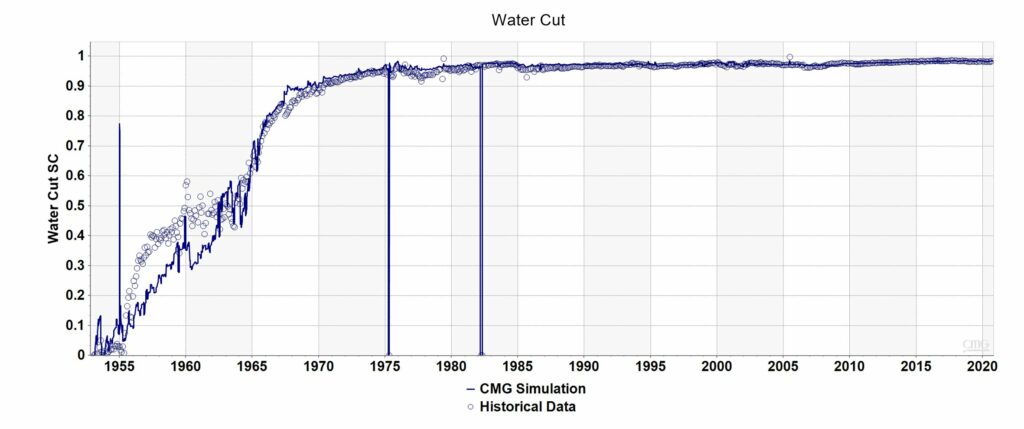
Since water injection has started, many pore volumes of water have been injected into the pool. Most of the formation has reached residual oil saturation and water cuts are approaching 99% in producing wells.
Solution
A horizontal well with cement liner and fracture completion is proposed. The well targets an area of higher oil saturation and uses frac technology to access oil trapped in pore spaces around the well.
Evidence
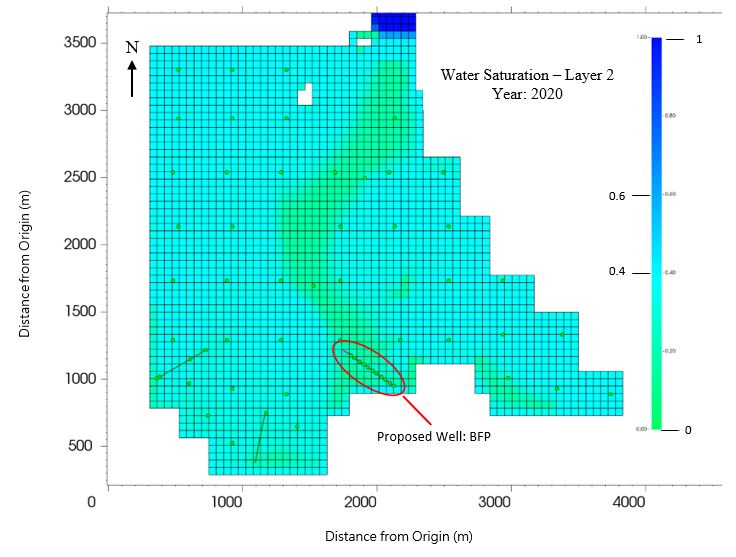
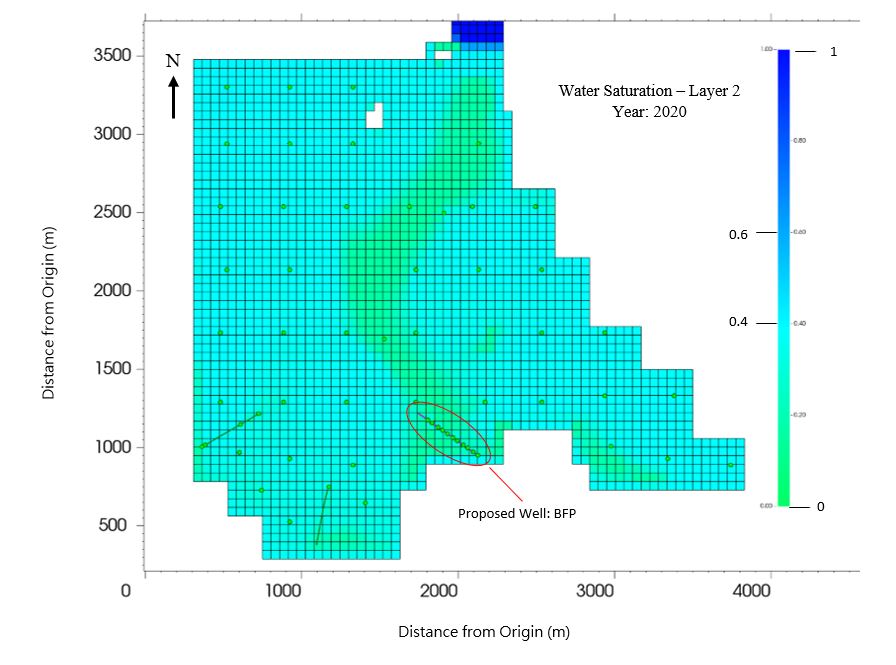
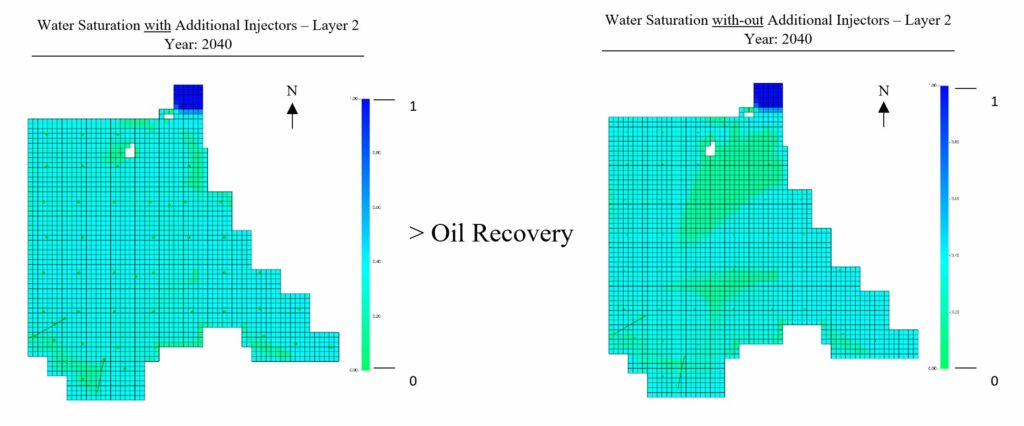
Model simulation has identified areas of higher oil saturation in the Upper Roseray (Layer 2), as seen in green below.
Details About Our Project
Geology and Reservoir Architecture
Depositional History
Formation of Porous Sandstone and Dense Shales
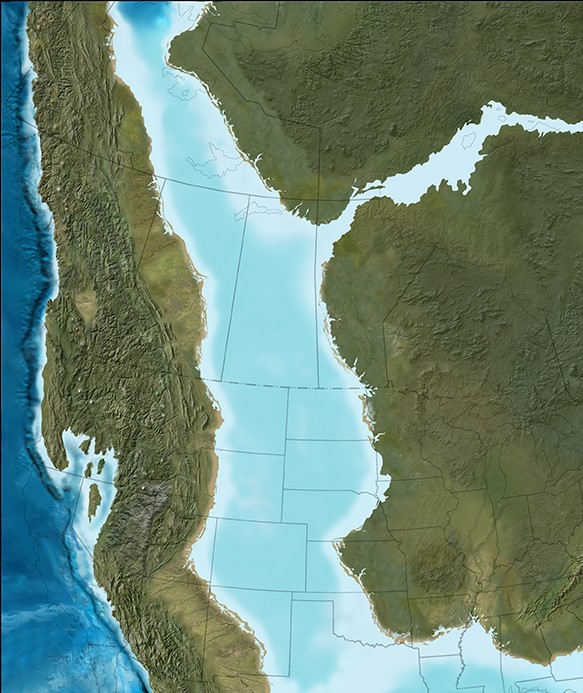
The Roseray formation is a subunit of the Vanguard Group and was formed during the Jurassic/Lower Cretaceous Period at a time when the Western Interior Seaway (Figure 1) crossed through North America and covered what is Saskatchewan and parts of southeastern Alberta. The area near Swift Current at that time was a beachfront where shoreface deposits resulted in well-sorted sand. During transgression and regression cycles, areas of sloping depositional surfaces resulted in what are known as clinoforms, as seen in Figure 2.
Figure 1: Western Interior Seaway
Western Interior Sea Way, Earth.com
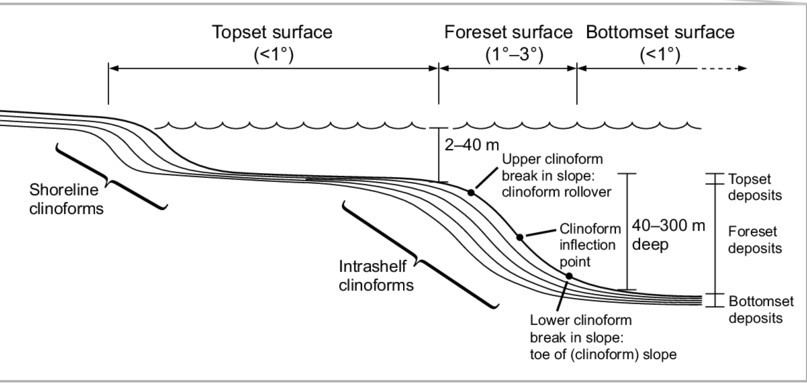
K. Miller, different scales of clinoform and clinothem, Research Gate
These clinoforms trend from high-energy shoreface deposits to lower energy marine environments in a SW-NE direction. During periods of transgression, finer particles of kaolinitic-clays were deposited and during regression well-sorted sand of medium grain size were deposited. The resulting formation seen today is a reservoir characterized by layers of sandstone and shale. These layers of sandstone and shale are clearly depicted in Roseray’s well logs.
Source Trap
Trapping the Oil
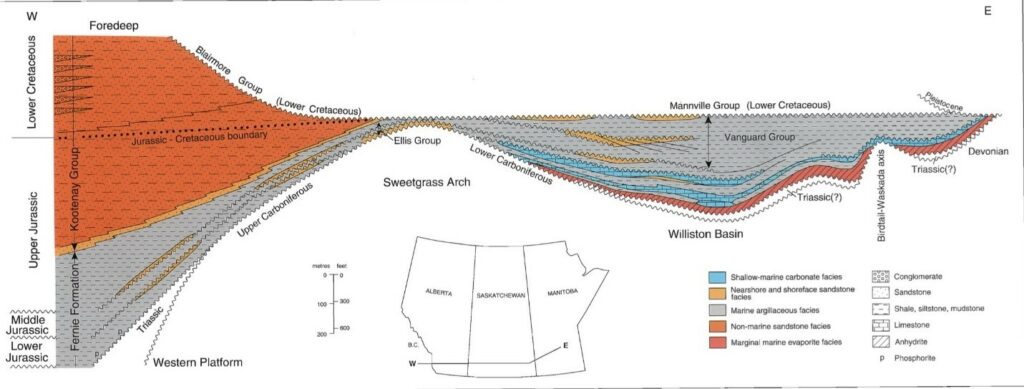
Correlation chart of the Jurassic and lowest Cretaceous formations in the Western Canada Sedimentary Basin, Hopkins, 1981.
The source of hydrocarbons in this formation follows a complex migration pathway. The prevailing theory is that hydrocarbons migrated upwards through the Shaunavon formations through fractures created by tectonic movement of the Sweetgrass Arch, which lies on the western edge of the Williston Basin. The Shaunavon formations were charged by organic-rich shales in the American part of the Williston basin, specifically North/South Dakota and Eastern Montana. Around 100 million years after the Roseray formation, a fluvial process created what is known as the Cantuar formation. The Cantuar is notable because it eroded the Roseray formation around its boundary completely down to the preceding Rush Lake formation made of shale. This formed a barrier of shale underneath and a layer of shale on top to create an erosional trap for hydrocarbons.
Well History
Drilling, Suspending and Current Operation
The first well drilled into the Roseray was in 1952, with another 41 wells drilled by 1965. The remaining 10 wells were drilled between 1995 and 2019. Of the wells that were drilled, 48 of them were vertical with only three being horizontal which were drilled in 2000, 2018, and 2019. Figure 4 shows the pace of development over time versus active producing well count.
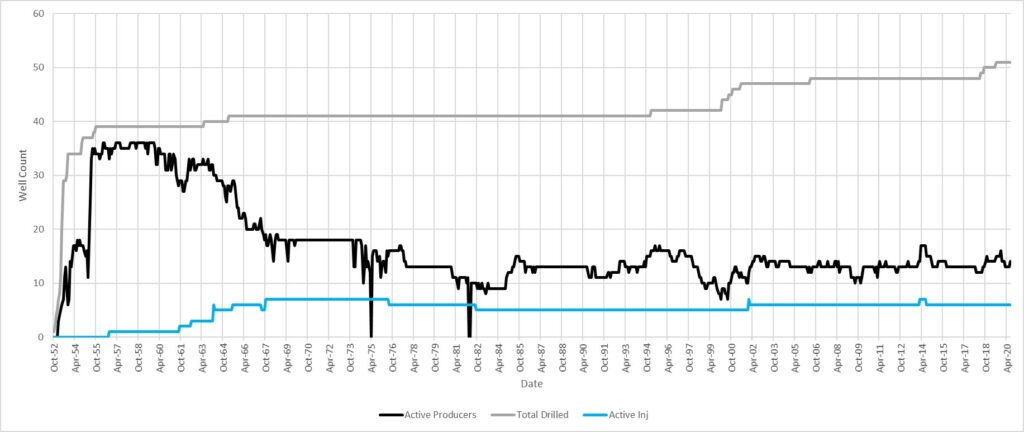
Currently there is 13 of the 51 wells drilled in the pool producing oil. The remaining wells were either abandoned, suspended, or converted to water injectors. The wells were suspended or abandoned due to low production rates and or high water cut. Since the development of the pool there have been 11 wells converted over to water injection with 1 well drilled specifically for injection. There are currently 6 active water injection wells.
Pressure
Dropping Below the Bubble Point
The initial pressure was recorded as 9060 kPa, with an average pressure gradient of 8.48 kPa/m. The bubble point was determined to be 8916 kPa from the Standing correlation and therefore the reservoir was initially above the bubble point. At some point, between October 1953 and November 1956 (no pressure tests conducted between these dates) the pressure dropped below the bubble point.
Reservoir Characterization
Logs
Layers of the Roseray
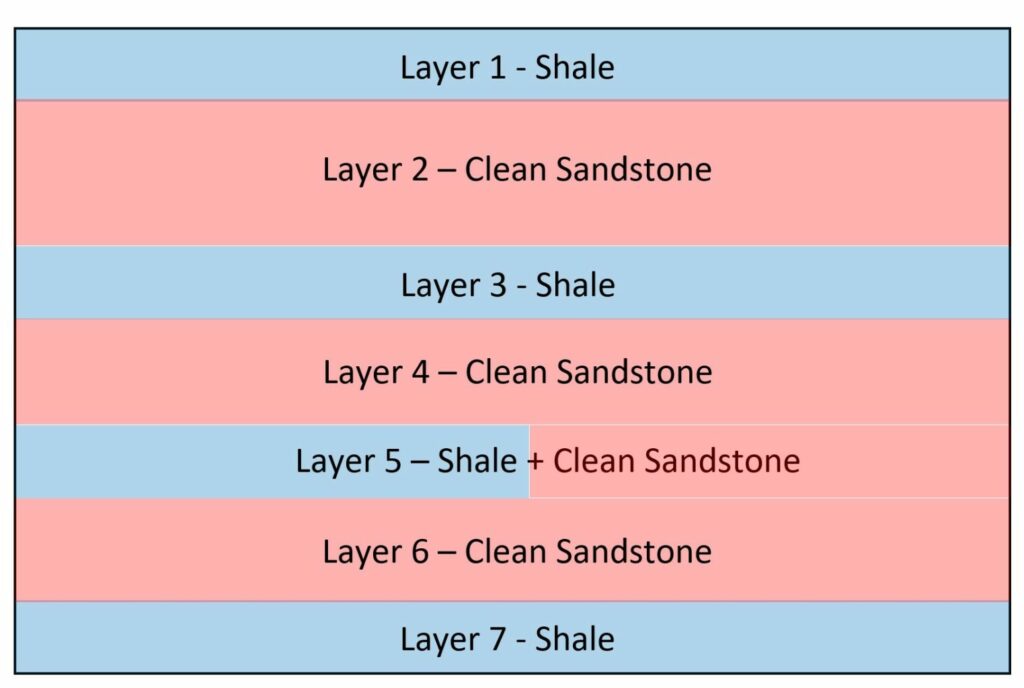
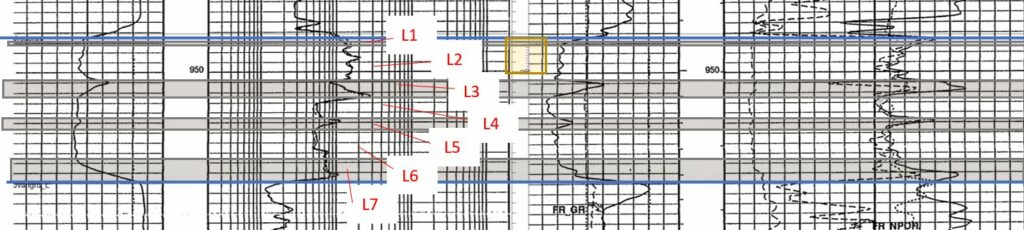
The logs of the Roseray agree with the depositional geologic history of the formation. The Roseray is characterized by interchanging deposited layers of shale and sandstone. The logs show a continuous shale steak that runs through the middle of the Roseray. Shale also caps off the top and bottom of the formation. Partial shale streaks are identified mainly in the western part of the formation. The formation has been divided into 7 layers, as seen in Figure 7.
Porosity and Permeability
This pool had a total of 10 cores that provided enough data to determine that the average porosity in this reservoir is around 27% with a standard deviation of +/- 5.9%.
The average permeability was found using a logarithmic correlation to be 1304 mD with a standard deviation of +/- 2167 mD.
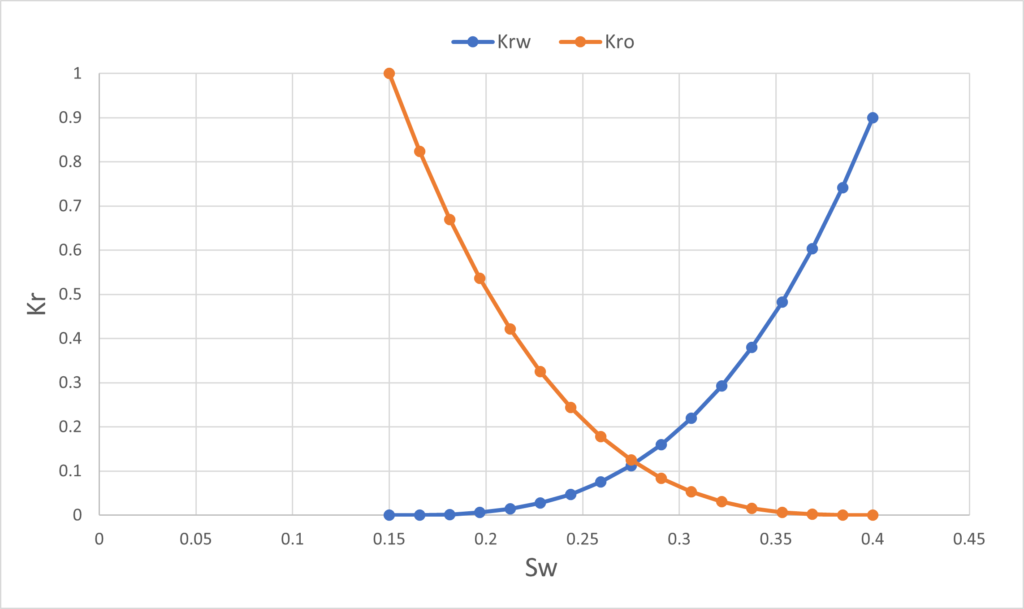
Relative Permeability
The Honarpour correlation was used to derive the relative permeability curve for this pool. An initial water saturation of 15% and a residual oil to water saturation of 35% was used. The reservoir can be characterized as intermediate/oil wet because the intersection of the curve is less than 0.5.
Water Flood Analysis
Water Flood Effectiveness
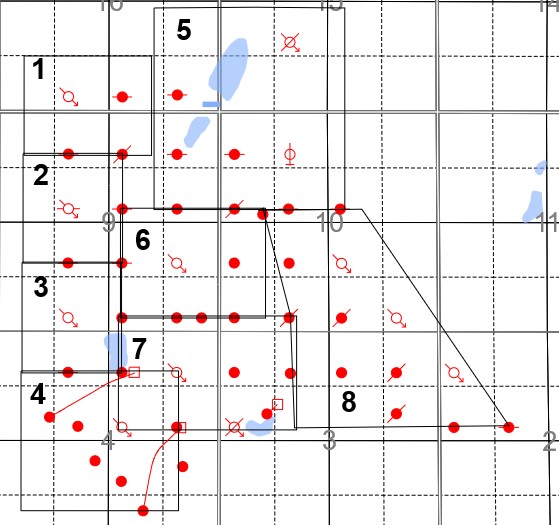
The sweep efficiency calculations are dictated by the injection pattern. In our pool there are 7 areas with similar patterns to an inverted 5 spot as well as 1 line drive, Figure 9 (injection pattern map) is a portrayal of how the pool was separated into areas. Sweep efficiency for area 1 (inverted five spot) was calculated at 90.8%. The line drive pattern found in area 8 has a sweep efficiency of 81.9%.
Figure 9: Injection Patterns
Reservoir Modelling
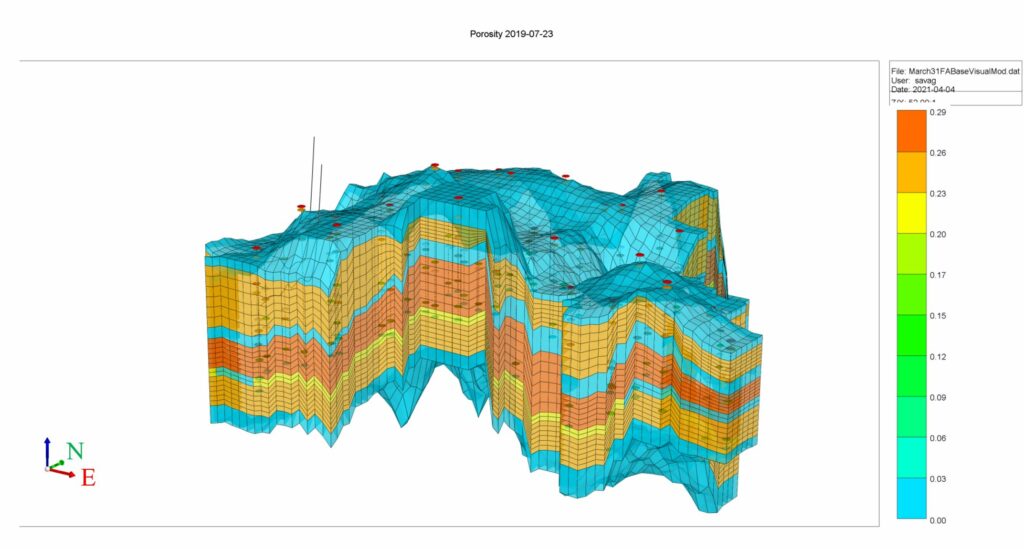
A model in CMG was generated using well log picks. Figure 10 below shows the resulting CMG model of the Roseray and the porosity of each of the 7 layers. Blue shows the low porous shales regions. Red, orange and yellow show clean sandstone regions. The edges of the reservoir model do not vertically taper to zero (the Roseray does taper to zero). This was done to save time when building the model. Taper on the sides of the reservoir would increase the OOIP. The boarder has been slightly extended to account for this. The model has a large vertical exaggeration of 52 to 1. This makes layer identification easy, however it should be noted that the Roseray does not appear this tall compared to its length and width in real life. The wells added to the model have been preferred, normally in layers 2 and 4.
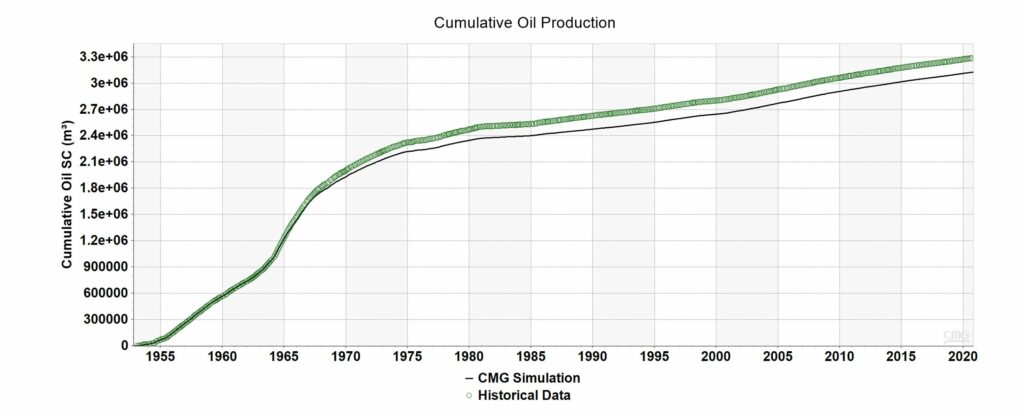
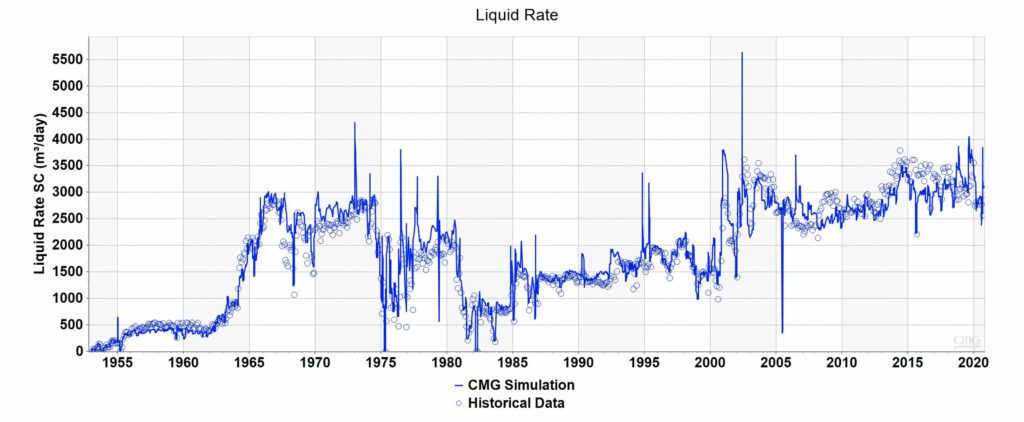
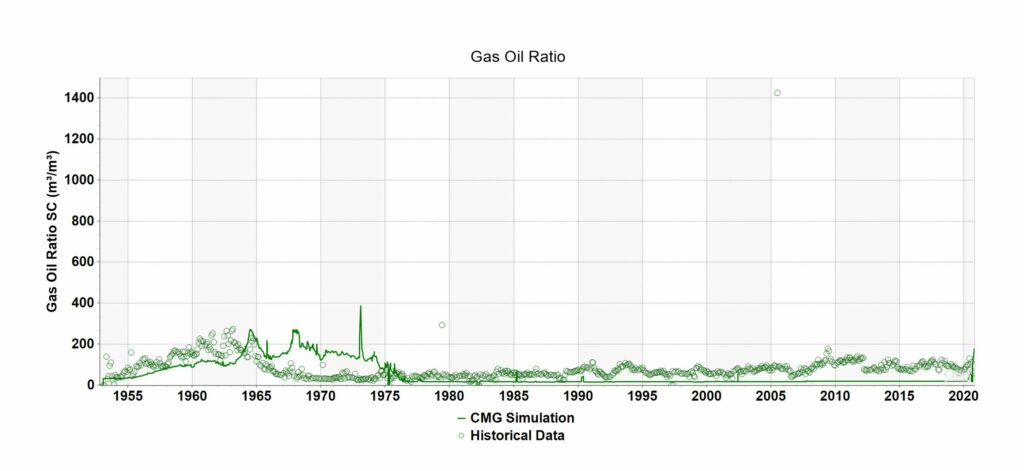
History Matching
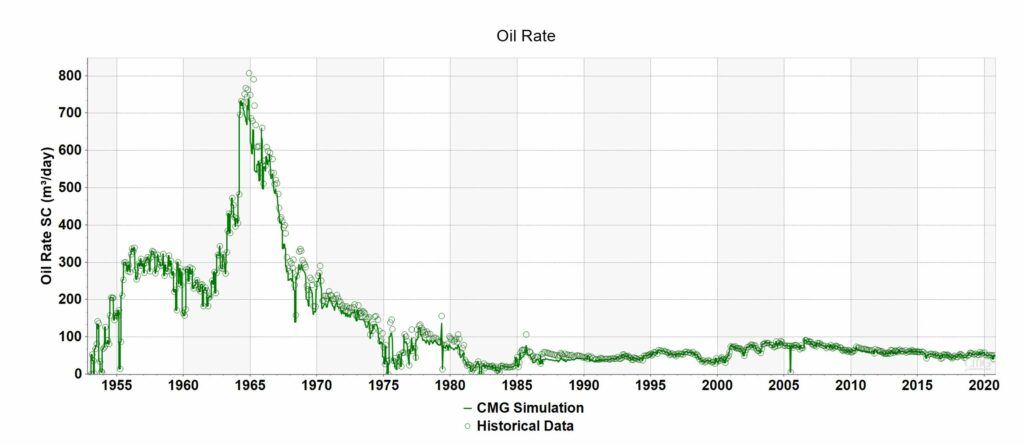
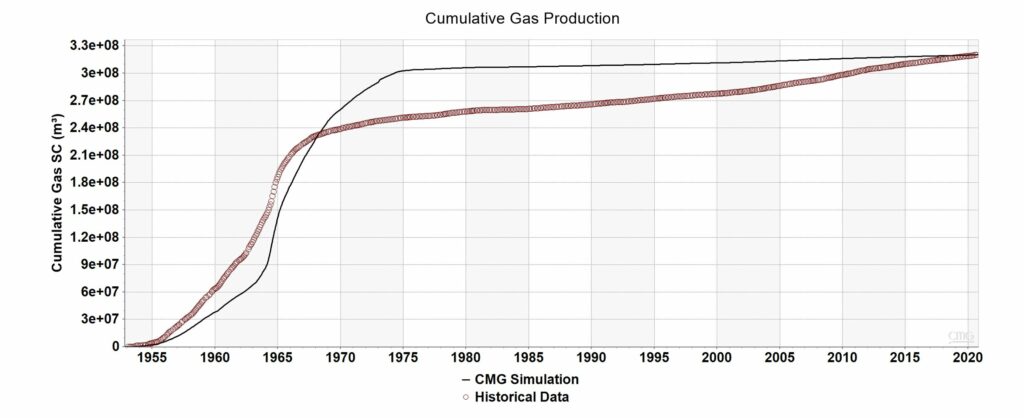
Using oil production as the constraint, a reasonable history match was obtained. The photo gallery below shows the accuracy of our history match by comparing simulated data to historical data.
Development Plans
Further Development of the 69 Year-Old Producing Formation
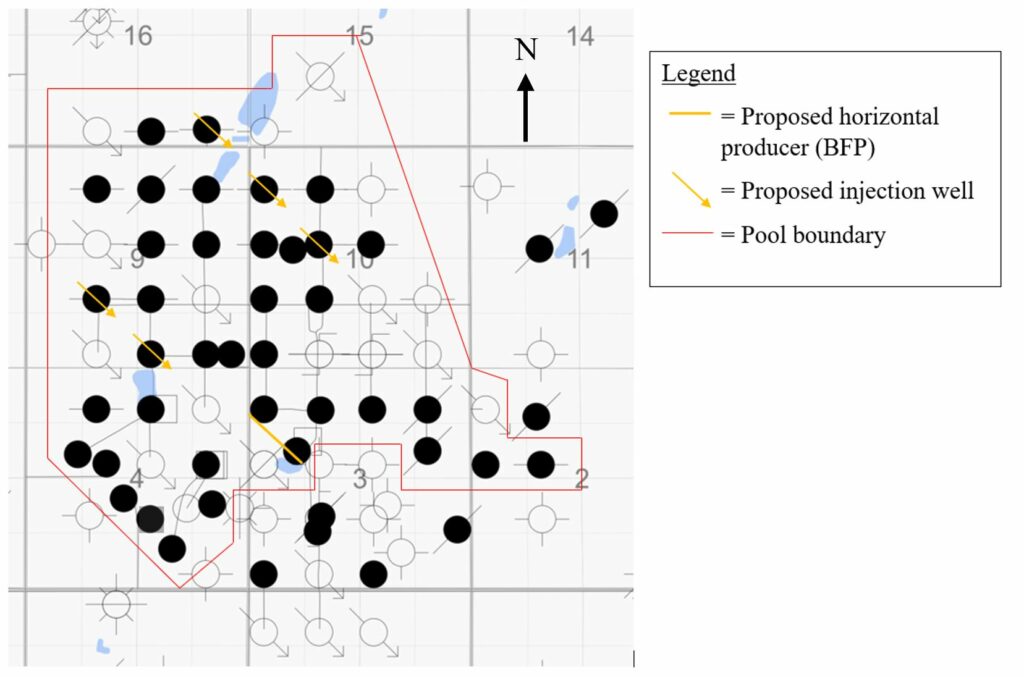
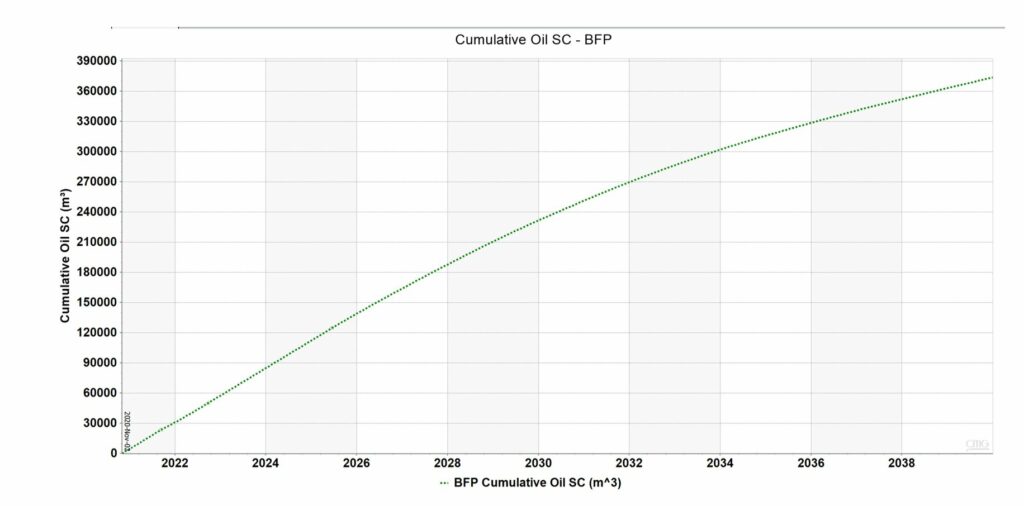
The results of our model have highlighted areas of higher oil saturation (green). The model has been used to predict the most productive and economic development plan. Three well location were considered and the best option was determined to be a horizontal well called BFP, located near the south boarder. The development plan also adds five new injection wells that aim to complete injection patterns, increasing sweep efficiency and oil recovery while reducing water disposal costs.
As seen below, if BFP is drilled today it is predicted to approach a cumulative production of 400 000 cubic meters of oil by 2040.
The effectiveness of the addition of 5 injectors, completing line drive injection patterns can be seen below. In 2040 much more of the oil in layer 2 has been recovered by adding these injectors today.
Drilling and Completions
Drilling BFP
Drilling
Using a 349 mm tricone bit the surface hole is drilled to a 200m TVD, this is followed by the 244.5mm surface casing being ran downhole and cemented in place. The intermediate hole is drilled from surface using a 222mm polycrystalline diamond compact (PDC) bit to a depth of 728m, where the kick-off point (KOP) for the build starts. The build is drilled at 8°/30m until it reaches 1066m MD, which is the intermediate casing point (ICP). The 177.8 mm intermediate casing is then run downhole and cemented in place. The lateral section is drilled to a total depth (TD) of 1531m MD using a 159mm PDC bit. Next the liner hanger is set 20m above ICP, followed by the liner being cemented in place. The geological prognosis, bits, casing, mud, and cement programs can be seen below.
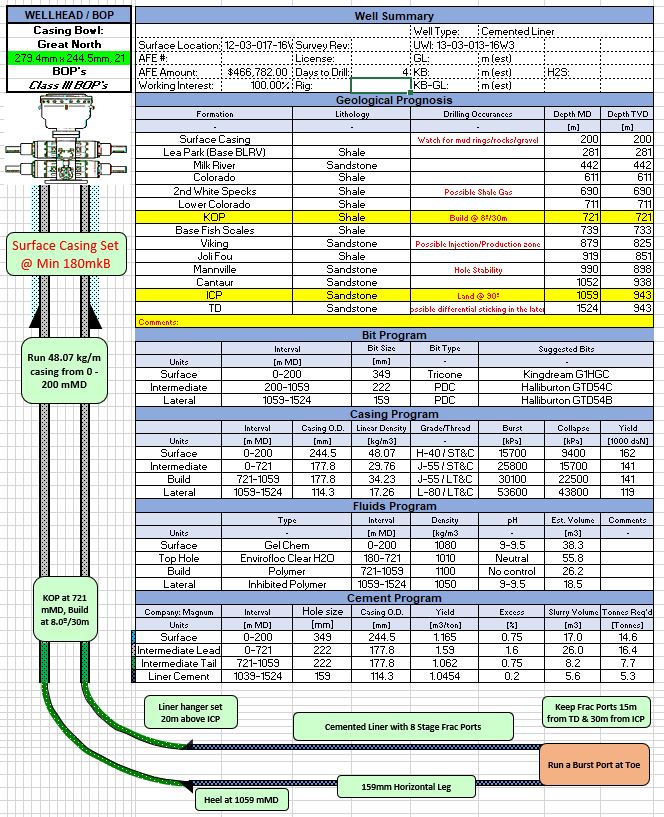
Completion
An 8 stage frac completion is planned due to the quarter mile lateral. The spacing for each stage is 50m with the first stage being 30m below ICP and the last stage being 15m before TD, this allows for a 10m error in placement. The lateral section will first be perforated, then each stage is isolated with packers and completed one at a time. For the completion a 30/50 proppant is used, this allows for better conductivity and strength. Each stage is completed using 8 tonnes of proppant per stage.
Facilities
Rebuilding of the Existing Facility and Additions for the Development Plan
For academic reason we have assumed that the existing Success Main Battery has burned down and a new one will need to be designed for the base case production. The new injection battery will be capable of handling the emulsion produced from the current producing wells, as well as the injection rates of the current water injection wells. We currently are dealing with about 320 bbl/d of oil, 17100 bbl/d of water and 200 MCF/d of gas. With a production emulsion rate of about 17400 bbl/d, it is crucial to have adequate sizing of certain equipment to be able to process this large liquid production.
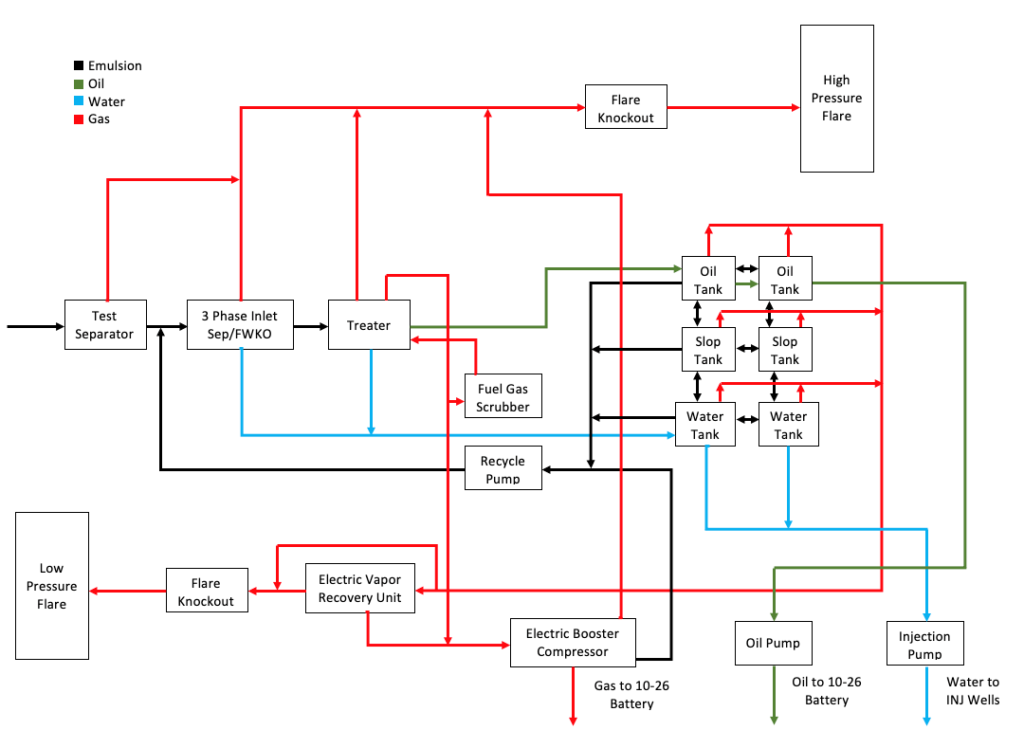
To view our detailed facility design PFD’s, click HERE.
Equipment Sizing
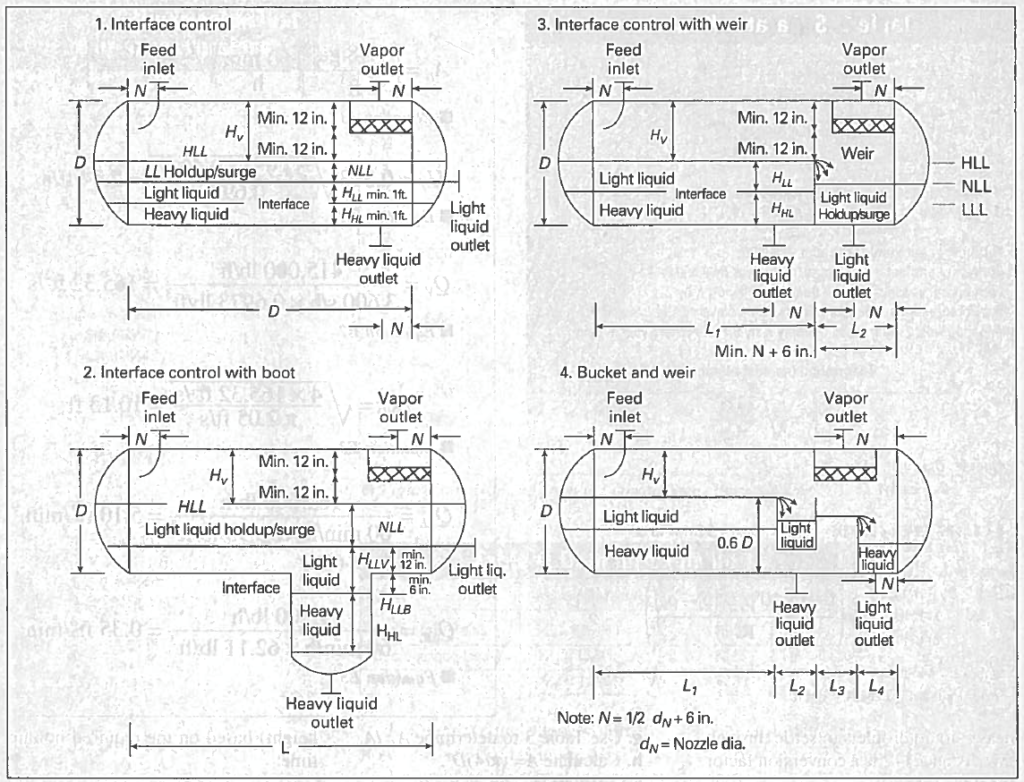
The first and most important piece of equipment sized was the 3-phase separator or more commonly known as the free water knockout (FWKO). The purpose of a FWKO in an oil facility is to separate the inlet oil emulsion into its various substances, water, oil, and gas. A FWKO does so by utilizing residence (settling) time, as well the difference in densities, to drain out the majority of the easily removable water from the production stream and send it to the water storage tanks. The size of the FWKO was determined using our base case production rates of approximately 17,100 bbl/d of water, 320 bbl/d of oil, and 200 MCF/d of gas. The method used to size the FWKO involved a set of steps made by William Svrcek, and Wayne Monnery as seen written in their article “Successfully Specify Three-Phase Separators” in the September 1994 edition of Chemical Engineering Progress. Following the steps under “Horizontal design procedure: no boot or weir” we determined a FWKO with the diameter and length size of 9.65 ft and 32.85 ft, respectively. However, both of these were rounded to nearest common diameter and length sizes of a typical FWKO size found in the field, which came to a 10 ft by 40 ft FWKO.
The next two pieces of equipment that were sized was the water injection pump and the water storage tanks. The water injection pump was sized based of communication between the group and current facility engineers in the oil and gas industry today. After comparing many different pumps with different horse powers and stages, we concluded that a 450 HP water injection pump with 29 stages would be sufficient for our base case injection rate of about 17,100 bbl/d. The water storage tank sizes were based on the current production rate of water and the water injection rate for our waterflood program. For our projects case, the water that was produced was re-injected into the reservoir, therefore there was no leftover water to store. However, 2 water storage tanks both with the size of 2000 bbl, were chosen in case of a scenarios where water needed to be stored. The size of the two water tanks is sufficient enough for 2-3 days of storage.
Additional Facilities Required for the Development Plan
Based on our best option from the proposed development plans, the additional equipment and their respective costs were determined. The maximum production rate of the proposed horizontal well (BFP) and the maximum combined injection rate of the five new injection wells, were added to the current production and injection rates to determine the number of additional pumps and vessels needed. After further analyzation, it was determined that two more FWKO’s and two more injection pumps would be required to handle the new production and injection rates. The cost of these additions came to a total of $3.036M, which includes installation costs. The additional facilities cost mentioned before, is of the lower end compared to the facility costs associated to the other development plans.
Economics
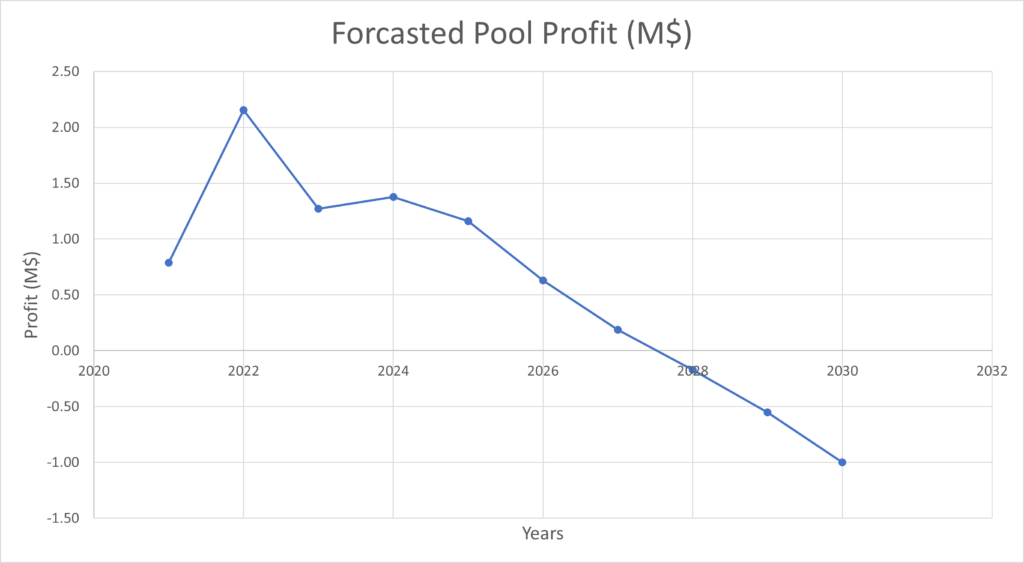
The development plan is predicted to cost 4.4 M$ with a pay out period of 38 months. The pool was determined to be economically operable for another 5 years, makings 3.2 M$ in profit over those 5 years with our development plan. In 2028 it is predicted that the pool will not make profit and all wells should be shut in prior to 2028.
Feasibility
As a reservoir engineer would say, “it is dark down there” and predicting fluid behavior in a 69-year-old reservoir comes with lots of uncertainties. Although water production rate was modeled accurately over-all, some wells produced either too much or too little water. This questions the accuracy of our predicted water saturations throughout the pool and farther sensitivity analysis should be taken to evaluate the risk of our development plan.
Our photo gallery
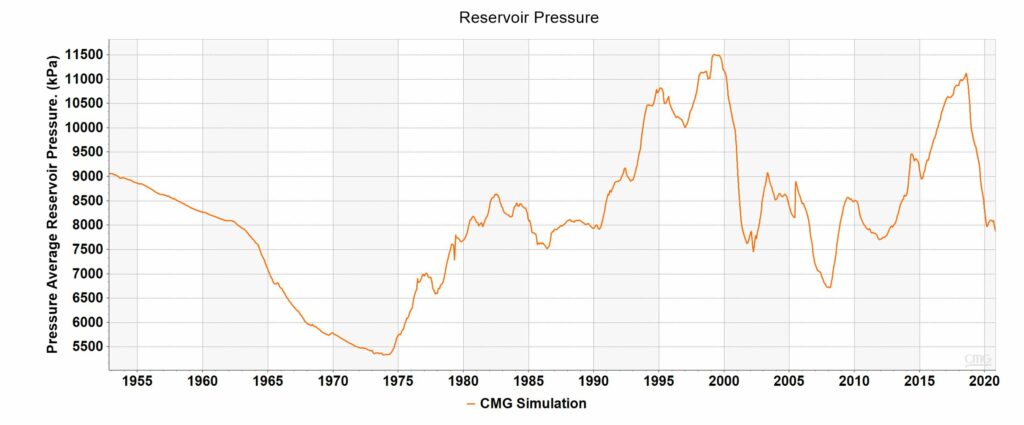
Liquid Rate Simulated vs Historical Liquid Rate Effectiveness of Additional Injectors GOR Simulated vs Historical GOR Cumulative Oil Simulated vs Historical Cumulative Oil Proposed well (BFP) predicted cumulative oil production Cumulative Gas Simulated vs Historical Cumulative Gas Proposed well (BFP) in low water saturation zone Water Cut Simulated vs Historical Water Cut CMG Model Reservoir Pressure Simulated (no historical data available) Development Plan Oil Rate Simulated vs Historical Oil Rate Figure 7: Cross-Section Figure 7: Injection Patterns Figure 5: Layers of the Roseray Figure 4: Well Count Figure 3: Sweetgrass Arch 123 Figure 1: Western Interior Seaway Earth.com Figure 2: sand and mud deposition K. Miller, Research Gate
