Project Category: Software
Join Our Presentation
About our project
The project’s main objective of this project is to aid the City of Calgary in optimizing their Pavement Asset Management system. Our project allows the city to efficiently manage their investments in both road and transportation maintenance through a cost-effective system.
Currently, the City asses the condition of the roads through several different methods:
- The hiring of a third-party consultant for Surface distress assessment on major roads and manual inspection for local roads. The problem with this system is that hiring a consultant to collect data and generate road condition indices costs the City $300,000 per year, which includes only 10% of the total number of roads in the city.
- Manual inspection presents issues regarding the quality of the data in terms of its repeatability and comparability. In order to come up with an efficient and cost-effective solution to collect and monitor the quality of the roads, the City of Calgary has explored using the Calgary Fleet Operating System [CFOS – Any city-owned vehicle IE. A police car, a garbage disposal truck, a peace office car etc.] and the third-party BumpRecorder application for smartphones to build a dedicated in-house solution.
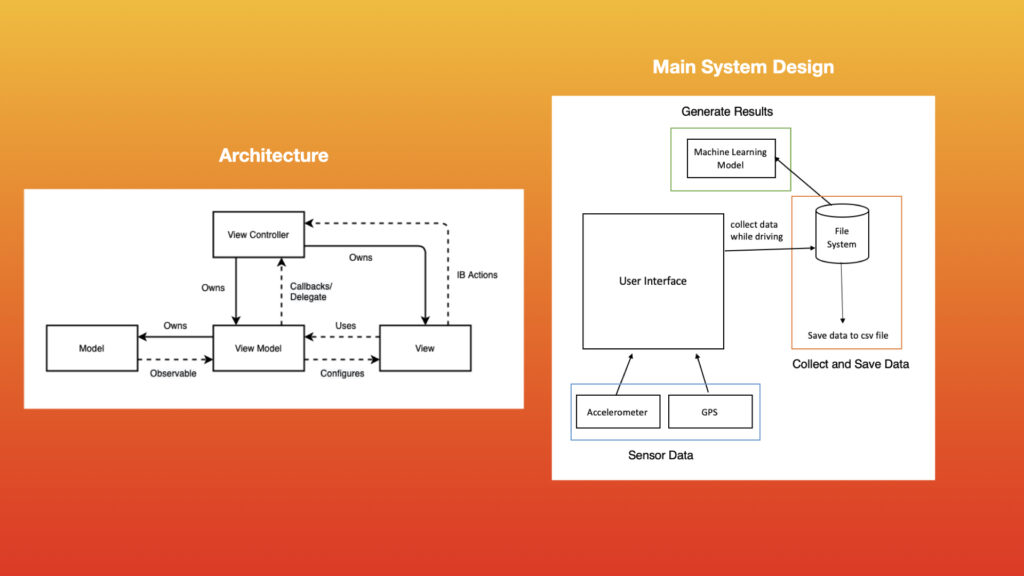
The project aims to develop a machine learning model that will output a Pavement Quality Index [PQI] with similar results as the consultant and a specific android app designed to export data towards an aggregated database. This would allow the City to collect their own set of data when utilizing the already-existing CFOS network to create a relatively cheap, quick and effective way to optimize their Asset Management System and planning.
Meet our team members
Jingyi (George) Gong


Mattaniah (Matt) Cruz

Rohit Kadhe


Diana Mijangos


Ryan Der


Details about our design
HOW OUR DESIGN ADDRESSES PRACTICAL ISSUES
The cost of running the model, and collecting your own data is significantly less expensive than the hiring of a third-party consultant to calculate and measure the PQI on an annual basis.
This allows for the asset management team to keep up to date with PQI values, and to utilize the already existing CFOS network to continuously train and improve our model. Further improving model predictions in the future.
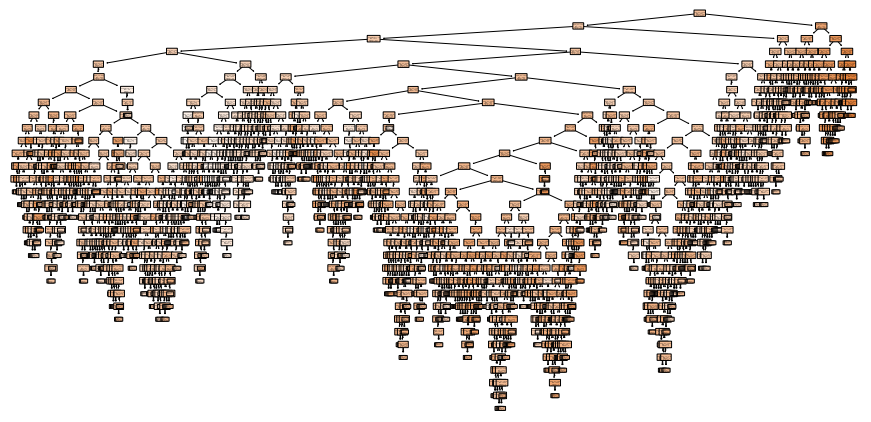
WHAT MAKES OUR DESIGN SOLUTION EFFECTIVE – MACHINE LEARNING MODEL
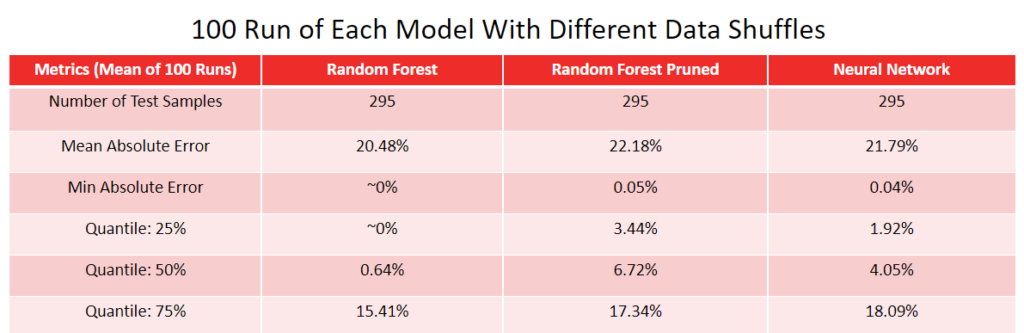
We tested our model and compared it to other model types on a consistent basis and found that we could achieve a lower error rate while using a model type designed to improve significantly with more future imported data.
In addition we tested and tuned our features to identify key characteristics of PQI and measured metrics such as speed, acceleration and road type.

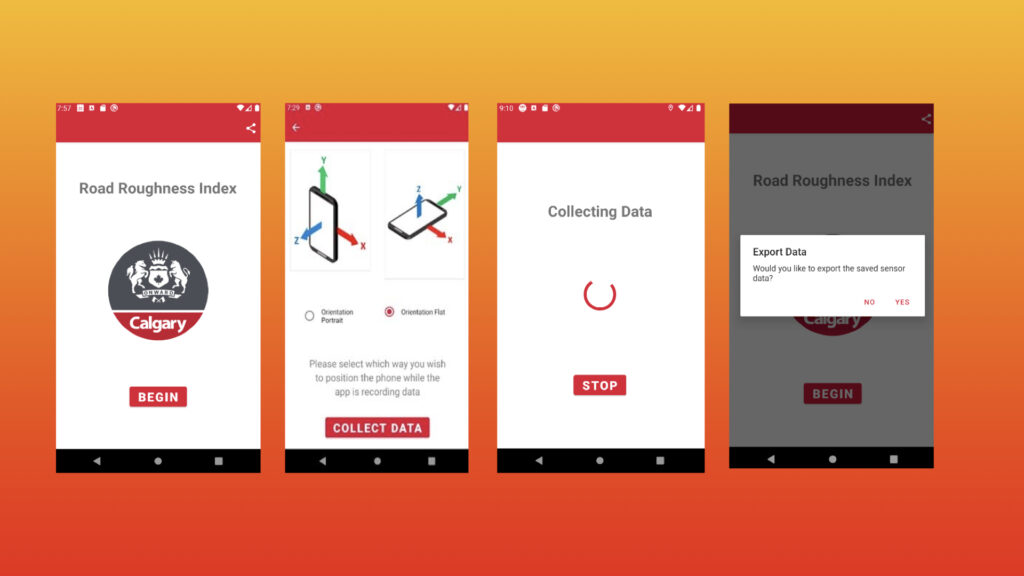
WHAT MAKES OUR DESIGN SOLUTION EFFECTIVE – ANDROID APPLICATION
Our initial vision of the app was to allow for cost-effective and easy data collection from multiple sources and to then aggregate the data to a central database. Thus we created an app with a wide range of compatibility that can be run on any phone running Android 7.0 or higher.
HOW WE VALIDATED OUR DESIGN SOLUTION
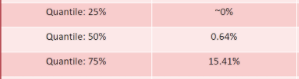
Our team was provided with the existing PQI values measured by the consultant which was used to compare against our calculated PQI values. Ideally, we want the PQI value produced by our model to have a small deviation when compared to the consultant’s PQI value. This gives us a way to quantify our accuracy for each road segment. To validate our project’s success we tested multiple models as part of an iterative approach and compared the model’s results to the consultant’s data. We initially considered a maximum deviation of 30% from the PQI measured by the consultant valid, and our final mean error value was roughly 20%

FEASIBILITY OF OUR DESIGN SOLUTION
By collecting data of several cars every day you can build a holistic database that encompasses the entire city. This data is then aggregated to a central database that can further output and tune the existing model.
Partners and mentors
We want to thank the many people who helped us with this project. Our Machine Learning specialist and Academic Advisor Dr. Henry Leung and our Teaching Assistant Nima Sarajpoor guided us through the process with patience and great advice. As well as our Industry Sponsors from The City of Calgary whose help was invaluable.
Chris Yang PEng
Nan Xie, PhD, PEng

Henry Leung, PhD, PEng
Teaching Assistant
Nima Sarajpoor
Our photo gallery